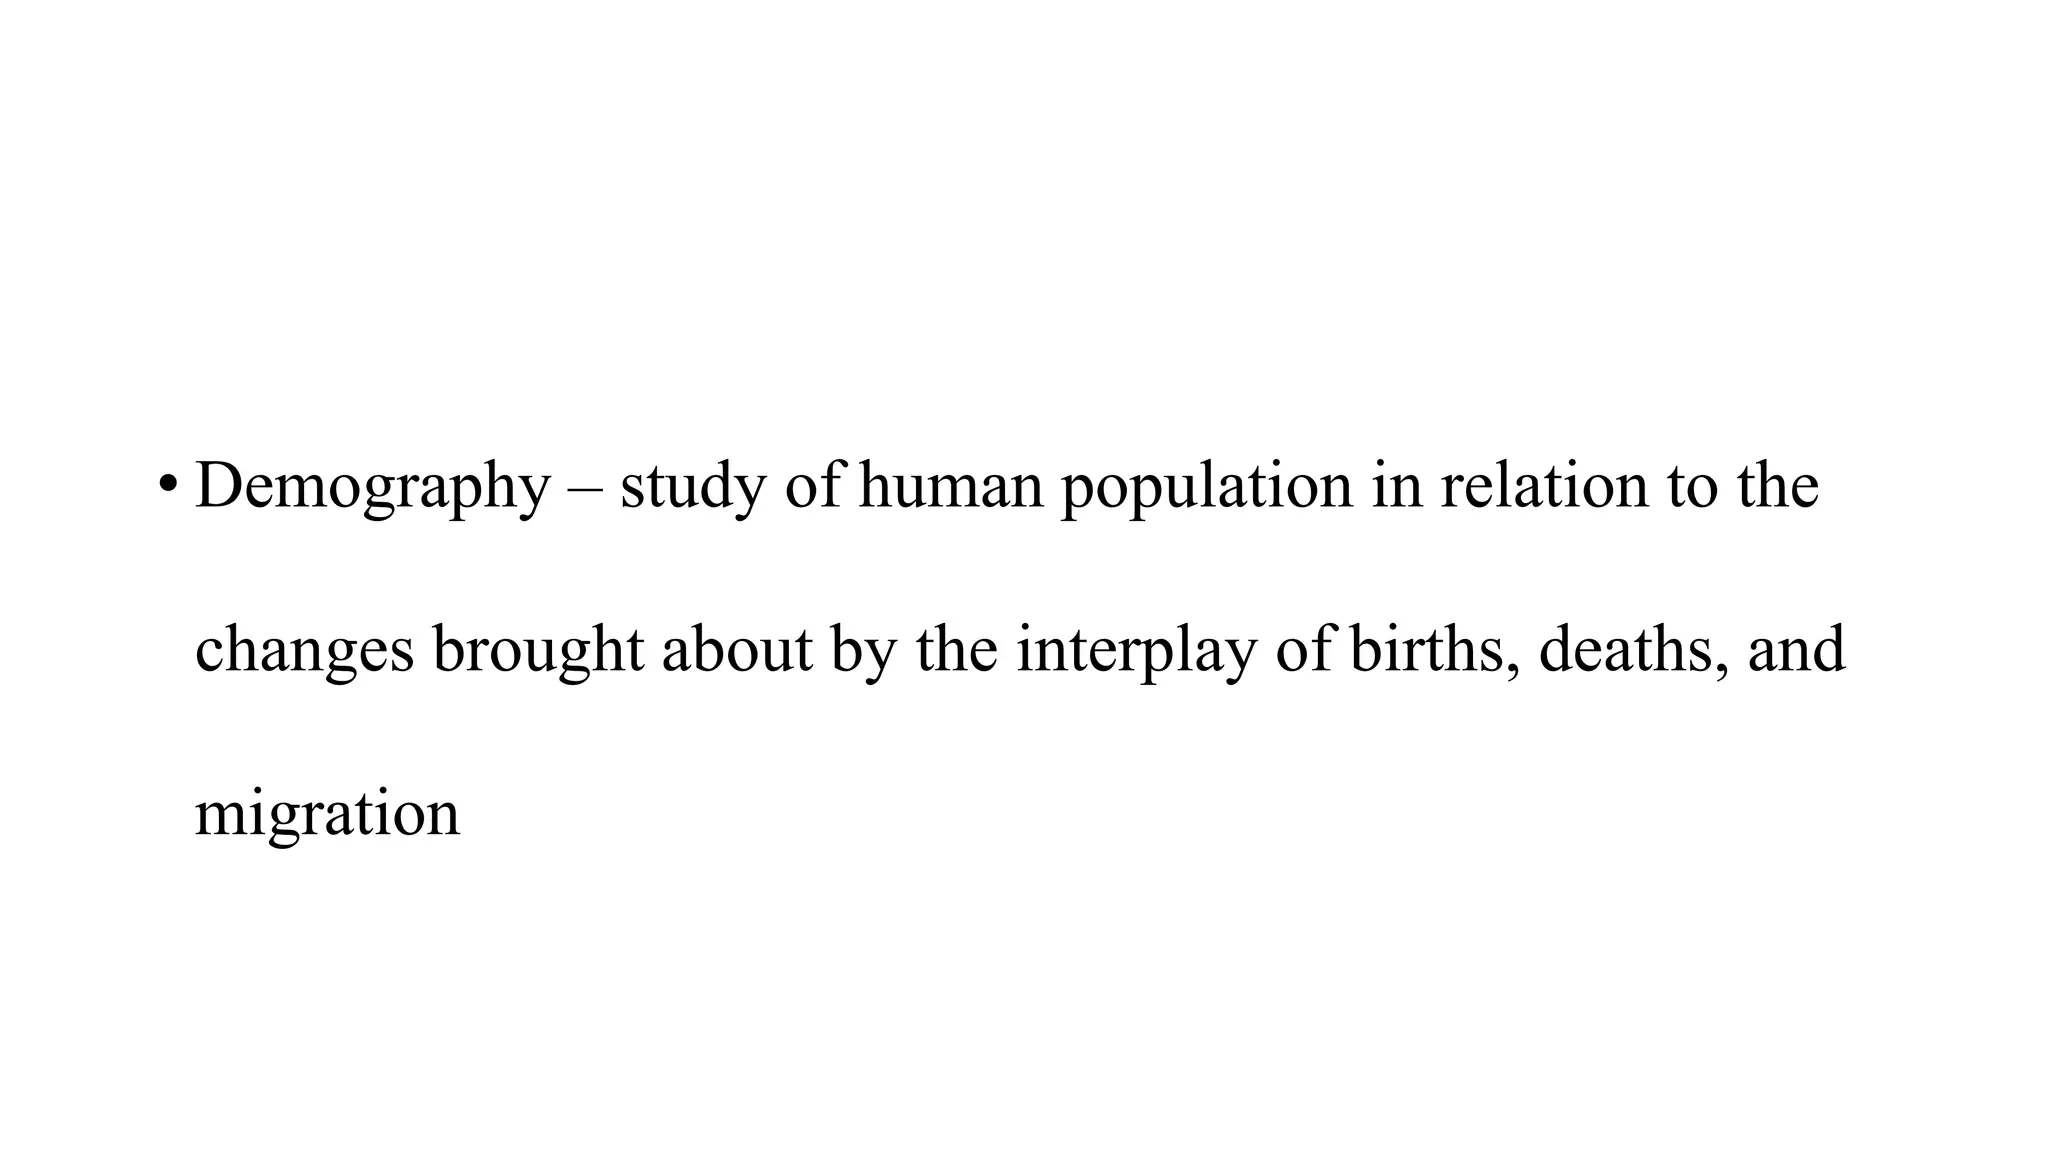
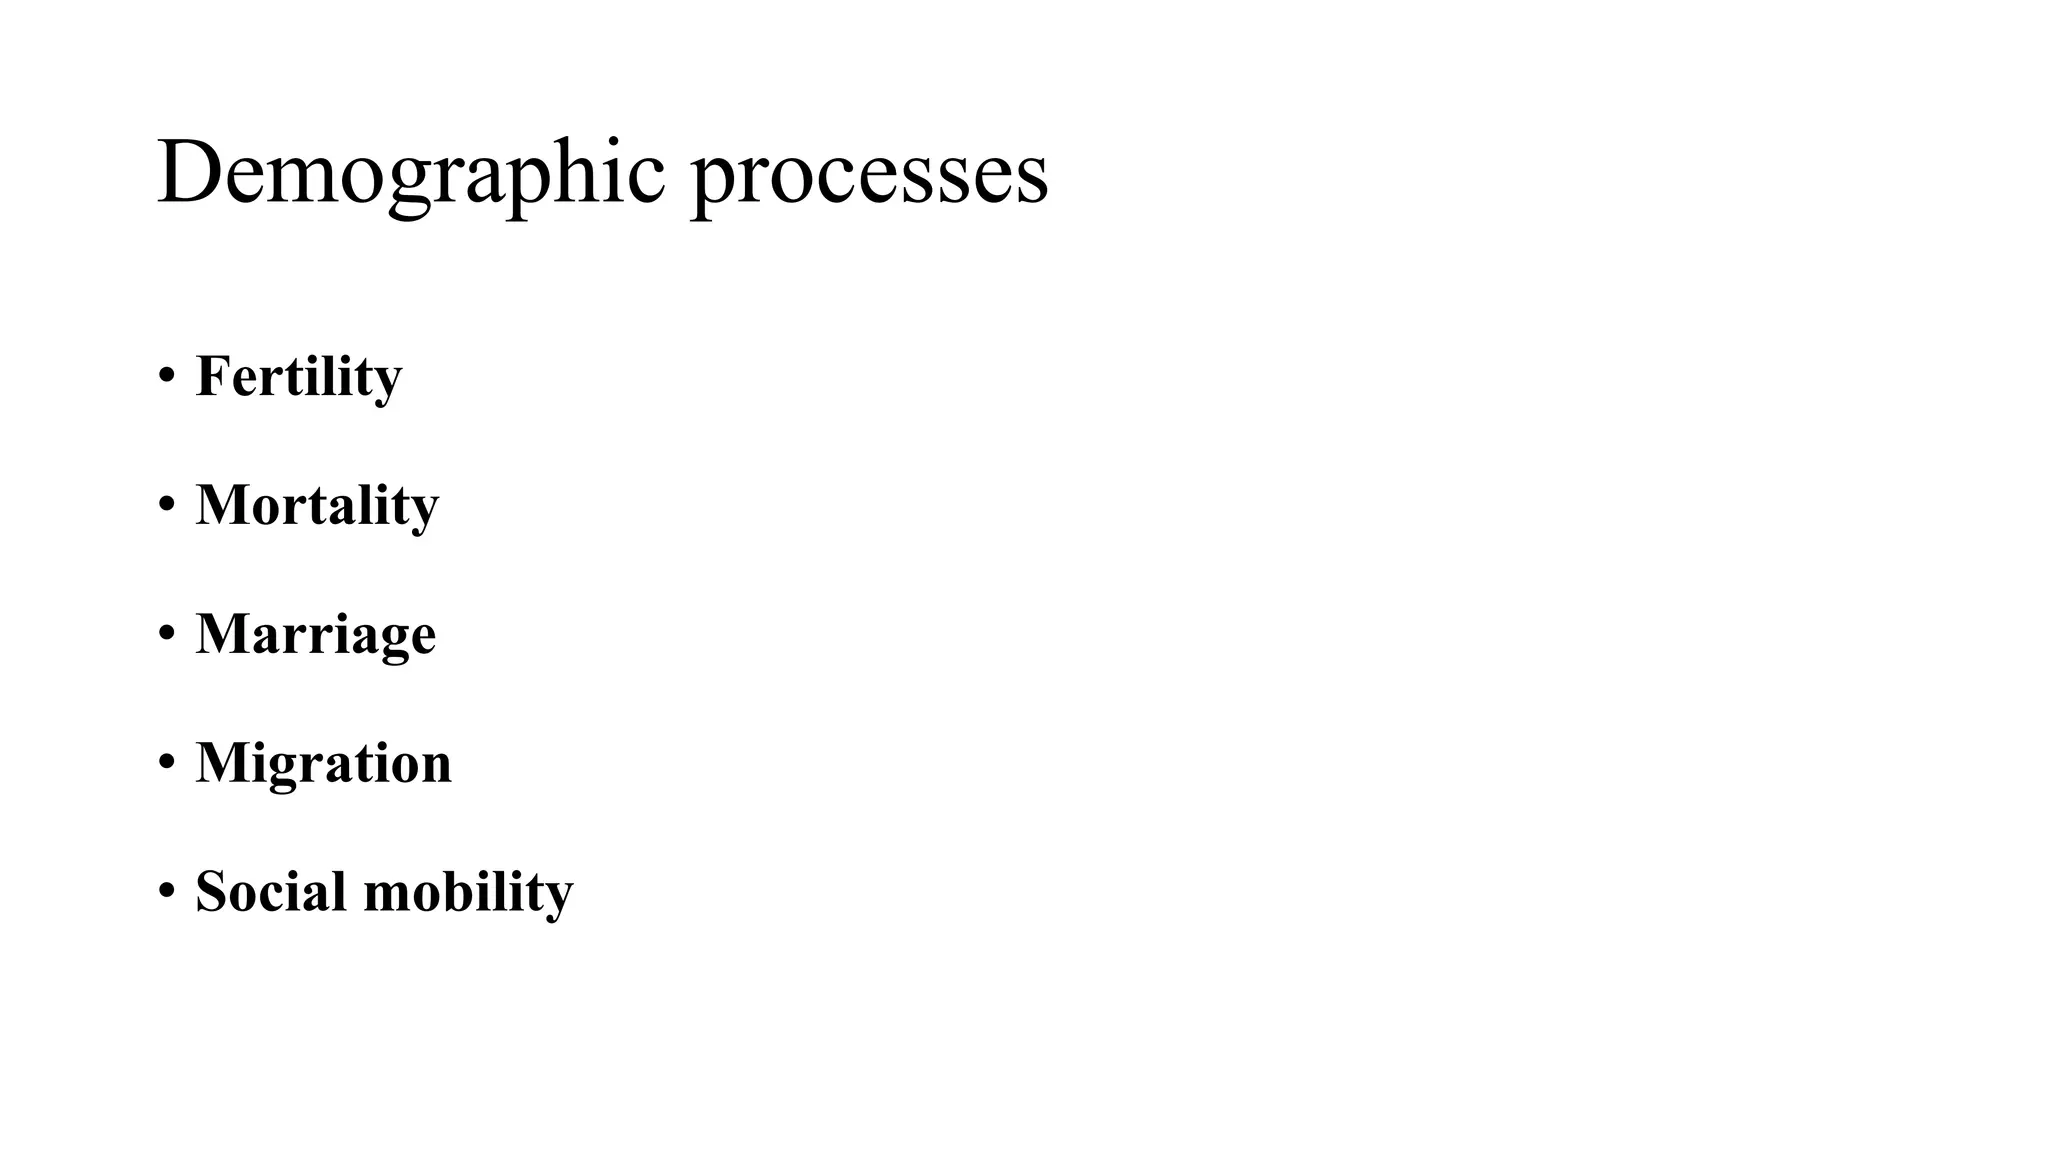
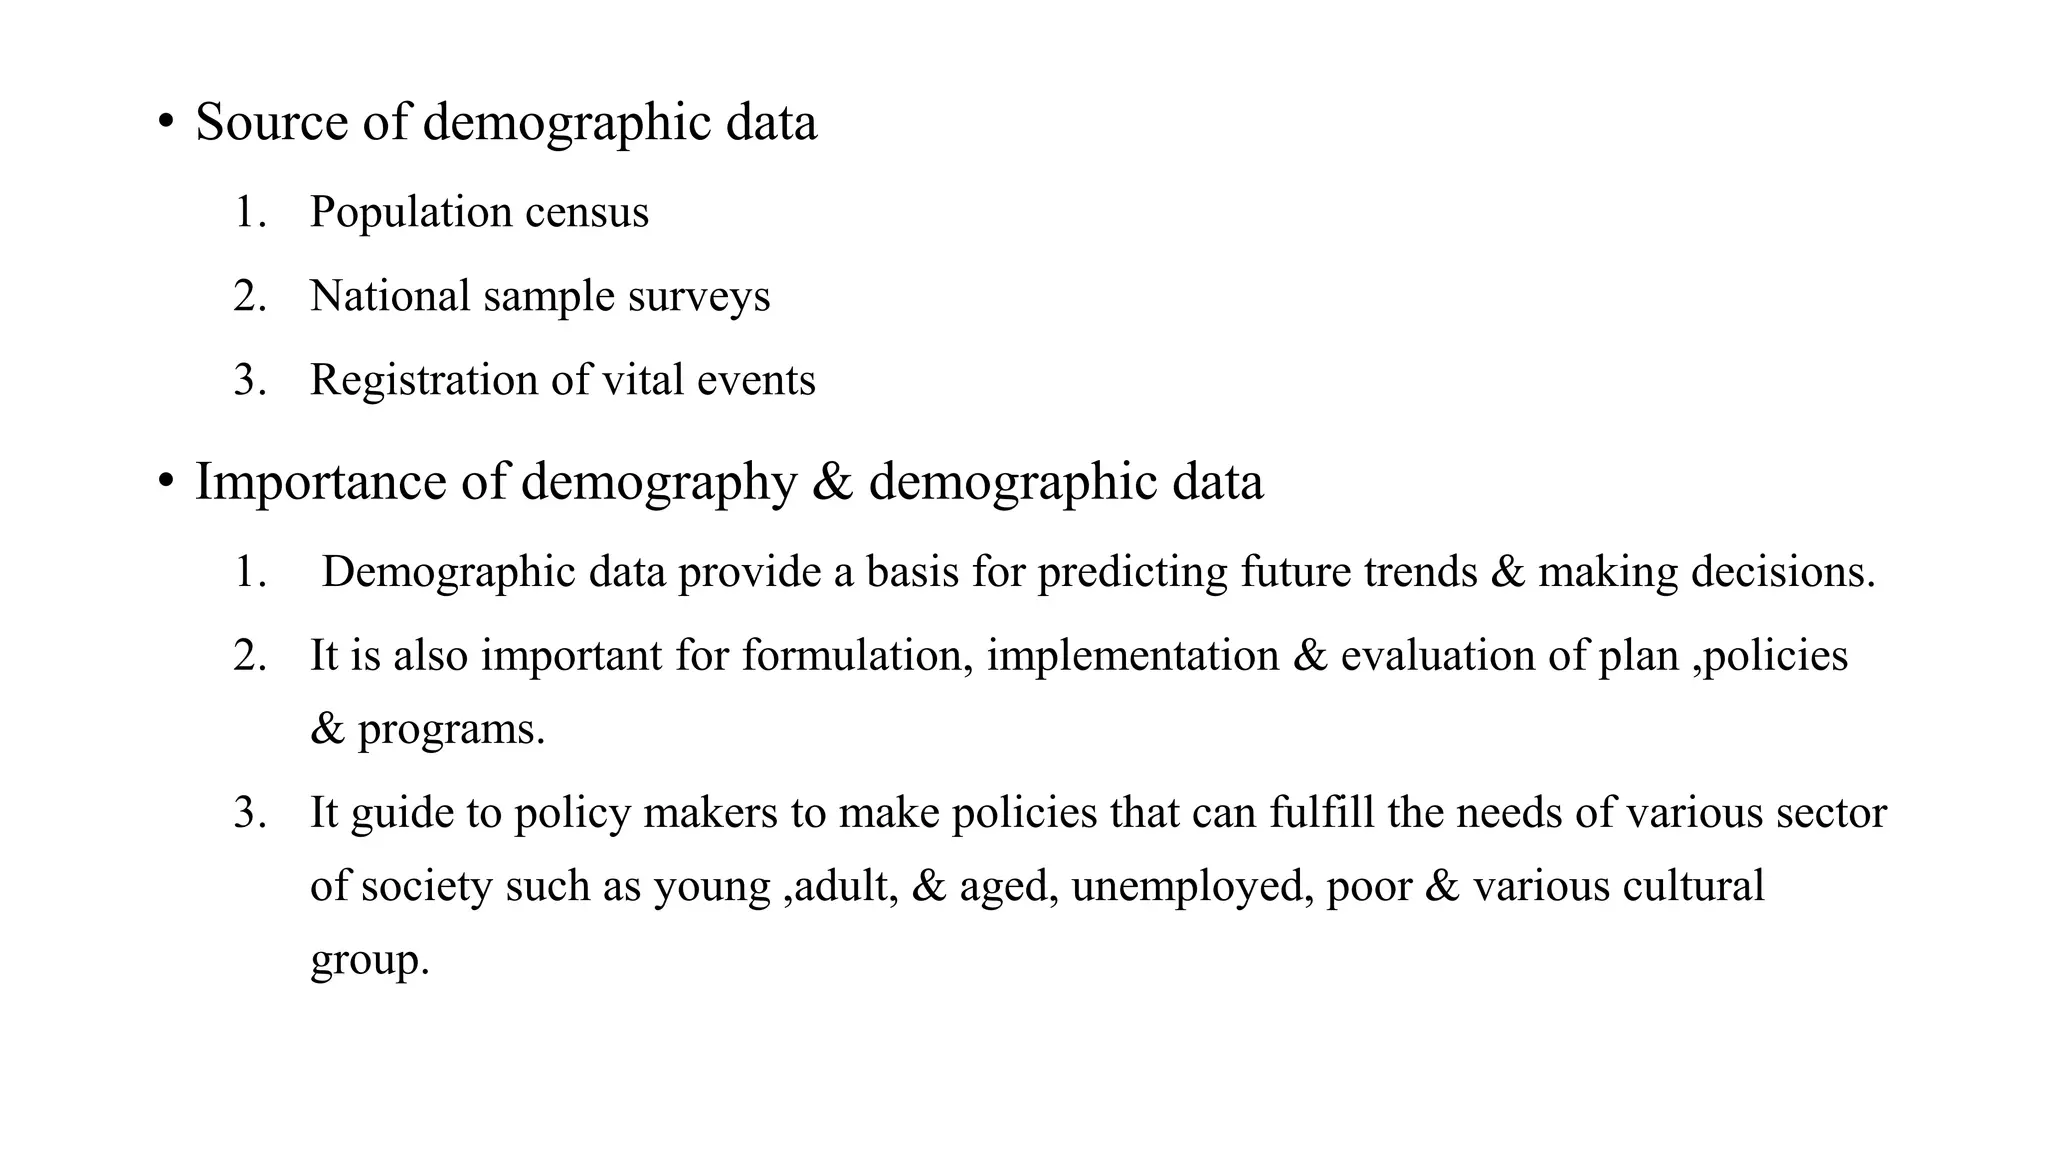
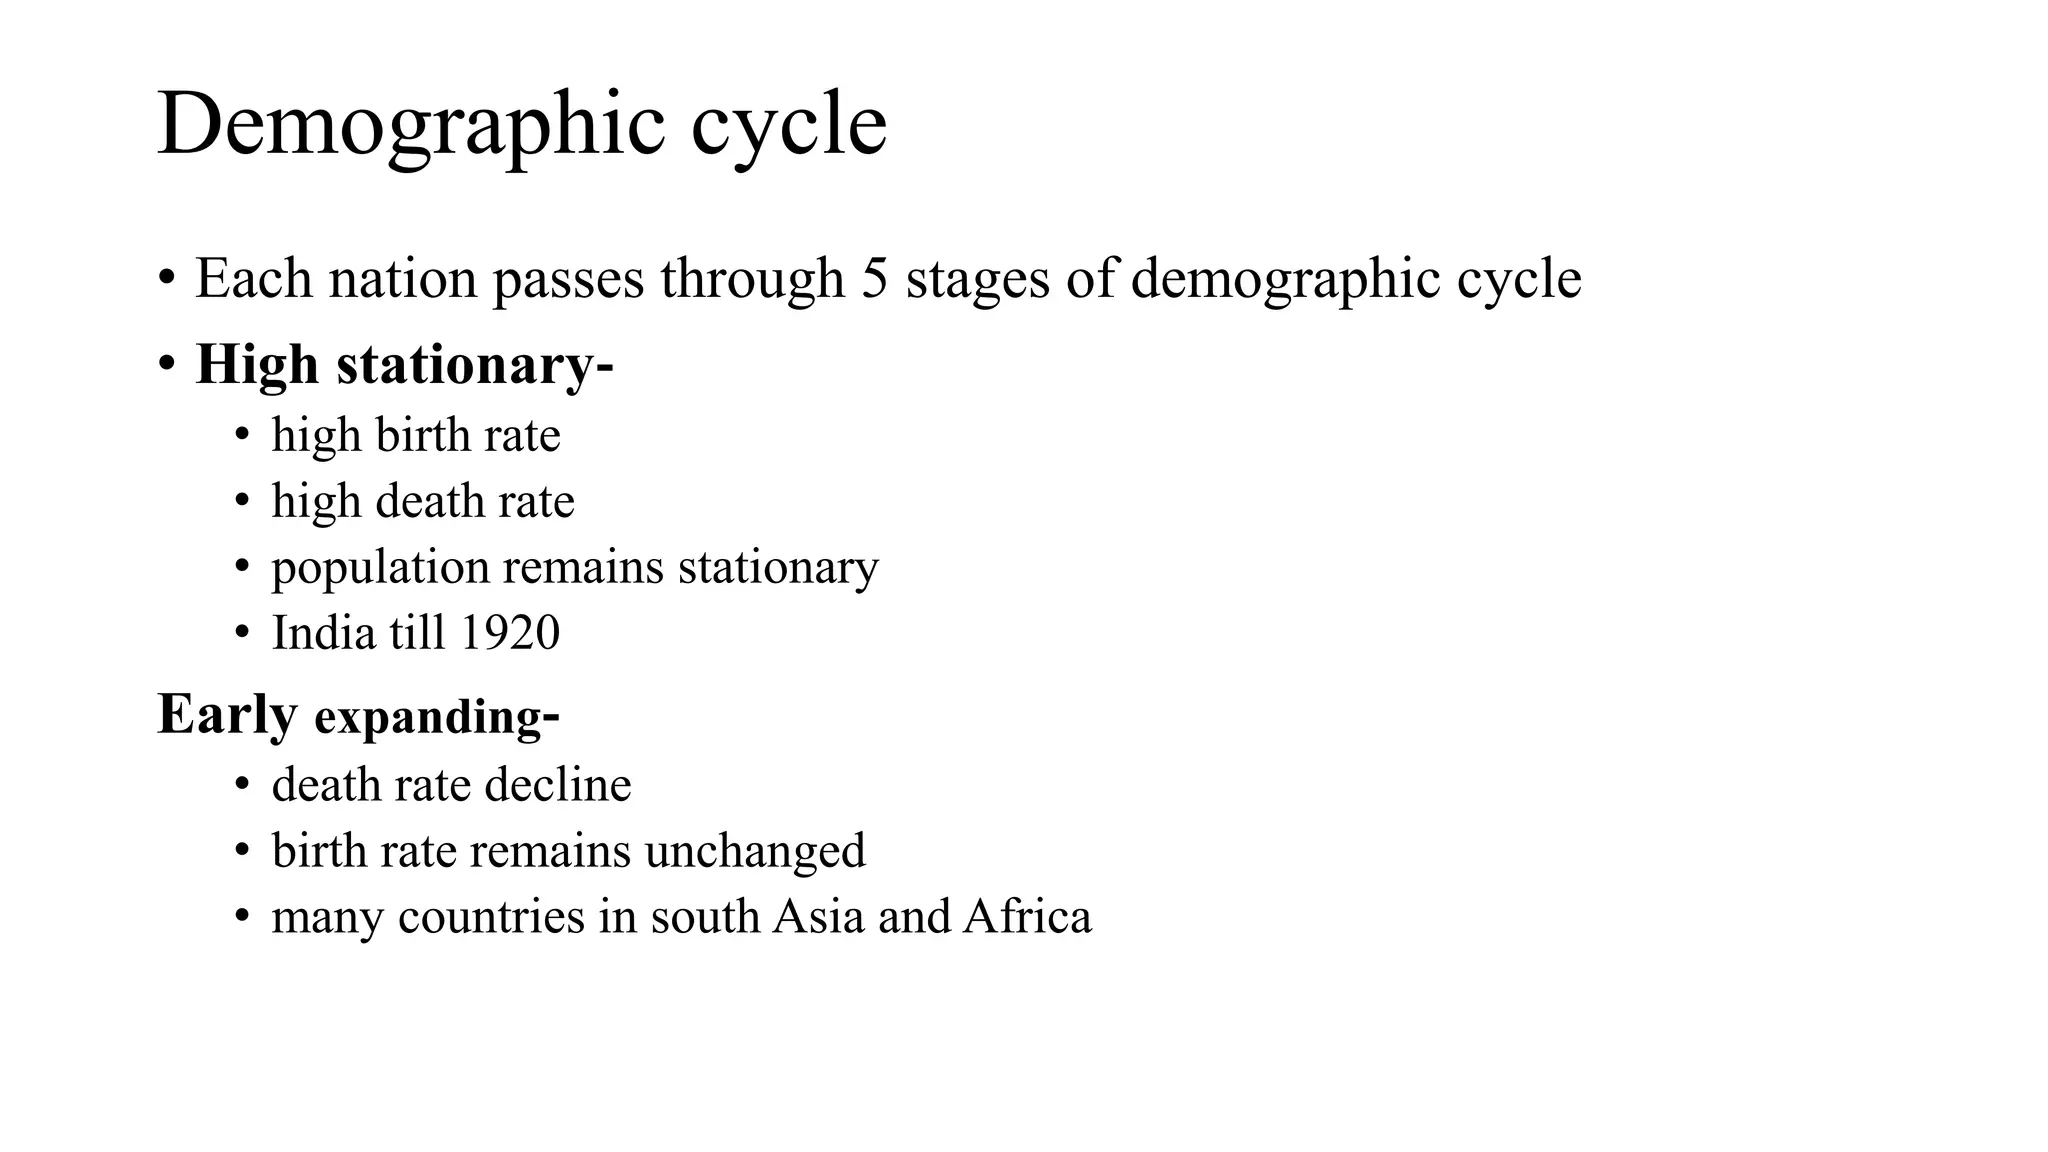
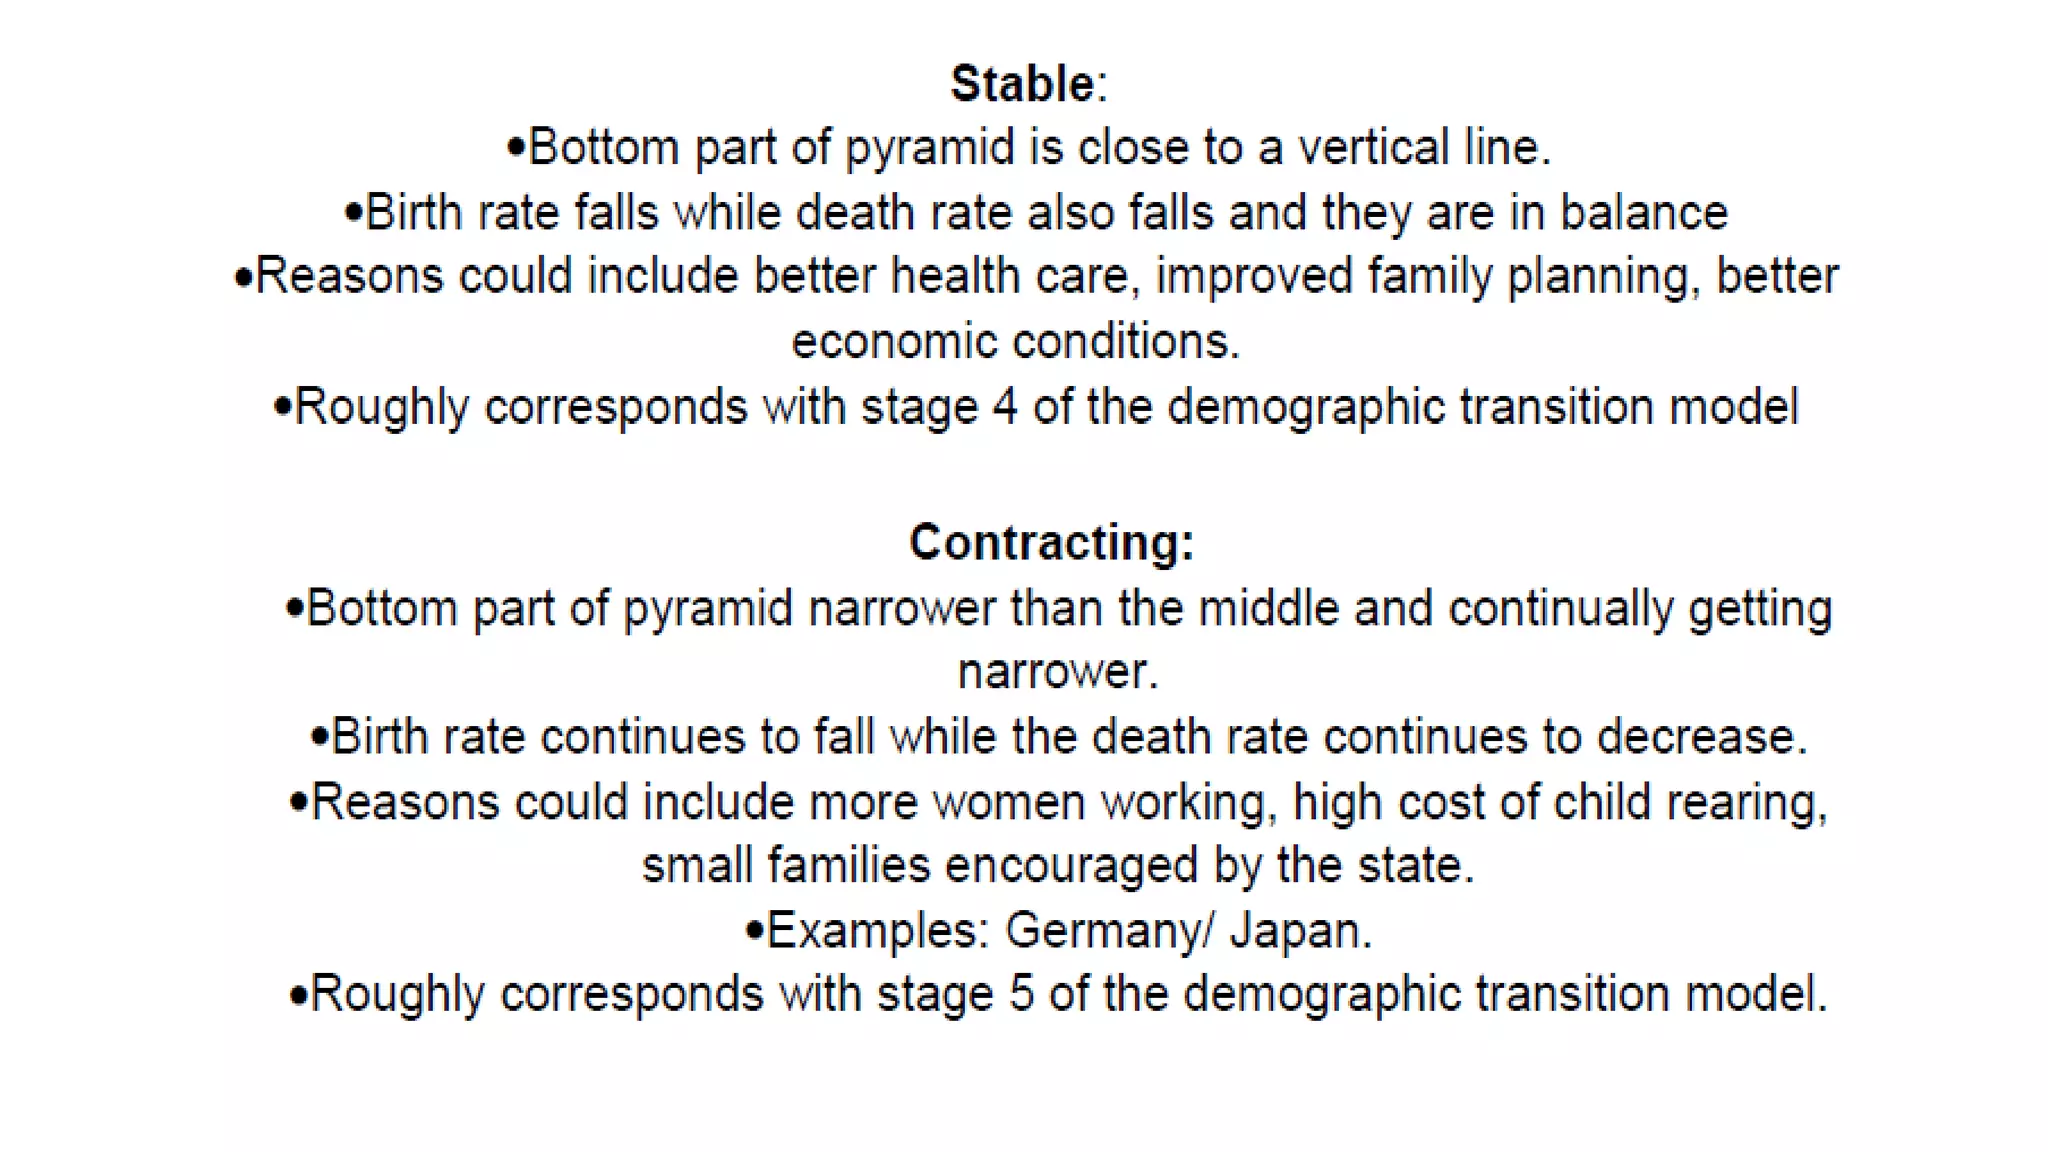
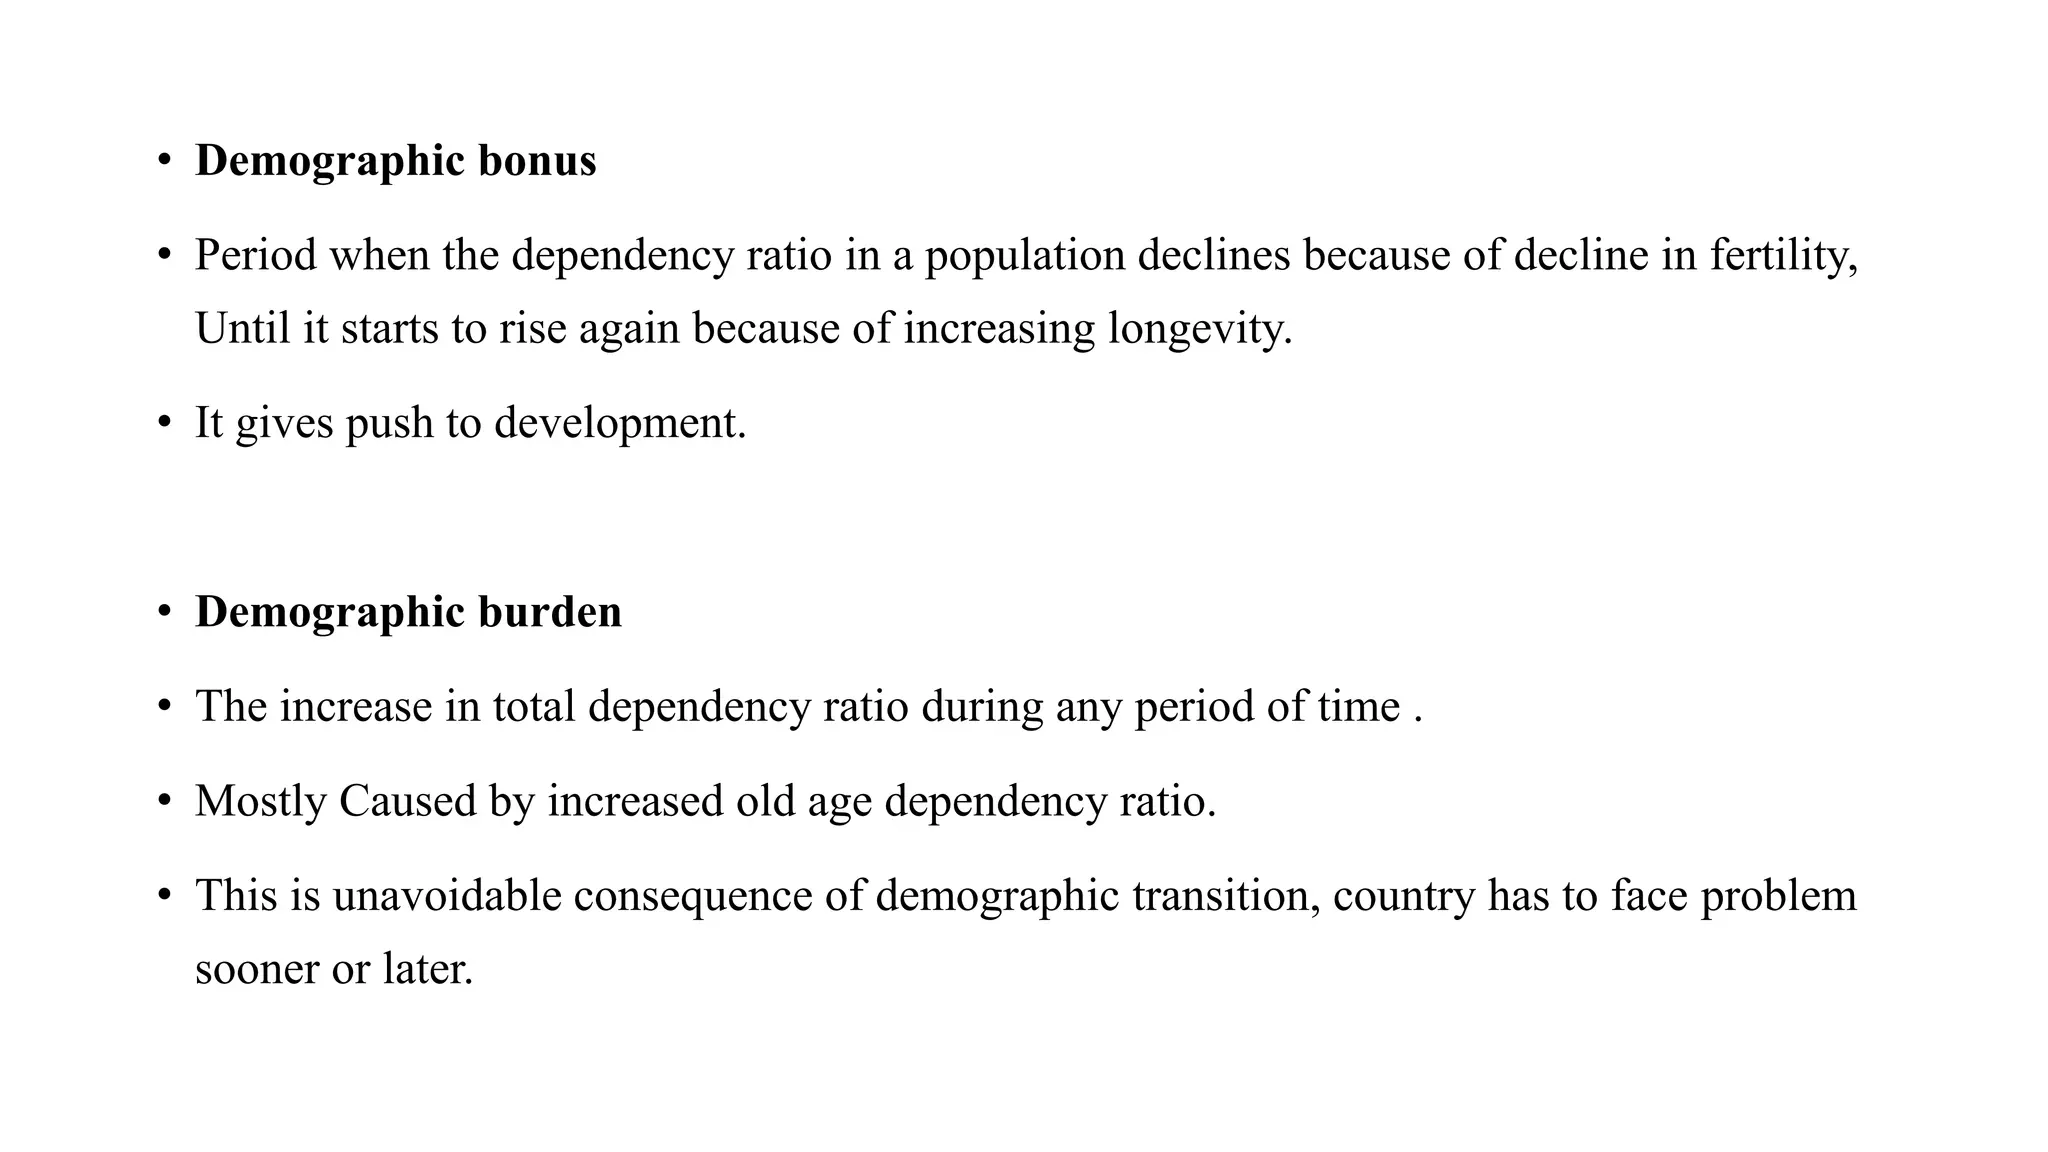
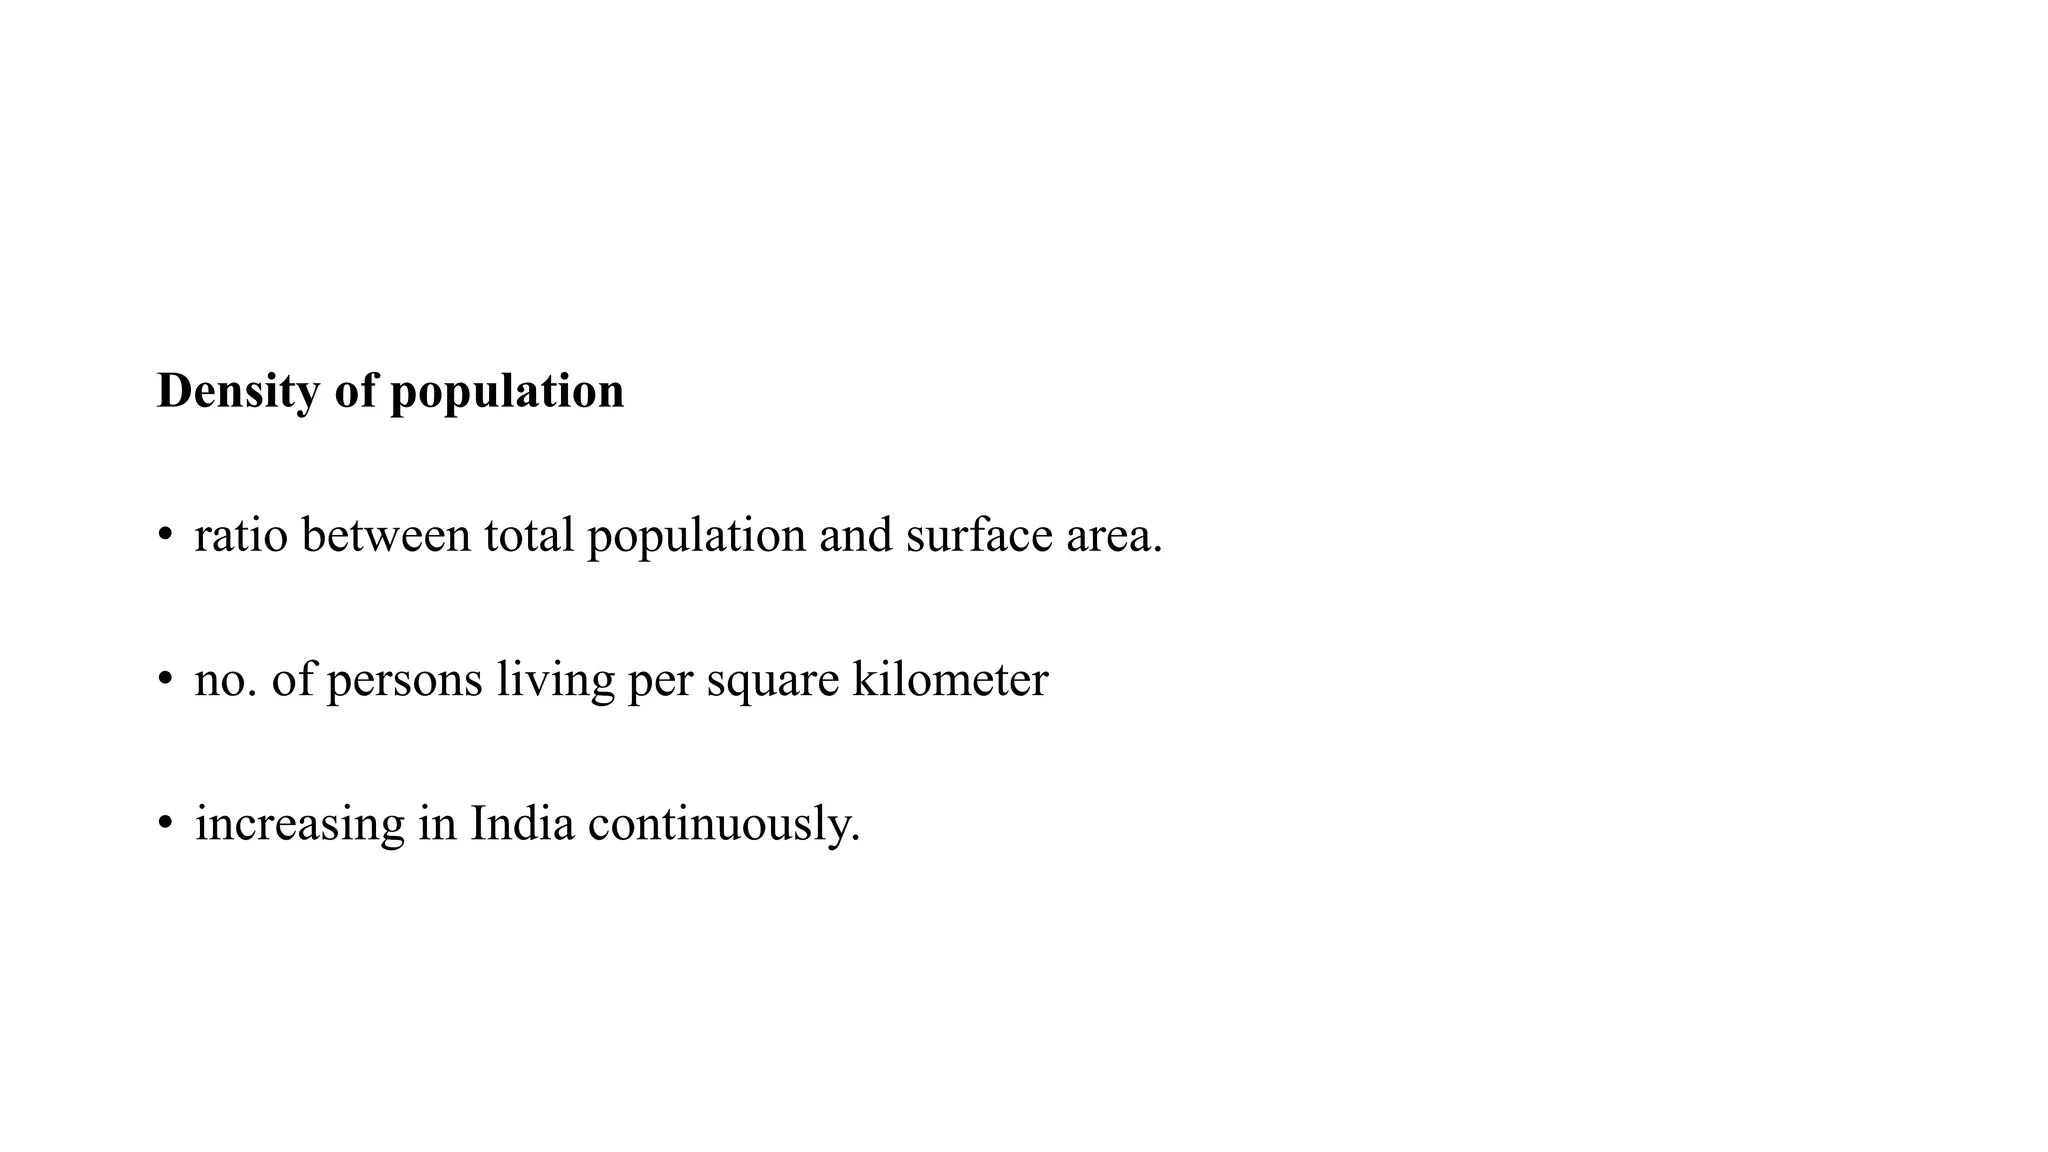
Demography
• Demography – study of human population in relation to the
changes brought about by the interplay of births, deaths, and
migration
Components
• Size – growth or decline
• Composition – sex and age group
• Distribution – territory
Demographic processes
• Fertility
• Mortality
• Marriage
• Migration
• Social mobility
• Source of demographic data
1. Population census
2. National sample surveys
3. Registration of vital events
• Importance of demography & demographic data
1. Demographic data provide a basis for predicting future trends & making decisions.
2. It is also important for formulation, implementation & evaluation of plan ,policies
& programs.
3. It guide to policy makers to make policies that can fulfill the needs of various sector
of society such as young ,adult, & aged, unemployed, poor & various cultural
group.
Demographic cycle
• Each nation passes through 5 stages of demographic cycle
• High stationary‐
• high birth rate
• high death rate
• population remains stationary
• India till 1920
Early expanding‐
• death rate decline
• birth rate remains unchanged
• many countries in south Asia and Africa
• 3. Late expanding‐
• death rate declines further
• birth rate tends to fall
• births exceed deaths
• population continues to grow
• India has entered in this phase
• 4. Low stationary‐
• low birth rate
• low death rate
• population stationary
• industrialized countries
• e.g. Austria, Sweden, Denmark, Belgium
• 5. Decline‐
• population declines
• birth rate is lower than death rate
• e.g. some East European countries like Germany
• Declining birth rates –
• Changes in government attitude towards growth
• spread of education
• increased availability of contraception
• family planning programs
• change in marriage patterns
• Declining death rate‐
• improvement in maternal and child health services
• successful immunization
• diarrhoeal and respiratory disease control programs
• reduction in infant and child mortality
Growth rate
Crude death rate is subtracted from crude birth rate, the net residual is the current
annual growth rate, exclusive of migration
•Growth rates are subject to momentum
•Affected by age distribution, marriage customs, numerous cultural and economic
factors
•Not uniform in the world
•Approximately 95% of growth is occurring in developing countries
• Components of population change
• FERTILITY (BIRTHS) :
• Birth rate :“number of live birth per 1000 estimated mid year population in a given year”
• birth rate is the simplest indicator of fertility.
• MORTALITY ( DEATH ) :
• Death rate : “ number of death per 1000 of total mid year population in a particular place at a
specified time”
• MIGRATION
• Migration is movement of people from one place to another ( within country or specified
territory ) for the purpose of taking up permanent or semi permanent residence, usually across
a political boundary.
Demographic indicators
• Age and sex composition
• Age pyramid
• Sex ratio
• Dependency ratio
• Population density
• Urbanization
• Family size
• Literacy and education
• Life expectancy
• AGE &SEX COMPOSITION
• 0–14 years: (30.8% ); male: 188,208,196, female:171,356,024 (Male > female)
• 15–64 years: (64.3%); male: 386,432,921, female:364,215,759
• 65+ years: (4.9%); male: 27,258,259, female: 30,031,289 (female >male)
• Median age 25.1 years
• Proportion of population below 14 showing decline whereas population of elderly
increasing
Population pyramids
• Specific type of graph showing the age and sex wise distribution of
population of the country.
• A population pyramid tells us what portion of a population are within
a given age cohort.
• Population pyramids can also tell us what stage of development a
country is at
Sex ratio
• Number of females per 1000 males
Sex ratio in India (census 2011)…. 940
rural……………………947
urban………………….926
highest sex ratio Kerala (1084) lowest Haryana ( 877)
Natural sex ratio at birth =950 (estimated)
• Child sex ratio (0-6 year ) : no. of female child per 1000 male child (in 0-6years
age)
CSR in India (2011)…..914
Low sex ratio indicate strong male child preference & its consequence is gender
inequality ,female infanticide / feticide & neglect of child girl.
• Demographic bonus
• Period when the dependency ratio in a population declines because of decline in fertility,
Until it starts to rise again because of increasing longevity.
• It gives push to development.
• Demographic burden
• The increase in total dependency ratio during any period of time .
• Mostly Caused by increased old age dependency ratio.
• This is unavoidable consequence of demographic transition, country has to face problem
sooner or later.
Density of population
• ratio between total population and surface area.
• no. of persons living per square kilometer
• increasing in India continuously.
Urbanization
• urban population : number of persons residing in urban localities.
• “TOWNS”--- Places with municipal corp. , municipal area committee ,
town committee , notified area or cantonment board.
• “all places having 5000 or more inhabitants ,a density of not less than
1000 persons per sq. mile or 390 per sq. km. , pronounced urban
characteristics and at least ¾ of adult male population employed in
pursuits other than agriculture.
Literacy and education
• literate‐ the one above 7 years of age and can read and write with understanding
in any Indian language
• Literacy is generally associated with‐
• modernization
• ‐ urbanization
• ‐ industrialization
• ‐ communication and
• ‐ commerce
• there is major improvement in literacy status in India.
• government of India has made education compulsory up to the age of 14 years in
the country.
Life expectancy
• average no. of years which a person of that age may expect to live, according to
the mortality pattern prevalent in that country.
• one of the best indicators of country’s level of development and of overall health
status of its population.
• continued to increase globally
• most countries exhibit sex differentials in mortality favouring women‐ females
live longer than males
• in India it is almost equal.
• Japan leads in life expectancy.
• Life expectancy at birth in India
• Total population : 65.8 years

Demography

  • 1.
  • 2.
    • Demography –study of human population in relation to the changes brought about by the interplay of births, deaths, and migration
  • 3.
    Components • Size –growth or decline • Composition – sex and age group • Distribution – territory
  • 4.
    Demographic processes • Fertility •Mortality • Marriage • Migration • Social mobility
  • 5.
    • Source ofdemographic data 1. Population census 2. National sample surveys 3. Registration of vital events • Importance of demography & demographic data 1. Demographic data provide a basis for predicting future trends & making decisions. 2. It is also important for formulation, implementation & evaluation of plan ,policies & programs. 3. It guide to policy makers to make policies that can fulfill the needs of various sector of society such as young ,adult, & aged, unemployed, poor & various cultural group.
  • 6.
    Demographic cycle • Eachnation passes through 5 stages of demographic cycle • High stationary‐ • high birth rate • high death rate • population remains stationary • India till 1920 Early expanding‐ • death rate decline • birth rate remains unchanged • many countries in south Asia and Africa
  • 7.
    • 3. Lateexpanding‐ • death rate declines further • birth rate tends to fall • births exceed deaths • population continues to grow • India has entered in this phase
  • 8.
    • 4. Lowstationary‐ • low birth rate • low death rate • population stationary • industrialized countries • e.g. Austria, Sweden, Denmark, Belgium • 5. Decline‐ • population declines • birth rate is lower than death rate • e.g. some East European countries like Germany
  • 9.
    • Declining birthrates – • Changes in government attitude towards growth • spread of education • increased availability of contraception • family planning programs • change in marriage patterns • Declining death rate‐ • improvement in maternal and child health services • successful immunization • diarrhoeal and respiratory disease control programs • reduction in infant and child mortality
  • 10.
    Growth rate Crude deathrate is subtracted from crude birth rate, the net residual is the current annual growth rate, exclusive of migration •Growth rates are subject to momentum •Affected by age distribution, marriage customs, numerous cultural and economic factors •Not uniform in the world •Approximately 95% of growth is occurring in developing countries
  • 12.
    • Components ofpopulation change • FERTILITY (BIRTHS) : • Birth rate :“number of live birth per 1000 estimated mid year population in a given year” • birth rate is the simplest indicator of fertility. • MORTALITY ( DEATH ) : • Death rate : “ number of death per 1000 of total mid year population in a particular place at a specified time” • MIGRATION • Migration is movement of people from one place to another ( within country or specified territory ) for the purpose of taking up permanent or semi permanent residence, usually across a political boundary.
  • 13.
    Demographic indicators • Ageand sex composition • Age pyramid • Sex ratio • Dependency ratio • Population density • Urbanization • Family size • Literacy and education • Life expectancy
  • 14.
    • AGE &SEXCOMPOSITION • 0–14 years: (30.8% ); male: 188,208,196, female:171,356,024 (Male > female) • 15–64 years: (64.3%); male: 386,432,921, female:364,215,759 • 65+ years: (4.9%); male: 27,258,259, female: 30,031,289 (female >male) • Median age 25.1 years • Proportion of population below 14 showing decline whereas population of elderly increasing
  • 15.
    Population pyramids • Specifictype of graph showing the age and sex wise distribution of population of the country. • A population pyramid tells us what portion of a population are within a given age cohort. • Population pyramids can also tell us what stage of development a country is at
  • 18.
    Sex ratio • Numberof females per 1000 males Sex ratio in India (census 2011)…. 940 rural……………………947 urban………………….926 highest sex ratio Kerala (1084) lowest Haryana ( 877) Natural sex ratio at birth =950 (estimated) • Child sex ratio (0-6 year ) : no. of female child per 1000 male child (in 0-6years age) CSR in India (2011)…..914 Low sex ratio indicate strong male child preference & its consequence is gender inequality ,female infanticide / feticide & neglect of child girl.
  • 20.
    • Demographic bonus •Period when the dependency ratio in a population declines because of decline in fertility, Until it starts to rise again because of increasing longevity. • It gives push to development. • Demographic burden • The increase in total dependency ratio during any period of time . • Mostly Caused by increased old age dependency ratio. • This is unavoidable consequence of demographic transition, country has to face problem sooner or later.
  • 21.
    Density of population •ratio between total population and surface area. • no. of persons living per square kilometer • increasing in India continuously.
  • 22.
    Urbanization • urban population: number of persons residing in urban localities. • “TOWNS”--- Places with municipal corp. , municipal area committee , town committee , notified area or cantonment board. • “all places having 5000 or more inhabitants ,a density of not less than 1000 persons per sq. mile or 390 per sq. km. , pronounced urban characteristics and at least ¾ of adult male population employed in pursuits other than agriculture.
  • 24.
    Literacy and education •literate‐ the one above 7 years of age and can read and write with understanding in any Indian language • Literacy is generally associated with‐ • modernization • ‐ urbanization • ‐ industrialization • ‐ communication and • ‐ commerce • there is major improvement in literacy status in India. • government of India has made education compulsory up to the age of 14 years in the country.
  • 25.
    Life expectancy • averageno. of years which a person of that age may expect to live, according to the mortality pattern prevalent in that country. • one of the best indicators of country’s level of development and of overall health status of its population. • continued to increase globally • most countries exhibit sex differentials in mortality favouring women‐ females live longer than males • in India it is almost equal. • Japan leads in life expectancy. • Life expectancy at birth in India • Total population : 65.8 years