Philippine economic environment
•
6 likes•6,524 views

Philippine Economy Quezon City Population Inflation Rate Philippine Population GDP External Environment Economic Environment Population Growth

Recommended
More Related Content
What's hot
What's hot (20)
Viewers also liked
Viewers also liked (20)
Similar to Philippine economic environment
Similar to Philippine economic environment (20)
More from jennifer malabrigo, MBA
Recently uploaded
Recently uploaded (20)
Philippine economic environment
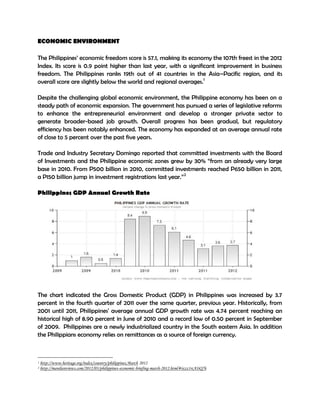
- 1. ECONOMIC ENVIRONMENT The Philippines’ economic freedom score is 57.1, making its economy the 107th freest in the 2012 Index. Its score is 0.9 point higher than last year, with a significant improvement in business freedom. The Philippines ranks 19th out of 41 countries in the Asia–Pacific region, and its overall score are slightly below the world and regional averages.1 Despite the challenging global economic environment, the Philippine economy has been on a steady path of economic expansion. The government has pursued a series of legislative reforms to enhance the entrepreneurial environment and develop a stronger private sector to generate broader-based job growth. Overall progress has been gradual, but regulatory efficiency has been notably enhanced. The economy has expanded at an average annual rate of close to 5 percent over the past five years. Trade and Industry Secretary Domingo reported that committed investments with the Board of Investments and the Philippine economic zones grew by 30% “from an already very large base in 2010. From P500 billion in 2010, committed investments reached P650 billion in 2011, a P150 billion jump in investment registrations last year.”2 Philippines GDP Annual Growth Rate The chart indicated the Gross Domestic Product (GDP) in Philippines was increased by 3.7 percent in the fourth quarter of 2011 over the same quarter, previous year. Historically, from 2001 until 2011, Philippines' average annual GDP growth rate was 4.74 percent reaching an historical high of 8.90 percent in June of 2010 and a record low of 0.50 percent in September of 2009. Philippines are a newly industrialized country in the South eastern Asia. In addition the Philippians economy relies on remittances as a source of foreign currency. 1 http://www.heritage.org/index/country/philippines,March 2012 2 http://manilareviews.com/2012/03/philippines-economic-briefing-march-2012.html#ixzz1rcAIiQ7h
- 2. GDP growth decomposition reveals that the dismal performance of goods exports pulled down the full year 2011 GDP growth rate by 2.2 percentage points. Public construction and government consumption also had an impact. Agriculture, industry and services sectors contributed to the full year growth. Government spending has increased significantly, with the public construction sector growing by almost 50 percent in the fourth quarter of 2011 over the same period in 2010, while government consumption expenditure and public administration and defense figures have been showing substantial increases since the second or the third quarter.3 Inflation rates of the Philippines YEAR Inflation rate 2009 3.2 2010 3.8 2011 4.2 The table above shows the average inflation rates for the years 2009-2011, last February 2012 inflation rate is 2.7 percent. Inflation rate refers to a general rise in prices measured against a standard level of purchasing power and it is a measure of inflation, or the rate of increase of a price index such as the consumer price index. It is the percentage rate of change in price level over time, usually one year. Inflation or the increase in the consumer prices could due to food and fuel prices; there is definitely a trend of increasing price. The rate of decrease in the purchasing power of money is approximately equal. Population growth and spatial trends.4 The Philippines had an annual growth rate of 2.04%; population growth in the Philippines is one of the highest in Asia. Despite long-standing high female education rates, population growth rates have remained relatively high in the Philippines due to cultural and political factors. As of 2010, 63% of the populations were living in urban areas; this is expected to increase to 70% by 2015. The increasingly urban character of destitution increases the burden on the health care system as problems of population pressure and environmental degradation, combined with the urban lifestyle, put the urban poor under higher risk. 3 http://www.neda.gov.ph/econreports_dbs/NIA/DG_Statements/DG%20Press%20Statement_nia2011fy.pdf 4 (http://www.sws.org.ph/pr20100721.htm).WHO Country Cooperation Strategy for the Philippines 2011-2016. http://www.quezoncity.gov.ph/index.php?option=com_content&view=article&id=234&Itemid=351
- 3. Ageing Population Based on the DOH5 , the population of 60 years or older was 3.7 million in 1995 or 5.4% of total population in the Philippines. In the CY 2000 census, this has increased to about 4.8 million or almost 6% (NSCB). At present there are 7M senior citizens (6.9% of the total population), 1.3M of which are indigents. The trend is expected to increase in the share of senior citizens to the total Philippine population of 7.8 percent, 9.6 percent, and 11.7 percent in 2015, 2020, and 2025, respectively (UN, 2008). With the rise of the aging population is the increase in the demand for health services by the elderly. A study done by Racelis et al (2003) on the share of health expenditure of Filipino elderly on the National Health Account, the elderly are “relatively heavy consumers of personal health care (22%) and relatively light consumers of public health care (5%).” From out-of-pocket costs, the aged are heavy users of care provided by medical centers, hospitals, non-hospital health facilities and traditional care facilities. Determinants of Health Many factors combine together to affect the health of individuals and communities. Whether people are healthy or not, is determined by their circumstances and environment. To a large extent, factors such as where we live, the state of our environment, genetics, our income and education level, and our relationships with friends and family all have considerable impacts on health, whereas the more commonly considered factors such as access and use of health care services often have less of an impact. The determinant of health includes: the social and economic environment, the physical environment, and the person’s individual characteristics and behaviors. These determinants—or things that make people healthy or not—include the above factors, and many others: Income and social status - higher income and social status are linked to better health. The greater the gap between the richest and poorest people, the greater the differences in health. Education – low education levels are linked with poor health, more stress and lower self-confidence. Physical environment – safe water and clean air, healthy workplaces, safe houses, communities and roads all contribute to good health. Employment and working conditions – people in employment are healthier, particularly those who have more control over their working conditions Social support networks – greater support from families, friends and communities is linked to better health. Culture - customs and traditions, and the beliefs of the family and community all affect health. 5 Health and well-being of older person - http://www.doh.gov.ph/content/health-and-well-being-older-persons
- 4. Genetics - inheritance plays a part in determining lifespan, healthiness and the likelihood of developing certain illnesses. Personal behavior and coping skills – balanced eating, keeping active, smoking, drinking, and how we deal with life’s stresses and challenges all affect health. Health services - access and use of services that prevent and treat disease influences health Gender - Men and women suffer from different types of diseases at different ages. Health Risks Survey data shows that most households go directly to hospitals for treatment of illnesses. With the breakdown of referral networks due to devolution, tertiary level hospitals which are designed to cater to more serious diseases are also accommodating cases that can be handled by lower level facilities. This leads to tertiary hospitals requiring more financial resources to be able to attend to all its patients6 . From January 1 to August 18, 2012, leptospirosis cases reached a total of 2,471 with 129 deaths, the report said. In the same period last year, the DOH recorded only 1,522 cases. According to the surveillance report, most of the leptospirosis cases came from Northern Mindanao, Western Visayas and NCR. In NCR, the cities of Manila, Quezon City and Caloocan City registered the highest number of leptospirosis cases with 73, 43 and 24 cases respectively (Manila Bulletin Articles, September 1, 2012)7 . Dr. Tony Dans from UP-PGH said that 60% of case in lung cancer is caused by the air pollution. Secretary Ona said that 80% of air pollution is coming from motor vehicles. Mr. Mike Aragon also mentioned in the February 2012 Clean Air Summit that 60 – 80% of air pollution are caused by 200 million motor vehicles in Metro Manila8 . Cancer is now the third leading cause of death in the Philippines, claiming one death for every two new cases within a year. Cancer is estimated to afflict 189 per 100,000 Filipinos. Statistics show that cancer kills four Filipinos every hour or 103 every day. The incidence and mortality rates of cancer in the Philippines has been increasing in the past three decades, and this trend is expected to continue if organized and sustained specialized care and preventive measures against cancer are not initiated (Manila Bulletin Articles9 , April 24, 2012). Weather can also be an important and contributing factor in the outbreak and spread of diseases. Changes in temperature can increase the incidence of colds and flu. Exposure to intense sunlight and high temperatures during the dry season can cause heat stroke and skin illnesses, while the onset of rains can result in the outbreak of dengue fever, typhoid fever, and water-borne and other communicable diseases. 6 PIDS -How Are Government Hospitals Performing? A Study of Resource Management in DOH-retained Hospitals. Discussion paper Series no. 2010-02 7 Leptospirosis cases increase by 62.35% - http://www.mb.com.ph/articles/371872/leptospirosis-cases-increase-by-6235 8 Air Pollution, unang sanhi ng lung cancer - http://www.doh.gov.ph/sites/default/files/091112-0002.pdf 9 State should lead cancer fight - http://mb.com.ph/articles/357920/state-should-lead-cancer-fight
- 5. Quezon City Population Largest city in metro Manila with a land area of 16,112.8 hectares (proclaimed by PD no. 940) and biggest population (24% of the regional population) More than half of Quezon City’s population found in district 2 One of the largest sources of manpower in the Philippines (2012 estimated), total populations is 2,915,772 with an annual growth rate of 2.92%. Distribution among the genders is 51:49, with 1.5M females to 1.4M males. It is a city dominated by the youth, with more than 40% (1.17 million) of the population less than 20 years of age. The senior population (60 years and older) is about 5% of the total. Women in their reproductive years (15 to 49 years) are 891,983, which may contribute to the city’s average annual population growth rate of 2.92% (higher than Metro Manila’s 2.11% and the Philippines’ 2.04%). Literacy Rate is 98.32% which is higher than the Philippines average rate (93.4%). Quezon City is considered to have the largest school-age population (NSCB, 2010), 1.88M or 4.3% of the Philippines total enrolled population. It is the 2nd most competitive City in the Philippines in the local survey conducted by Asian Institute of Management in Businessman (2007). Largest Service economy: 58,133 registered businesses engaged in wholesale and retail; 3rd largest shopping center in the world, in terms of leasable space (More than 28 shopping complexes). The city’s employable population (aged 20 to 64) is about 1.672 million, the biggest that can be found in any Philippine city. It represents 33.8% of Metro Manila’s aggregate labor force and 4.3% of the country’s total labor force. Economic Environment Assumptions Based on the past year date, Philippine economic environment assumptions10 are: High and sustained economic growth; continuous investment and development of our infrastructure; Annual average real GDP growth (NEDA) will increase by 7% and inflation rate by 4% for the period of 2011-2016; Goods and fuel price will continue to go up. Healthcare expenditures annual growth rate is 6.7% (constant prices, 2000-2011); 8.9% (2010-2011). (NSCB) Year 2011 2012 2013 2014 GDP Rate 4.2 4.5 4.8 5.2 Inflation Rate 3.7 3.8 4 4.2 Economic 10 http://www.neda.gov.ph/PDP/rm/pdprm2011-2016.pdf, page 30, http://www.nscb.gov.ph/sna/2012/1st2012/2012npil.asp- Annual average real GDP growth increase by 7% (2011-2016) 63
- 6. The effect of foreign currency - Most of Hospital Equipment and parts is imported and many of the modern medicine are imported. You have to pay extra for imported medicine and the rising cost of equipment was affecting the hospitals. Economic Programs - Promoting of tourism in the Philippines include the medical tourism, cheaper to hospitalize in the Philippines. Factor would increase patient. Social/Cultural A growing consciousness of decease prevention - wellness and fitness program. The growing acceptance of the HMO concept, aid is in greater usage of hospital services. Ageing Population changing their lifestyle, more demand for healthcare Technological Technological Development of Medical Equipment to diagnose medical problems that previously could not be diagnosed. It will increase usage of diagnostic services but may decrease in-patient confinement. It will decrease usage of hospital services. The upgrade of Government hospital units – patients will choose government hospitals instead of private hospitals. Political/Legal Laws that prohibit denial of admission of patient to private hospitals because of inability to pay. It will increase account receivables in hospitals. Regulations – membership in Philhealth (Medicine Program) The “One-Stop Shop System” – to improve access of the poor to good quality and affordable healthcare. Licensure of Health Facilities – To reduce transaction cost and cost of provision of regulatory services to increase customer trust and satisfaction.