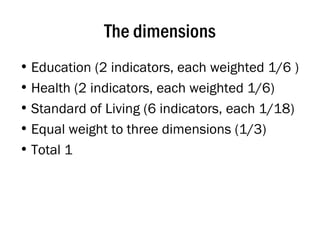
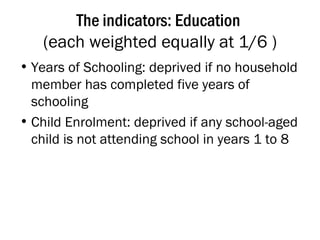
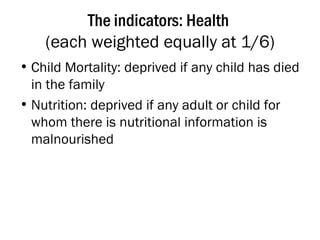
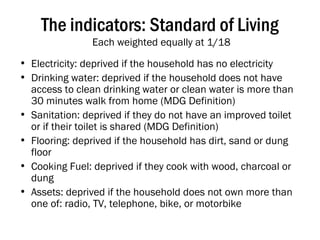
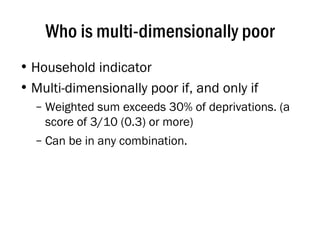
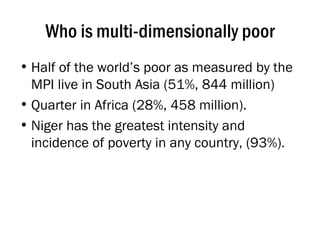
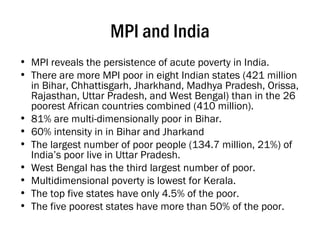
Multidimensional Poverty Index (Compiled and adapted from  http:// www.ophi.org.uk /policy/multidimensional-poverty-index/ )
The dimensions Education (2 indicators, each weighted 1/6 ) Health (2 indicators, each weighted 1/6) Standard of Living (6 indicators, each 1/18) Equal weight to three dimensions (1/3)  Total 1
The indicators: Education  (each weighted equally at 1/6 ) Years of Schooling: deprived if no household member has completed five years of schooling Child Enrolment: deprived if any school-aged child is not attending school in years 1 to 8
The indicators: Health  (each weighted equally at 1/6) Child Mortality: deprived if any child has died in the family Nutrition: deprived if any adult or child for whom there is nutritional information is malnourished
The indicators: Standard of Living  Each weighted equally at 1/18 Electricity: deprived if the household has no electricity Drinking water: deprived if the household does not have access to clean drinking water or clean water is more than 30 minutes walk from home (MDG Definition) Sanitation: deprived if they do not have an improved toilet or if their toilet is shared (MDG Definition) Flooring: deprived if the household has dirt, sand or dung floor Cooking Fuel: deprived if they cook with wood, charcoal or dung Assets: deprived if the household does not own more than one of: radio, TV, telephone, bike, or motorbike
Who is multi-dimensionally poor Household indicator Multi-dimensionally poor if, and only if Weighted sum exceeds 30% of deprivations. (a score of 3/10 (0.3) or more) Can be in any combination.
Who is multi-dimensionally poor Half of the world’s poor as measured by the MPI live in South Asia (51%, 844 million) Quarter in Africa (28%, 458 million).  Niger has the greatest intensity and incidence of poverty in any country, (93%).
The advantage Simple yes/no—can be self administered Reflects both the incidence of poverty and the average intensity of their deprivation.  Reveals the combination of deprivations suffered. Makes focussed intervention possible (policy and programmes).
MPI and India MPI reveals the persistence of acute poverty in India.  There are more MPI poor in eight Indian states (421 million in Bihar, Chhattisgarh, Jharkhand, Madhya Pradesh, Orissa, Rajasthan, Uttar Pradesh, and West Bengal) than in the 26 poorest African countries combined (410 million).  81% are multi-dimensionally poor in Bihar.  60% intensity in in Bihar and Jharkand The largest number of poor people (134.7 million, 21%) of India’s poor live in Uttar Pradesh.  West Bengal has the third largest number of poor.  Multidimensional poverty is lowest for Kerala.  The top five states have only 4.5% of the poor.  The five poorest states have more than 50% of the poor.
MPI and India 645.0 - 53.5% 55.4% 0.296 1,164.70 India    77.3 13.5% 61.3% 81.4% 0.499 95 Bihar  21 23.5 4.2% 60.2% 77.0% 0.463 30.5 Jharkhand 20 48.6 8.5% 56.0% 69.5% 0.389 70 Madhya Pradesh 19 17.2 2.9% 53.9% 71.9% 0.387 23.9 Chhattisgarh 18 134.7 21.3% 55.2% 69.9% 0.386 192.6 Uttar Pradesh 17 41.9 7.0% 54.7% 64.2% 0.351 65.4 Rajasthan 16 26.0 4.3% 54.0% 64.0% 0.345 40.7 Orissa 15 52.2 8.5% 54.3% 58.3% 0.317 89.5 West Bengal  14 25.5 4.0% 52.5% 57.6% 0.303 44.2 Eastern Indian States 13 27.0 4.2% 48.3% 46.1% 0.223 58.6 Karnataka 12 37.5 5.1% 47.1% 44.7% 0.211 83.9 Andhra Pradesh 11 5.4 0.7% 47.7% 43.8% 0.209 12.2 Jammu and Kashmir  10 23.8 3.4% 49.2% 41.5% 0.205 57.3 Gujarat  9 10.0 1.3% 47.9% 41.6% 0.199 24.1 Haryana 8 43.6 6.0% 48.1% 40.1% 0.193 108.7 Maharashtra  7 3.9 0.5% 46.9% 40.3% 0.189 9.6 Uttaranchal 6 22.0 2.6% 43.6% 32.4% 0.141 68 Tamil Nadu 5 2.1 0.3% 42.3% 31.0% 0.131 6.7 Himachal Pradesh 4 7.1 1.0% 46.0% 26.2% 0.120 27.1 Punjab  3 0.4 0.0% 43.4% 21.7% 0.094 1.6 Goa  2 5.6 0.6% 40.9% 15.9% 0.065 35 Kerala 1 Number of MPI poor (million) Contribution to overall poverty Average intensity Proportion of poor MPI Population (million) 2007 States MPI Rank Multidimensional Poverty across Indian States
MPI and India 47.20% 33.30% 0.157 General 52.30% 58.30% 0.305 Other Backward Class 59.20% 81.40% 0.482 Scheduled Tribe 54.80% 65.80% 0.361 Scheduled Caste Average Intensity Percentage of MPI Poor MPI States Breakdown of Multidimensional Poverty across Hindu Castes and Tribes
MPI and India MPI and other measures 55% MPI 42% World Bank $1.25. At PPP Rs 21.6 a day urban and Rs 14.3 rural. 50% N C Saxena 41% Arjun Sengupta 41% below Rs 14.6 per day. Extremely Poor (6.4%, Rs 8.9), Poor (15.4%, Rs 11.6) Marginally Poor (19.0%, Rs 14.6). Vulnerable (36%, Rs 20) Total 77%, 836 million people, below Rs 20 per day.  http://nceus.gov.in/Condition_of_workers_sep_2007.pdf 37% Suresh Tendulkar Overall 37.2%, with 41.8% rural (below Rs 13.8 per day, Rs 446.68 per month) and 25.7% urban (Rs 578.80 per month). Expert Group on Methodology for Estimation of Poverty, Chair Prof. Suresh D. Tendulkar;  http:// www.planningcommission.gov.in/eg_poverty.htm 27.5% Planning Commission

Multidimensional Poverty Index

  • 1.
    Multidimensional Poverty Index(Compiled and adapted from http:// www.ophi.org.uk /policy/multidimensional-poverty-index/ )
  • 2.
    The dimensions Education(2 indicators, each weighted 1/6 ) Health (2 indicators, each weighted 1/6) Standard of Living (6 indicators, each 1/18) Equal weight to three dimensions (1/3) Total 1
  • 3.
    The indicators: Education (each weighted equally at 1/6 ) Years of Schooling: deprived if no household member has completed five years of schooling Child Enrolment: deprived if any school-aged child is not attending school in years 1 to 8
  • 4.
    The indicators: Health (each weighted equally at 1/6) Child Mortality: deprived if any child has died in the family Nutrition: deprived if any adult or child for whom there is nutritional information is malnourished
  • 5.
    The indicators: Standardof Living Each weighted equally at 1/18 Electricity: deprived if the household has no electricity Drinking water: deprived if the household does not have access to clean drinking water or clean water is more than 30 minutes walk from home (MDG Definition) Sanitation: deprived if they do not have an improved toilet or if their toilet is shared (MDG Definition) Flooring: deprived if the household has dirt, sand or dung floor Cooking Fuel: deprived if they cook with wood, charcoal or dung Assets: deprived if the household does not own more than one of: radio, TV, telephone, bike, or motorbike
  • 6.
    Who is multi-dimensionallypoor Household indicator Multi-dimensionally poor if, and only if Weighted sum exceeds 30% of deprivations. (a score of 3/10 (0.3) or more) Can be in any combination.
  • 7.
    Who is multi-dimensionallypoor Half of the world’s poor as measured by the MPI live in South Asia (51%, 844 million) Quarter in Africa (28%, 458 million). Niger has the greatest intensity and incidence of poverty in any country, (93%).
  • 8.
    The advantage Simpleyes/no—can be self administered Reflects both the incidence of poverty and the average intensity of their deprivation. Reveals the combination of deprivations suffered. Makes focussed intervention possible (policy and programmes).
  • 9.
    MPI and IndiaMPI reveals the persistence of acute poverty in India. There are more MPI poor in eight Indian states (421 million in Bihar, Chhattisgarh, Jharkhand, Madhya Pradesh, Orissa, Rajasthan, Uttar Pradesh, and West Bengal) than in the 26 poorest African countries combined (410 million). 81% are multi-dimensionally poor in Bihar. 60% intensity in in Bihar and Jharkand The largest number of poor people (134.7 million, 21%) of India’s poor live in Uttar Pradesh. West Bengal has the third largest number of poor. Multidimensional poverty is lowest for Kerala. The top five states have only 4.5% of the poor. The five poorest states have more than 50% of the poor.
  • 10.
    MPI and India645.0 - 53.5% 55.4% 0.296 1,164.70 India   77.3 13.5% 61.3% 81.4% 0.499 95 Bihar 21 23.5 4.2% 60.2% 77.0% 0.463 30.5 Jharkhand 20 48.6 8.5% 56.0% 69.5% 0.389 70 Madhya Pradesh 19 17.2 2.9% 53.9% 71.9% 0.387 23.9 Chhattisgarh 18 134.7 21.3% 55.2% 69.9% 0.386 192.6 Uttar Pradesh 17 41.9 7.0% 54.7% 64.2% 0.351 65.4 Rajasthan 16 26.0 4.3% 54.0% 64.0% 0.345 40.7 Orissa 15 52.2 8.5% 54.3% 58.3% 0.317 89.5 West Bengal 14 25.5 4.0% 52.5% 57.6% 0.303 44.2 Eastern Indian States 13 27.0 4.2% 48.3% 46.1% 0.223 58.6 Karnataka 12 37.5 5.1% 47.1% 44.7% 0.211 83.9 Andhra Pradesh 11 5.4 0.7% 47.7% 43.8% 0.209 12.2 Jammu and Kashmir 10 23.8 3.4% 49.2% 41.5% 0.205 57.3 Gujarat 9 10.0 1.3% 47.9% 41.6% 0.199 24.1 Haryana 8 43.6 6.0% 48.1% 40.1% 0.193 108.7 Maharashtra 7 3.9 0.5% 46.9% 40.3% 0.189 9.6 Uttaranchal 6 22.0 2.6% 43.6% 32.4% 0.141 68 Tamil Nadu 5 2.1 0.3% 42.3% 31.0% 0.131 6.7 Himachal Pradesh 4 7.1 1.0% 46.0% 26.2% 0.120 27.1 Punjab 3 0.4 0.0% 43.4% 21.7% 0.094 1.6 Goa 2 5.6 0.6% 40.9% 15.9% 0.065 35 Kerala 1 Number of MPI poor (million) Contribution to overall poverty Average intensity Proportion of poor MPI Population (million) 2007 States MPI Rank Multidimensional Poverty across Indian States
  • 11.
    MPI and India47.20% 33.30% 0.157 General 52.30% 58.30% 0.305 Other Backward Class 59.20% 81.40% 0.482 Scheduled Tribe 54.80% 65.80% 0.361 Scheduled Caste Average Intensity Percentage of MPI Poor MPI States Breakdown of Multidimensional Poverty across Hindu Castes and Tribes
  • 12.
    MPI and IndiaMPI and other measures 55% MPI 42% World Bank $1.25. At PPP Rs 21.6 a day urban and Rs 14.3 rural. 50% N C Saxena 41% Arjun Sengupta 41% below Rs 14.6 per day. Extremely Poor (6.4%, Rs 8.9), Poor (15.4%, Rs 11.6) Marginally Poor (19.0%, Rs 14.6). Vulnerable (36%, Rs 20) Total 77%, 836 million people, below Rs 20 per day. http://nceus.gov.in/Condition_of_workers_sep_2007.pdf 37% Suresh Tendulkar Overall 37.2%, with 41.8% rural (below Rs 13.8 per day, Rs 446.68 per month) and 25.7% urban (Rs 578.80 per month). Expert Group on Methodology for Estimation of Poverty, Chair Prof. Suresh D. Tendulkar; http:// www.planningcommission.gov.in/eg_poverty.htm 27.5% Planning Commission