Downloaded 20 times


![Apendix
Matlab code for unite step function
clear all
clc
t=-20:0.001:20;
y=heaviside(t+4)+heaviside(t+3)+heaviside(t+
2)+heaviside(t+1)+heaviside(t)+heaviside(t-
1)+heaviside(t-2)+heaviside(t-3)
+heaviside(t-4)+heaviside(t-5);
plot(t,y);
axis([-10 10 -10 10])
Slide 22](https://image.slidesharecdn.com/signalandsystem-171218174049/85/PLOTTING-UNITE-STEP-AND-RAMP-FUNCTION-IN-MATLAB-22-320.jpg)
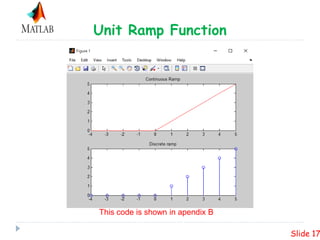
![Apendix
Matlab code for unite Ramp function
close all;
clear all;
clc
n1=input('Enter lower limit');
n2=input('Enter upper limit');
n=n1:n2;
x=n.*[n>=0];
subplot(2,1,1);
plot(n,x,'r');
title('Continuous');
subplot(2,1,2);
stem(n,x,'b');
title('Discrete');
Slide 23](https://image.slidesharecdn.com/signalandsystem-171218174049/85/PLOTTING-UNITE-STEP-AND-RAMP-FUNCTION-IN-MATLAB-23-320.jpg)

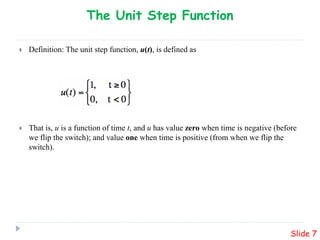
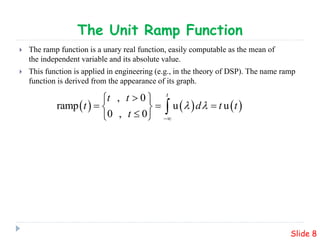
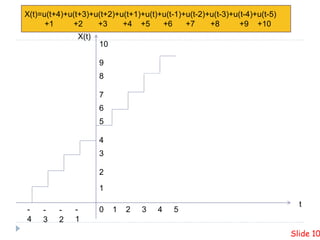
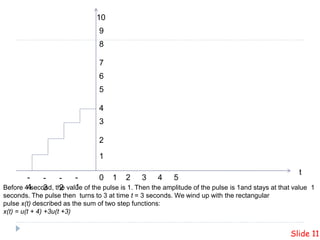
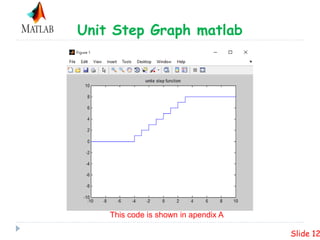
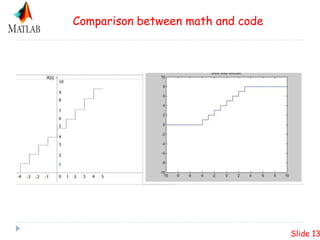
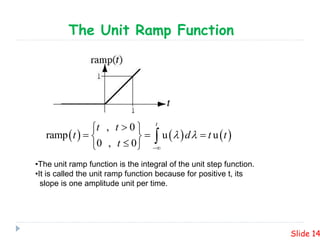
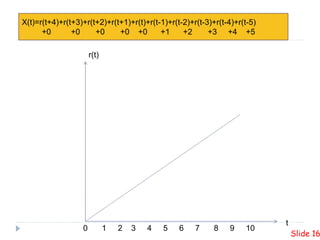
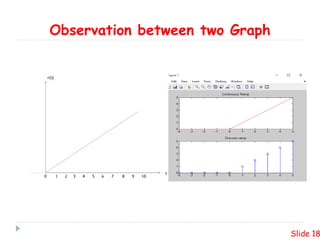
This presentation summarizes plotting unite step and ramp functions in MATLAB. It defines the unit step and ramp functions mathematically and graphically. It shows how to represent the combination of 10 step functions and the corresponding ramp function in MATLAB. Code examples are provided to plot the unit step and ramp functions in MATLAB.