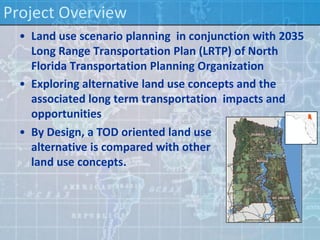
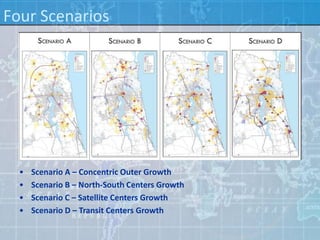
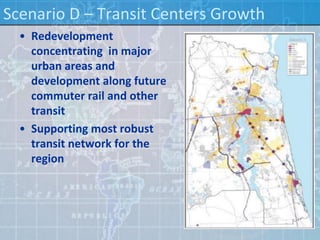
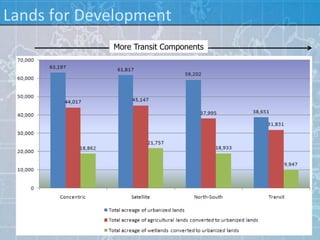
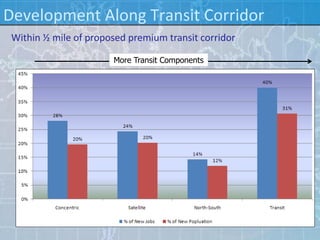
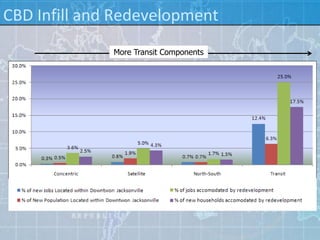
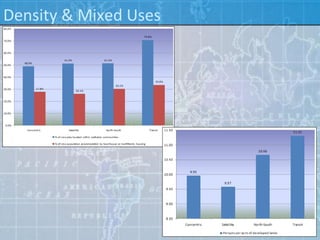
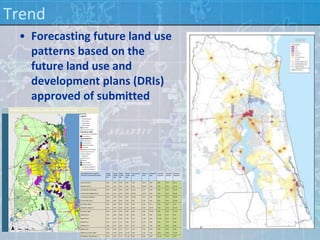
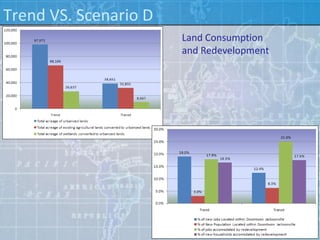
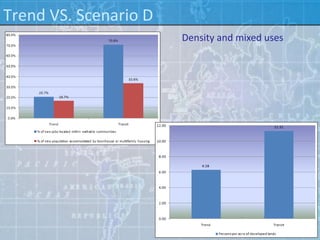
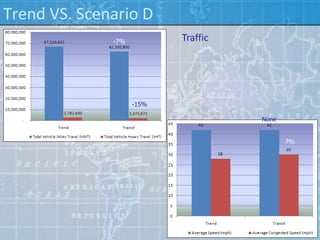
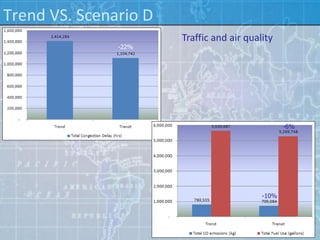
The Impacts of TOD:
From Regional Land Use Perspective
Do Kim, Ph.D.
Department of Urban and Regional Planning
California State Polytechnic University - Pomona


Jack R. Widmeyer Transportation Research Conference   1
INTRODUCTION
Introduction
  • This presentation focuses on how Transit Oriented
    Development (TOD) impacts on future regional land
    use and transportation conditions.
  • By comparing with other land use alternatives, this
    presentation provides quantitative evidences on how
    much positive impacts TOD can bring.
  • This presentation also points out a unique land use
    scenario planning approach, which is a community
    stakeholder driven process combined with a cutting-
    edge GIS simulation technology.


                                                     3
Project Overview
  • Land use scenario planning in conjunction with 2035
    Long Range Transportation Plan (LRTP) of North
    Florida Transportation Planning Organization
  • Exploring alternative land use concepts and the
    associated long term transportation impacts and
    opportunities
  • By Design, a TOD oriented land use
    alternative is compared with other
    land use concepts.
Base of Land Use Alternatives
   • Developing future land use alternatives in the region
     in order to accommodate projected population and
     employment growth

                     2005             Increment 2005-2035    Annual Growth Rate
 County
             Population Employment Population Employment Population Employment
 Clay          184,624       47,374   132,176       25,270     1.84%        1.44%
 Nassau         67,681       20,213    38,819       10,782     1.52%        1.44%
 St. Johns     157,981       65,666   168,382       35,027     2.45%        1.44%
 Duval         855,572      509,112   362,428      271,564     1.18%        1.44%
 Total       1,262,795      642,365   701,805      342,643 Avg .1.48%   Avg. 1.44%
Four Scenarios


  •   Scenario A – Concentric Outer Growth
  •   Scenario B – North-South Centers Growth
  •   Scenario C – Satellite Centers Growth
  •   Scenario D – Transit Centers Growth
Scenario A – Concentric Outer Growth
  • Outer growth into vacant
    and undeveloped lands
    outside the existing
    urbanized areas
  • Supporting expanded
    highway network with
    limited transit options
Scenario B – North South Centers Growth
  • Growth in an outward
    direction away from existing
    urbanized areas and into the
    region’s north and southeast
    quadrants
  • Supporting north-south
    commuter rail transit and
    continued highway
    investment
Scenario C – Clustered Satellite Centers Growth
  • Outer growth along key
    transportation corridors and
    strong redevelopment
    strategy in old urban areas
  • Supporting moderate levels
    of transits and continued
    highway investment
Scenario D – Transit Centers Growth
  • Redevelopment
    concentrating in major
    urban areas and
    development along future
    commuter rail and other
    transit
  • Supporting most robust
    transit network for the
    region
SCENARIO BUILDING PROCESS
Place Type Oriented Modeling
  • Community elements - pedestrian shed
    • ¼ mile diameter area (40 acres)
    • Combination of different development types (building
      types) in the shed
Creation of Community Element


                     Land use detail
                     Dwelling Units/Acre            5
                     Non-Residential FAR            0.72

                     Non-Developable       Developable
          1/4 mi     Park        2%        SF House        3%
                     Retention   2%        Apartment       12 %
                     Road        15 %      Mixed Use       6%
                     Civic       15 %      Retail          12 %
                     Parking     5%        Office          28 %
                     Total       39 %      Total           61 %
                     GRAND TOTAL                           100 %
Community Element for the Project
Scenario Development Workshop
 Chip set play
Scenarios by Participants
From Chips to Data
  • Converting allocated chips by the public to GIS data
    by CorPlan
  • Land use / transportation planners interpreted chips
    and perform minor modification in order to make
    the allocations fit in areas
Building Type Modeling


 Any types of buildings can be modeled, even
 parcel without a building like park or parking lot
Creation of Community Elements
Allocation of Community Elements
Allocation Results Review
  • Summary Interface
  • Providing socio-economic data based on allocation
  • Keeping tracking allocation in overall or in particular
    areas
Selection of an Alternative
SCENARIO COMPARISON
Overview
Performance Measure Criteria
% of new jobs by County
% of new jobs located within 1/2 mile of proposed premium transit corridor
% of new jobs located within 1/2 mile of fixed route bus corridor
% of new jobs located within 1 mile of proposed premium transit corridor
% of new jobs located within 1 mile of fixed route bus corridor
% of new Jobs Located within 2miles from the Beltline
% of new Jobs Located within Downtown Jacksonville
% of new jobs located within walkable communities
% of agricultural land in total developed area
% of existing agricultural land remaining "Un-Urbanized"
% of new population located within 1/2 mile of premium transit corridor
% of new population located within 1/2 mile of regular transit corridor
% of new population located within 1 mile of premium transit corridor
% of new population located within 1 mile of regular transit corridor
% of new Population Located within 2 mile from Beltline
% of New Population Located within Downtown Jacksonville
% of new population accommodated by townhouse or multifamily housing
% of wetlands in total developed area
% of wetlands consumed
Total acreage of urbanized lands
Total acreage of existing agricultural lands converted to urbanized lands
Total acreage of wetlands converted to urbanized lands
Persons per acre of developed lands (efficiency of urbanized land)
% of new households accommodated by redevelopment
% of jobs accommodated by redevelopment
Lands for Development
             More Transit Components
Development Along Transit Corridor
 Within ½ mile of proposed premium transit corridor

                       More Transit Components
CBD Infill and Redevelopment
              More Transit Components
Density & Mixed Uses
COMPARISON WITH TREND
Trend
 • Forecasting future land use
   patterns based on the
   future land use and
   development plans (DRIs)
   approved of submitted
Trend VS. Scenario D
                       Land Consumption
                       and Redevelopment
Trend VS. Scenario D
                       Density and mixed uses
Trend VS. Scenario D
  Transit
Trend VS. Scenario D
              -7%          Traffic


                    -15%

                                     None

                    u
                                            7%
Trend VS. Scenario D
                       Traffic and air quality
               -22%


                                                  -6%


                                           -10%
SUMMARY
Lessons Learned
  • Transit Oriented Development can save significant
    amount of agricultural and environmental lands and
    also improve traffic flows and air quality.
  • When TODs are combined with highway
    development, careful consideration is required in
    terms of locations and spacing of TODs.
  • In the case that there is strong infill and
    redevelopment trends in a region, TODs can be an
    excellent development option connecting
    redevelopment hubs and supporting balanced
    development

                                                    37

LTC, Jack R. Widmeyer Transportation Research Conference, Going to San Bernardino A Symposium on Intermodal Transit Stations and Transit-Oriented Design, 11/06/2009, Do Kim

  • 1.
    The Impacts ofTOD: From Regional Land Use Perspective Do Kim, Ph.D. Department of Urban and Regional Planning California State Polytechnic University - Pomona Jack R. Widmeyer Transportation Research Conference 1
  • 2.
  • 3.
    Introduction •This presentation focuses on how Transit Oriented Development (TOD) impacts on future regional land use and transportation conditions. • By comparing with other land use alternatives, this presentation provides quantitative evidences on how much positive impacts TOD can bring. • This presentation also points out a unique land use scenario planning approach, which is a community stakeholder driven process combined with a cutting- edge GIS simulation technology. 3
  • 4.
    Project Overview • Land use scenario planning in conjunction with 2035 Long Range Transportation Plan (LRTP) of North Florida Transportation Planning Organization • Exploring alternative land use concepts and the associated long term transportation impacts and opportunities • By Design, a TOD oriented land use alternative is compared with other land use concepts.
  • 5.
    Base of LandUse Alternatives • Developing future land use alternatives in the region in order to accommodate projected population and employment growth 2005 Increment 2005-2035 Annual Growth Rate County Population Employment Population Employment Population Employment Clay 184,624 47,374 132,176 25,270 1.84% 1.44% Nassau 67,681 20,213 38,819 10,782 1.52% 1.44% St. Johns 157,981 65,666 168,382 35,027 2.45% 1.44% Duval 855,572 509,112 362,428 271,564 1.18% 1.44% Total 1,262,795 642,365 701,805 342,643 Avg .1.48% Avg. 1.44%
  • 6.
    Four Scenarios • Scenario A – Concentric Outer Growth • Scenario B – North-South Centers Growth • Scenario C – Satellite Centers Growth • Scenario D – Transit Centers Growth
  • 7.
    Scenario A –Concentric Outer Growth • Outer growth into vacant and undeveloped lands outside the existing urbanized areas • Supporting expanded highway network with limited transit options
  • 8.
    Scenario B –North South Centers Growth • Growth in an outward direction away from existing urbanized areas and into the region’s north and southeast quadrants • Supporting north-south commuter rail transit and continued highway investment
  • 9.
    Scenario C –Clustered Satellite Centers Growth • Outer growth along key transportation corridors and strong redevelopment strategy in old urban areas • Supporting moderate levels of transits and continued highway investment
  • 10.
    Scenario D –Transit Centers Growth • Redevelopment concentrating in major urban areas and development along future commuter rail and other transit • Supporting most robust transit network for the region
  • 11.
  • 12.
    Place Type OrientedModeling • Community elements - pedestrian shed • ¼ mile diameter area (40 acres) • Combination of different development types (building types) in the shed
  • 13.
    Creation of CommunityElement Land use detail Dwelling Units/Acre 5 Non-Residential FAR 0.72 Non-Developable Developable 1/4 mi Park 2% SF House 3% Retention 2% Apartment 12 % Road 15 % Mixed Use 6% Civic 15 % Retail 12 % Parking 5% Office 28 % Total 39 % Total 61 % GRAND TOTAL 100 %
  • 14.
  • 15.
  • 16.
  • 17.
    From Chips toData • Converting allocated chips by the public to GIS data by CorPlan • Land use / transportation planners interpreted chips and perform minor modification in order to make the allocations fit in areas
  • 18.
    Building Type Modeling Any types of buildings can be modeled, even parcel without a building like park or parking lot
  • 19.
  • 20.
  • 21.
    Allocation Results Review • Summary Interface • Providing socio-economic data based on allocation • Keeping tracking allocation in overall or in particular areas
  • 22.
    Selection of anAlternative
  • 23.
  • 24.
    Overview Performance Measure Criteria %of new jobs by County % of new jobs located within 1/2 mile of proposed premium transit corridor % of new jobs located within 1/2 mile of fixed route bus corridor % of new jobs located within 1 mile of proposed premium transit corridor % of new jobs located within 1 mile of fixed route bus corridor % of new Jobs Located within 2miles from the Beltline % of new Jobs Located within Downtown Jacksonville % of new jobs located within walkable communities % of agricultural land in total developed area % of existing agricultural land remaining "Un-Urbanized" % of new population located within 1/2 mile of premium transit corridor % of new population located within 1/2 mile of regular transit corridor % of new population located within 1 mile of premium transit corridor % of new population located within 1 mile of regular transit corridor % of new Population Located within 2 mile from Beltline % of New Population Located within Downtown Jacksonville % of new population accommodated by townhouse or multifamily housing % of wetlands in total developed area % of wetlands consumed Total acreage of urbanized lands Total acreage of existing agricultural lands converted to urbanized lands Total acreage of wetlands converted to urbanized lands Persons per acre of developed lands (efficiency of urbanized land) % of new households accommodated by redevelopment % of jobs accommodated by redevelopment
  • 25.
    Lands for Development More Transit Components
  • 26.
    Development Along TransitCorridor Within ½ mile of proposed premium transit corridor More Transit Components
  • 27.
    CBD Infill andRedevelopment More Transit Components
  • 28.
  • 29.
  • 30.
    Trend • Forecastingfuture land use patterns based on the future land use and development plans (DRIs) approved of submitted
  • 31.
    Trend VS. ScenarioD Land Consumption and Redevelopment
  • 32.
    Trend VS. ScenarioD Density and mixed uses
  • 33.
  • 34.
    Trend VS. ScenarioD -7% Traffic -15% None u 7%
  • 35.
    Trend VS. ScenarioD Traffic and air quality -22% -6% -10%
  • 36.
  • 37.
    Lessons Learned • Transit Oriented Development can save significant amount of agricultural and environmental lands and also improve traffic flows and air quality. • When TODs are combined with highway development, careful consideration is required in terms of locations and spacing of TODs. • In the case that there is strong infill and redevelopment trends in a region, TODs can be an excellent development option connecting redevelopment hubs and supporting balanced development 37