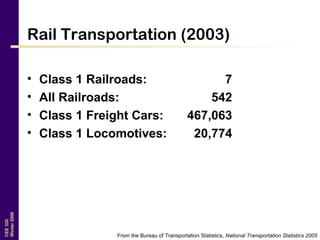
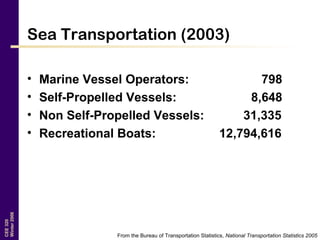
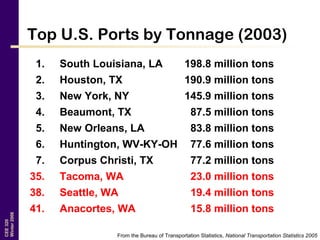
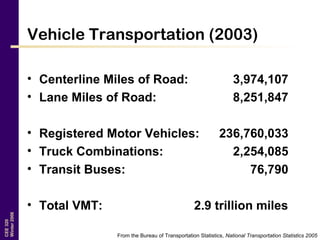
CEE320
Winter2006
Transportation
Facts and Figures
CEE 320
Steve Muench
4 January 2006
CEE320
Winter2006
Outline
1. Air
2. Rail
3. Sea
4. Vehicle
a. National
b. Washington State
CEE320
Winter2006
Air Transportation (2003/4)
• Airports: 19,820
• Airports for Public Use: 5,288
• Certified Airports: 599
– (30+ seat passenger planes)
• Major Air Carriers: 14
• All Air Carriers: 80
• Air Carrier Aircraft: 8,176
• Aircraft: 211,444
From the Bureau of Transportation Statistics, National Transportation Statistics 2005
CEE320
Winter2006
Passengers Boarded (2004)
1. Atlanta (Hartsfield) 40,399,034
2. Chicago (O’Hare) 33,652,789
3. Dallas/Ft. Worth 27,563,022
4. Los Angeles 22,892,208
5. Denver 19,855,508
6. Las Vegas 19,421,617
7. Phoenix 19,122,960
8. Minneapolis 17,282,235
9. Detroit 16,784,352
10. Houston 16,706,616
13. SeaTac 13,744,095
From the Bureau of Transportation Statistics, National Transportation Statistics 2005
CEE320
Winter2006
Rail Transportation (2003)
• Class 1 Railroads: 7
• All Railroads: 542
• Class 1 Freight Cars: 467,063
• Class 1 Locomotives: 20,774
From the Bureau of Transportation Statistics, National Transportation Statistics 2005
CEE320
Winter2006
Sea Transportation (2003)
• Marine Vessel Operators: 798
• Self-Propelled Vessels: 8,648
• Non Self-Propelled Vessels: 31,335
• Recreational Boats: 12,794,616
From the Bureau of Transportation Statistics, National Transportation Statistics 2005
CEE320
Winter2006
Top U.S. Ports by Tonnage (2003)
1. South Louisiana, LA 198.8 million tons
2. Houston, TX 190.9 million tons
3. New York, NY 145.9 million tons
4. Beaumont, TX 87.5 million tons
5. New Orleans, LA 83.8 million tons
6. Huntington, WV-KY-OH 77.6 million tons
7. Corpus Christi, TX 77.2 million tons
35. Tacoma, WA 23.0 million tons
38. Seattle, WA 19.4 million tons
41. Anacortes, WA 15.8 million tons
From the Bureau of Transportation Statistics, National Transportation Statistics 2005
CEE320
Winter2006
Vehicle Transportation (2003)
• Centerline Miles of Road: 3,974,107
• Lane Miles of Road: 8,251,847
• Registered Motor Vehicles: 236,760,033
• Truck Combinations: 2,254,085
• Transit Buses: 76,790
• Total VMT: 2.9 trillion miles
From the Bureau of Transportation Statistics, National Transportation Statistics 2005
CEE320
Winter2006
Road Use Growth
From the Bureau of Transportation Statistics, National Transportation Statistics 2003
CEE320
Winter2006
Highway Vehicle Trends
From FHWA, Highway Statistics Series
CEE320
Winter2006
U.S. Interstate Highway Condition
From the Bureau of Transportation Statistics, National Transportation Statistics 2005
0
5
10
15
20
25
30
35
40
45
Poor Mediocre Fair Good Very good
Rating
Percentage
1992
2003
CEE320
Winter2006
Travel to Work (2003)
• Automobile: 88.1%
– Single: (79.4%)
– Carpool: (8.7%)
• Public Transportation: 4.4%
• Bicycle or Motorcycle: 0.6%
• Walk: 2.7%
From the Bureau of Transportation Statistics, National Transportation Statistics 2005
CEE320
Winter2006
Measures of Congestion (2003)
Rank Urban Area Travel Time Index
1. Los Angeles, CA 1.75
2. Chicago, IL 1.57
3. S.F. – Oakland, CA 1.54
4. Washington, D.C. 1.51
5. Atlanta, GA 1.46
6. Houston, TX 1.42
7. Miami, FL 1.42
11. Seattle – Everett, WA 1.38
From the Texas Transportation Institute
CEE320
Winter2006
Financing Transportation
• Total Government Revenues (2001)
$125 Billion
• Total Government Expenditures (2001)
$183 Billion
From the Bureau of Transportation Statistics, National Transportation Statistics 2005
CEE320
Winter2006
Financing Transportation
Highway Transit Air
Total Revenues $ 86.1 $ 13.3 $ 21.9
Highway Trust Fund $ 26.9 $ 4.6 -
Airport and Airways
Trust Fund
- - $ 10.1
State $ 52.6 $ 1.6 $ 0.9
Local $ 6.6 $ 7.2 $ 10.9
(2001 Data - Billions of Dollars)
From the Bureau of Transportation Statistics, National Transportation Statistics 2005
CEE320
Winter2006
Annual Metro Passenger Trips
9295100
49.4
41.635.1
130
0
20
40
60
80
100
120
140
1944 1974 1976 1978 2000 2003 2004
Year
Millions of
Passenger
Trips
CEE320
Winter2006
Annual Metro Trips per Capita
(based on population of Seattle)
163169178
10083
70
351
0
50
100
150
200
250
300
350
400
1944 1974 1976 1978 2000 2003 2004
Year
TripsperCapita
1950s Plan for Seattle freeways
1977 Plan for the West Seattle
bridge and a waterfront freeway
1977 proposed Alaskan Way waterfront freeway
1977 proposed West Seattle bridge

Transportation Facts (Transportation Engineering)

  • 1.
  • 2.
    CEE320 Winter2006 Outline 1. Air 2. Rail 3.Sea 4. Vehicle a. National b. Washington State
  • 3.
    CEE320 Winter2006 Air Transportation (2003/4) •Airports: 19,820 • Airports for Public Use: 5,288 • Certified Airports: 599 – (30+ seat passenger planes) • Major Air Carriers: 14 • All Air Carriers: 80 • Air Carrier Aircraft: 8,176 • Aircraft: 211,444 From the Bureau of Transportation Statistics, National Transportation Statistics 2005
  • 4.
    CEE320 Winter2006 Passengers Boarded (2004) 1.Atlanta (Hartsfield) 40,399,034 2. Chicago (O’Hare) 33,652,789 3. Dallas/Ft. Worth 27,563,022 4. Los Angeles 22,892,208 5. Denver 19,855,508 6. Las Vegas 19,421,617 7. Phoenix 19,122,960 8. Minneapolis 17,282,235 9. Detroit 16,784,352 10. Houston 16,706,616 13. SeaTac 13,744,095 From the Bureau of Transportation Statistics, National Transportation Statistics 2005
  • 5.
    CEE320 Winter2006 Rail Transportation (2003) •Class 1 Railroads: 7 • All Railroads: 542 • Class 1 Freight Cars: 467,063 • Class 1 Locomotives: 20,774 From the Bureau of Transportation Statistics, National Transportation Statistics 2005
  • 6.
    CEE320 Winter2006 Sea Transportation (2003) •Marine Vessel Operators: 798 • Self-Propelled Vessels: 8,648 • Non Self-Propelled Vessels: 31,335 • Recreational Boats: 12,794,616 From the Bureau of Transportation Statistics, National Transportation Statistics 2005
  • 7.
    CEE320 Winter2006 Top U.S. Portsby Tonnage (2003) 1. South Louisiana, LA 198.8 million tons 2. Houston, TX 190.9 million tons 3. New York, NY 145.9 million tons 4. Beaumont, TX 87.5 million tons 5. New Orleans, LA 83.8 million tons 6. Huntington, WV-KY-OH 77.6 million tons 7. Corpus Christi, TX 77.2 million tons 35. Tacoma, WA 23.0 million tons 38. Seattle, WA 19.4 million tons 41. Anacortes, WA 15.8 million tons From the Bureau of Transportation Statistics, National Transportation Statistics 2005
  • 8.
    CEE320 Winter2006 Vehicle Transportation (2003) •Centerline Miles of Road: 3,974,107 • Lane Miles of Road: 8,251,847 • Registered Motor Vehicles: 236,760,033 • Truck Combinations: 2,254,085 • Transit Buses: 76,790 • Total VMT: 2.9 trillion miles From the Bureau of Transportation Statistics, National Transportation Statistics 2005
  • 9.
    CEE320 Winter2006 Road Use Growth Fromthe Bureau of Transportation Statistics, National Transportation Statistics 2003
  • 10.
    CEE320 Winter2006 Highway Vehicle Trends FromFHWA, Highway Statistics Series
  • 11.
    CEE320 Winter2006 U.S. Interstate HighwayCondition From the Bureau of Transportation Statistics, National Transportation Statistics 2005 0 5 10 15 20 25 30 35 40 45 Poor Mediocre Fair Good Very good Rating Percentage 1992 2003
  • 12.
    CEE320 Winter2006 Travel to Work(2003) • Automobile: 88.1% – Single: (79.4%) – Carpool: (8.7%) • Public Transportation: 4.4% • Bicycle or Motorcycle: 0.6% • Walk: 2.7% From the Bureau of Transportation Statistics, National Transportation Statistics 2005
  • 13.
    CEE320 Winter2006 Measures of Congestion(2003) Rank Urban Area Travel Time Index 1. Los Angeles, CA 1.75 2. Chicago, IL 1.57 3. S.F. – Oakland, CA 1.54 4. Washington, D.C. 1.51 5. Atlanta, GA 1.46 6. Houston, TX 1.42 7. Miami, FL 1.42 11. Seattle – Everett, WA 1.38 From the Texas Transportation Institute
  • 14.
    CEE320 Winter2006 Financing Transportation • TotalGovernment Revenues (2001) $125 Billion • Total Government Expenditures (2001) $183 Billion From the Bureau of Transportation Statistics, National Transportation Statistics 2005
  • 15.
    CEE320 Winter2006 Financing Transportation Highway TransitAir Total Revenues $ 86.1 $ 13.3 $ 21.9 Highway Trust Fund $ 26.9 $ 4.6 - Airport and Airways Trust Fund - - $ 10.1 State $ 52.6 $ 1.6 $ 0.9 Local $ 6.6 $ 7.2 $ 10.9 (2001 Data - Billions of Dollars) From the Bureau of Transportation Statistics, National Transportation Statistics 2005
  • 16.
    CEE320 Winter2006 Annual Metro PassengerTrips 9295100 49.4 41.635.1 130 0 20 40 60 80 100 120 140 1944 1974 1976 1978 2000 2003 2004 Year Millions of Passenger Trips
  • 17.
    CEE320 Winter2006 Annual Metro Tripsper Capita (based on population of Seattle) 163169178 10083 70 351 0 50 100 150 200 250 300 350 400 1944 1974 1976 1978 2000 2003 2004 Year TripsperCapita
  • 18.
    1950s Plan forSeattle freeways
  • 19.
    1977 Plan forthe West Seattle bridge and a waterfront freeway
  • 20.
    1977 proposed AlaskanWay waterfront freeway 1977 proposed West Seattle bridge

Editor's Notes

  • #3 Give a sense of scale
  • #5 Atlanta Hartsfield has grown by 18 million since 1993 For Dallas/Ft. Worth 17.9 million passengers boarded were American Airlines Heathrow is probably about 31.5 million (and growing with the addition of another terminal) Hong Kong is about 17 million (33.4 million passengers total) Largest airport by land area in U.S.: Denver International (something like 50 square miles)
  • #6 In 1960 we used to have over 1.6 million freight cars and 29,000 locomotives class 1, class 2, etc. railroad company: Refers to a railroad company's size in terms of its average annual operating revenue as defined by the Interstate Commerce Commission. Because the Interstate Commerce Commission was disbanded in the mid-1990's, the future of this definition is somewhat clouded. The Interstate Commerce Commission used to update the figures regularly for inflation. As a general rule a typical class 1 railroad is a large company with many miles of track and serves many states with a fleet of locomotives sometimes in the thousands. A typical class 2 railroad is a company that is a regional railroad that may serve a few states and has somewhere around 30 to 200 locomotives. A typical class 3 railroad is a small railroad that typically operates only in one state, has only a handfull of locomotives, and usually operates less than 200 miles of track. In many cases, a class 3 railroad exists primarily to serve only one city or a single industry or industrial area. Specific Figures are: Class 1 - railroads with an operating income of $50 million ( 1978 dollars ) or more. Class 3 - railroads with an operating income of less than $10 million ( 1978 dollars ). Class 2 - railroads that fall in between these figures.
  • #7 In 1960 we had: 6,543 self-propelled vessels 16,777 non self-propelled vessels 2.4 million recreational boats
  • #8 Hong Kong = largest at 18.1 million TEU or roughly 380 million tons Singapore = 17.09 million TEU and 360 million tons of cargo handled Shanghai is 3rd and rapidly approaching Hong Kong and Singapore Hamburg = 94 million tons
  • #9 In 1960 we had: 74.4 million registered vehicles 700,000+ truck combinations 53,400 Transit Buses
  • #13 All numbers indicate that we are driving our cars to work ourselves more and more
  • #14 This is 2002 Data. For 2001 data, Seattle was 4th Seattle has gone from 1.07 in 1982 to 1.35 now
  • #19 State Highways includes 764 miles of Interstate Highway
  • #20 State Highways includes 764 miles of Interstate Highway
  • #22 <number>
  • #23 <number>