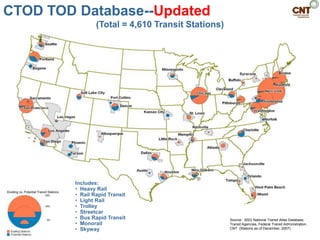
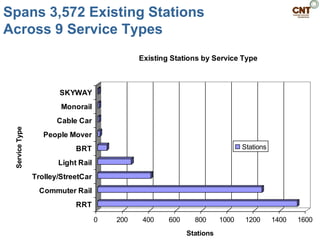
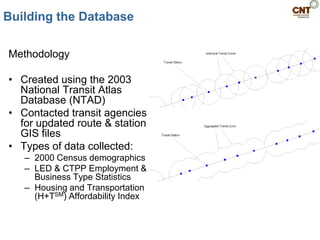
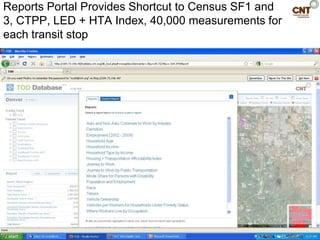
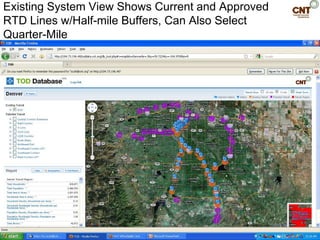
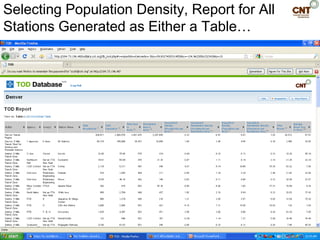
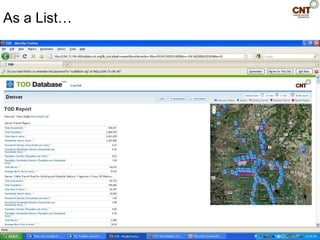
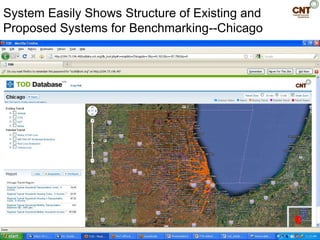
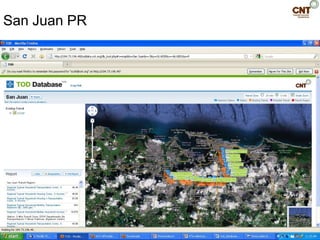
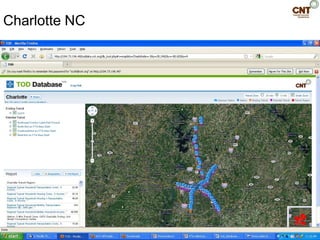
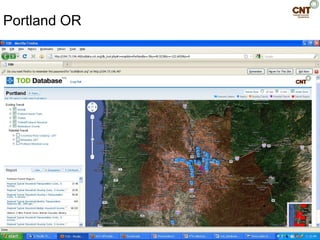
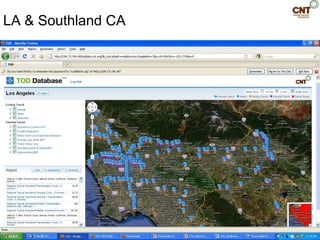
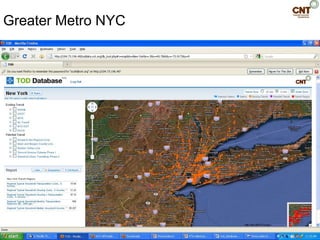
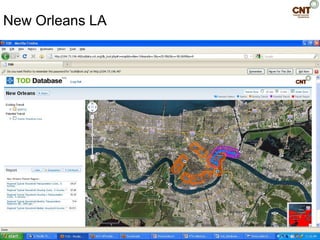
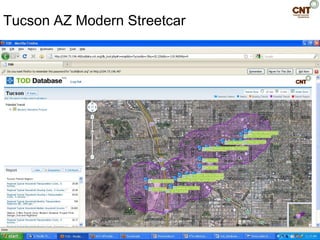
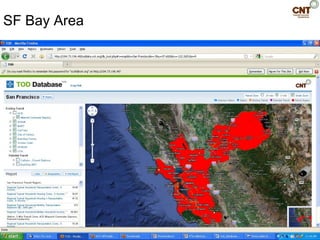
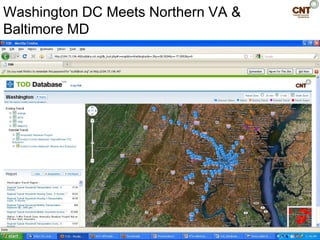
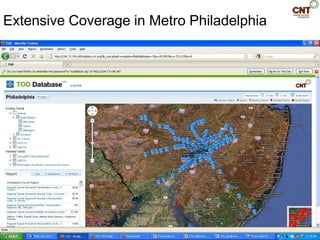
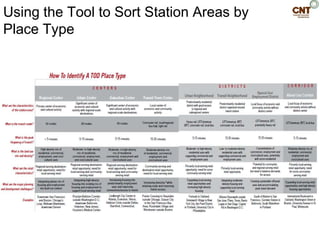
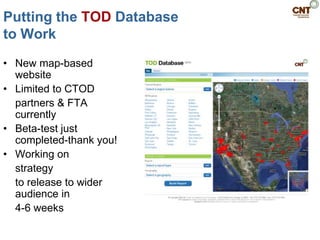
National TOD
Database


              National Housing Conference
           Partners in Innovation Conference
                 Denver CO July 27 2010
  Scott Bernstein, Center for Neighborhood Technology
                              &
          Sasha Forbes, Reconnecting America
What is the H+T Affordability Index?
   –A tool to measure the 2 largest household costs –
   housing and transportation – by neighborhood.
   –Prepared for all 161,000 neighborhoods (Census
   Block Groups) in 337 regions of the US w/80% of US
   population
            H+T Affordability Index Equation
     H+T Index = (Housing Costs + Transportation Costs)
                          Income
The Meaning of Drive ‗til You Qualify—
Transport Costs Can Approach or Exceed
Housing Costs for Working Households
             % Income


                        10-15 miles out

                                          Miles
Why a TOD Database?

   • Revealing the value of transit requires
     data from many sources
   • Needed a tool that allows you to quickly
     warehouse data for the purpose of
     creating new knowledge and
     understandings
   • Existing networks weren‘t dedicated to
     producing the tool
Got Transit?
History - CTOD Database
• Initially funded by FTA
  (2005) then HUD then by
  FTA/HUD/Surdna
• Tool to measure & project
  transit demand
• Identifies existing &
  potential TOD Markets &
  their benefits
• Goal: Accelerate practice
  & commitment to high
  performance TOD
Realizing the Potential: Expanding Housing
Opportunities Near Transit
by Center for Transit-Oriented Development
for FTA and HUD
CTOD TOD Database--Updated
                 (Total = 4,610 Transit Stations)


         Includes:
         • Heavy Rail
         • Rail Rapid Transit
         • Light Rail
         • Trolley
         • Streetcar
         • Bus Rapid Transit                        Source: 2003 National Transit Atlas Database,
         • Monorail                                 Transit Agencies, Federal Transit Administration,
         • Skyway                                   CNT (Stations as of December, 2007)
Spans 3,572 Existing Stations
Across 9 Service Types
                                              Existing Stations by Service Type


                       SKYWAY
                        Monorail
                       Cable Car
 Service Type


                   People Mover
                            BRT                                               Stations

                       Light Rail
                Trolley/StreetCar
                 Commuter Rail
                            RRT

                                    0   200    400    600     800      1000    1200      1400   1600
                                                            Stations
Building the Database

Methodology

• Created using the 2003
  National Transit Atlas
  Database (NTAD)
• Contacted transit agencies
  for updated route & station
  GIS files
• Types of data collected:
   – 2000 Census demographics
   – LED & CTPP Employment &
     Business Type Statistics
   – Housing and Transportation
     (H+TSM) Affordability Index
Data at a Neighborhood Level

                                     • GIS used to
                                       proportionally assign the
                                       data
                                     • Drilling down to the
                                       neighborhood using
                                       census tracts, block
                                       groups and blocks
                           Census Boundaries don‘t align
                            perfectly with Transit Zones,
                             particularly Census Tracts
                               Census Blocks allow us
           Census Block         to really focus on the
           Groups offer       detailed characteristics of
            finer detail           a neighborhood
User Friendly Features

• One Stop Shop - Over 40,000
  characteristics for 4,610 stations
• Data on 3 levels:
                                       Barrio Logan, San Diego, CA
   – Transit Zone (1/2 mile radius
     buffer around each station)
   – Aggregate of Transit Zones
     (accounts for overlap between
     Transit Zones)
   – Transit Region
• Presented in standard and custom
  report formats
• Displayed on a map-based
  website
• Can be downloaded in Microsoft
  Word table or Excel spreadsheet
Data from Census 2000
• Summary File 1
  – Housing units,              Fruitvale Transit Village,
    occupancy status,           Oakland
    tenure, household size,
    race/ethnicity, gender
• Summary File 3
  – Income, median value of
    owner occupied housing,
    gross rent, vacancy
    status, vehicle
    ownership, mode to
    work, travel time to work
• Census Transportation
  Planning Package
  (CTPP)
  – Place of residence/work,
    and origin/destination
Longitudinal Employment-
Household Data (LED)

  • Joint effort – US Census and Bureau of Transportation
    Statistics
  • 2002 – 08 data reported by household and workplace for
    most states
  • Quarterly workforce indicators
     – Average earnings, number of establishments, job
       creation/destruction, new hires
  • Residence area characteristics
     – Count of workers by sector, quarterly earnings, worker
       age, median distance traveled to work
  • Workplace area characteristics
     – Count of jobs by sector, worker age, and monthly
       earnings
Housing +Transportation
Affordability Index


http://htaindex.org

• 41 Characteristics
  for each Census
  Block Group
• 161,000 Block
  Groups in all 337
  Metro Areas
• Same Underlying
  Geography as the
  TOD Database
Preview—
The National TOD Database
 Fruitvale Transit Village, Oakland, CA
Metro Denver Example
Clicking on Denver Pulls Up a View of Region
Highlighting Existing Fixed Guideway in Orange
and Proposed in Purple
Reports Portal Provides Shortcut to Census SF1 and
3, CTPP, LED + HTA Index, 40,000 measurements for
each transit stop
Existing System View Shows Current and Approved
RTD Lines w/Half-mile Buffers, Can Also Select
Quarter-Mile
View Shows Eventual Build-Out for All Existing
& Proposed Lines
Selecting Population Density, Report for All
Stations Generated as Either a Table…
As a List…
Or You Can Decide to Download as a
Spreadsheet…
Shown Here as a Word/Excel Spreadsheet
Selecting a Station Generates a Popup
Window…
For This Station at 18th & Stout Showing
Population, Net & Gross Density, Block Size
And Switching from Data to Streetview
Gives a 360 Degree Scroll
Same View for Union Station…
Or for Pepsi Center/Elitch Gardens
And Again With Streetview
Contrasting These Denver Stations with Planned East
Corridor Station Toward Airport: Low Density, Little
Urban Form—Near Montbello, Green Valley Ranch,
Foreclosure Hot-Spots
As Shown by the Streetview
Switching to HT View at the North Metro
162d Avenue Stop—H+T over 70% for AMI
Good Value Creation Potential But Will Take
Some Work to Reduce H+T To Affordability
System Easily Shows Structure of Existing and
Proposed Systems for Benchmarking--Chicago
San Juan PR
Charlotte NC
Portland OR
LA & Southland CA
Greater Metro NYC
New Orleans LA
Tucson AZ Modern Streetcar
Will Meet Phoenix LRT If Sun Corridor Rail
Connects the Two
SF Bay Area
Washington DC Meets Northern VA &
Baltimore MD
Which Continues to Pursue Expansion
Cleveland GRTA Hosting Leadership Development
on Regional Economic Strategy
Extensive Coverage in Metro Philadelphia
Sound Transit Connects Seattle Tacoma
and Cascadia Region
Using the Tool to Sort Station Areas by
Place Type
Generate Standard Reports


  • Residential densities
  • Journey to work
  • Where workers live by occupation
  • Auto and non-auto commute to work by
    industry
  • Vehicles per worker for households under
    poverty status

  Or create custom reports of your choosing!
Using the Database to Promote
Sustainable & Livable Communities
• Planners and Developers interested
  in identifying underutilized TOD
  markets for residential, commercial
  and economic development
• Transit agencies interested in the
  joint development potential of their
  real estate holdings                       Pearl District, Portland, OR
• Transportation planners interested in
  origin and destination commute
  patterns within a specific transit zone
  or corridor
• MPOs/Regional Councils preparing
  consolidated land use and
  transportation plans looking to identify
  priority development areas
• Researchers working at local and/or        Portland, OR
  national level on transit access issues
  related to affordable housing,
  minority, low-income, elderly, or
  disabled persons
Developing Strategic TOD Plans for
Deploying Underutilized Assets
Helping Justify Reduced Parking
in TOD Areas—Housing
For People Not Cars
Identifying Strong & Weak
Local Retail Market Potential
The Downeaster as a Model for Continued and
Enhanced Regional Cooperation and Strategy

• Serves a largely rural
  corridor NE from Boston
  through NH to Portland ME
  (the other)
• Needed a focus on
  community benefits to get
  public & private buy-in
• Resulted in support from
  community leaders,
  investors, Gov. Baldacci,
  legislature & USDOT
Boston – Portland
CBSA


•288 Stations in 2000
•10 in Downeaster Corridor
•Expansion to Freeport, Brunswick
•396,000 HHs in 2000, 16% of total
•Will grow to 752,000 or 24% in 2030
•Growth of 356,000 almost ½
of Projected Regional Growth
•Only NY, LA, Bay Area & Chicago
Will See More TOD HHs
•Corridor to NE is a chain of rural
cities
•Extension two stops to Freeport &
Brunswick will link to Maine Eastern
RR to Rockland
Portland   Old Orchard Bch

                             Saco-Biddeford
                                              Wells
                                              Wells
                                                           Dover
                   Examined each station area’s
                   Demographics, housing,
                   Commercial, economics


                                                           Durham


                                               Haverhill
                              Woburn
              Boston
                                                           Exeter
Downeaster Expansion Benefits Study in 2008
Projected by 2030-


  • Cumulative             • $2.4 B in annual
    construction of $7.2B    resident and visitor
  • Const/rehab of 42k hu    purchasing power
    + 6.8M sf commercial • $75 M in annual new
  • Over 17,000 jobs         state and local tax
  • $244 million in annual   revenue
    transport cost savings • Affordable housing
                             required by State law

                         Broke ground last month!
                         Will be completed Fall 2012
Putting the TOD Database
to Work
• New map-based
  website
• Limited to CTOD
  partners & FTA
  currently
• Beta-test just
  completed-thank you!
• Working on
  strategy
  to release to wider
  audience in
  4-6 weeks
Coming Soon to a
Station Near You

   • Release to limited audience – advisory review
     team representing different stakeholders
   • Collect & synthesize feedback
   • Make system improvements & enhance
     applications—EG, Include updated Census 2010
     (in 2012) and ACS 2005-2009 data this winter
   • Dissemination
     – Create users guide & users group
     – Develop a ―train the trainer‖ curriculum
     – Prepare & implement a marketing plan
Thank You! CTOD Contacts for the
  National TOD Database Are:

             Nadine Fogarty
    nfogarty@strategiceconomics.com

          Maria Choca Urban
           maria@cnt.org

           Abby Thorne-Lyman
    athorne@reconnectingamerica.org

Dever9/27 Scott Bernstein

  • 1.
    National TOD Database National Housing Conference Partners in Innovation Conference Denver CO July 27 2010 Scott Bernstein, Center for Neighborhood Technology & Sasha Forbes, Reconnecting America
  • 2.
    What is theH+T Affordability Index? –A tool to measure the 2 largest household costs – housing and transportation – by neighborhood. –Prepared for all 161,000 neighborhoods (Census Block Groups) in 337 regions of the US w/80% of US population H+T Affordability Index Equation H+T Index = (Housing Costs + Transportation Costs) Income
  • 3.
    The Meaning ofDrive ‗til You Qualify— Transport Costs Can Approach or Exceed Housing Costs for Working Households % Income 10-15 miles out Miles
  • 4.
    Why a TODDatabase? • Revealing the value of transit requires data from many sources • Needed a tool that allows you to quickly warehouse data for the purpose of creating new knowledge and understandings • Existing networks weren‘t dedicated to producing the tool
  • 5.
    Got Transit? History -CTOD Database • Initially funded by FTA (2005) then HUD then by FTA/HUD/Surdna • Tool to measure & project transit demand • Identifies existing & potential TOD Markets & their benefits • Goal: Accelerate practice & commitment to high performance TOD Realizing the Potential: Expanding Housing Opportunities Near Transit by Center for Transit-Oriented Development for FTA and HUD
  • 6.
    CTOD TOD Database--Updated (Total = 4,610 Transit Stations) Includes: • Heavy Rail • Rail Rapid Transit • Light Rail • Trolley • Streetcar • Bus Rapid Transit Source: 2003 National Transit Atlas Database, • Monorail Transit Agencies, Federal Transit Administration, • Skyway CNT (Stations as of December, 2007)
  • 7.
    Spans 3,572 ExistingStations Across 9 Service Types Existing Stations by Service Type SKYWAY Monorail Cable Car Service Type People Mover BRT Stations Light Rail Trolley/StreetCar Commuter Rail RRT 0 200 400 600 800 1000 1200 1400 1600 Stations
  • 8.
    Building the Database Methodology •Created using the 2003 National Transit Atlas Database (NTAD) • Contacted transit agencies for updated route & station GIS files • Types of data collected: – 2000 Census demographics – LED & CTPP Employment & Business Type Statistics – Housing and Transportation (H+TSM) Affordability Index
  • 9.
    Data at aNeighborhood Level • GIS used to proportionally assign the data • Drilling down to the neighborhood using census tracts, block groups and blocks Census Boundaries don‘t align perfectly with Transit Zones, particularly Census Tracts Census Blocks allow us Census Block to really focus on the Groups offer detailed characteristics of finer detail a neighborhood
  • 10.
    User Friendly Features •One Stop Shop - Over 40,000 characteristics for 4,610 stations • Data on 3 levels: Barrio Logan, San Diego, CA – Transit Zone (1/2 mile radius buffer around each station) – Aggregate of Transit Zones (accounts for overlap between Transit Zones) – Transit Region • Presented in standard and custom report formats • Displayed on a map-based website • Can be downloaded in Microsoft Word table or Excel spreadsheet
  • 11.
    Data from Census2000 • Summary File 1 – Housing units, Fruitvale Transit Village, occupancy status, Oakland tenure, household size, race/ethnicity, gender • Summary File 3 – Income, median value of owner occupied housing, gross rent, vacancy status, vehicle ownership, mode to work, travel time to work • Census Transportation Planning Package (CTPP) – Place of residence/work, and origin/destination
  • 12.
    Longitudinal Employment- Household Data(LED) • Joint effort – US Census and Bureau of Transportation Statistics • 2002 – 08 data reported by household and workplace for most states • Quarterly workforce indicators – Average earnings, number of establishments, job creation/destruction, new hires • Residence area characteristics – Count of workers by sector, quarterly earnings, worker age, median distance traveled to work • Workplace area characteristics – Count of jobs by sector, worker age, and monthly earnings
  • 13.
    Housing +Transportation Affordability Index http://htaindex.org •41 Characteristics for each Census Block Group • 161,000 Block Groups in all 337 Metro Areas • Same Underlying Geography as the TOD Database
  • 14.
    Preview— The National TODDatabase Fruitvale Transit Village, Oakland, CA
  • 15.
  • 16.
    Clicking on DenverPulls Up a View of Region Highlighting Existing Fixed Guideway in Orange and Proposed in Purple
  • 17.
    Reports Portal ProvidesShortcut to Census SF1 and 3, CTPP, LED + HTA Index, 40,000 measurements for each transit stop
  • 18.
    Existing System ViewShows Current and Approved RTD Lines w/Half-mile Buffers, Can Also Select Quarter-Mile
  • 19.
    View Shows EventualBuild-Out for All Existing & Proposed Lines
  • 20.
    Selecting Population Density,Report for All Stations Generated as Either a Table…
  • 21.
  • 22.
    Or You CanDecide to Download as a Spreadsheet…
  • 23.
    Shown Here asa Word/Excel Spreadsheet
  • 24.
    Selecting a StationGenerates a Popup Window…
  • 25.
    For This Stationat 18th & Stout Showing Population, Net & Gross Density, Block Size
  • 26.
    And Switching fromData to Streetview Gives a 360 Degree Scroll
  • 27.
    Same View forUnion Station…
  • 28.
    Or for PepsiCenter/Elitch Gardens
  • 29.
    And Again WithStreetview
  • 30.
    Contrasting These DenverStations with Planned East Corridor Station Toward Airport: Low Density, Little Urban Form—Near Montbello, Green Valley Ranch, Foreclosure Hot-Spots
  • 31.
    As Shown bythe Streetview
  • 32.
    Switching to HTView at the North Metro 162d Avenue Stop—H+T over 70% for AMI
  • 33.
    Good Value CreationPotential But Will Take Some Work to Reduce H+T To Affordability
  • 34.
    System Easily ShowsStructure of Existing and Proposed Systems for Benchmarking--Chicago
  • 35.
  • 36.
  • 37.
  • 38.
  • 39.
  • 40.
  • 41.
  • 42.
    Will Meet PhoenixLRT If Sun Corridor Rail Connects the Two
  • 43.
  • 44.
    Washington DC MeetsNorthern VA & Baltimore MD
  • 45.
    Which Continues toPursue Expansion
  • 46.
    Cleveland GRTA HostingLeadership Development on Regional Economic Strategy
  • 47.
    Extensive Coverage inMetro Philadelphia
  • 48.
    Sound Transit ConnectsSeattle Tacoma and Cascadia Region
  • 49.
    Using the Toolto Sort Station Areas by Place Type
  • 50.
    Generate Standard Reports • Residential densities • Journey to work • Where workers live by occupation • Auto and non-auto commute to work by industry • Vehicles per worker for households under poverty status Or create custom reports of your choosing!
  • 51.
    Using the Databaseto Promote Sustainable & Livable Communities • Planners and Developers interested in identifying underutilized TOD markets for residential, commercial and economic development • Transit agencies interested in the joint development potential of their real estate holdings Pearl District, Portland, OR • Transportation planners interested in origin and destination commute patterns within a specific transit zone or corridor • MPOs/Regional Councils preparing consolidated land use and transportation plans looking to identify priority development areas • Researchers working at local and/or Portland, OR national level on transit access issues related to affordable housing, minority, low-income, elderly, or disabled persons
  • 52.
    Developing Strategic TODPlans for Deploying Underutilized Assets
  • 53.
    Helping Justify ReducedParking in TOD Areas—Housing For People Not Cars
  • 54.
    Identifying Strong &Weak Local Retail Market Potential
  • 55.
    The Downeaster asa Model for Continued and Enhanced Regional Cooperation and Strategy • Serves a largely rural corridor NE from Boston through NH to Portland ME (the other) • Needed a focus on community benefits to get public & private buy-in • Resulted in support from community leaders, investors, Gov. Baldacci, legislature & USDOT
  • 56.
    Boston – Portland CBSA •288Stations in 2000 •10 in Downeaster Corridor •Expansion to Freeport, Brunswick •396,000 HHs in 2000, 16% of total •Will grow to 752,000 or 24% in 2030 •Growth of 356,000 almost ½ of Projected Regional Growth •Only NY, LA, Bay Area & Chicago Will See More TOD HHs •Corridor to NE is a chain of rural cities •Extension two stops to Freeport & Brunswick will link to Maine Eastern RR to Rockland
  • 57.
    Portland Old Orchard Bch Saco-Biddeford Wells Wells Dover Examined each station area’s Demographics, housing, Commercial, economics Durham Haverhill Woburn Boston Exeter
  • 58.
    Downeaster Expansion BenefitsStudy in 2008 Projected by 2030- • Cumulative • $2.4 B in annual construction of $7.2B resident and visitor • Const/rehab of 42k hu purchasing power + 6.8M sf commercial • $75 M in annual new • Over 17,000 jobs state and local tax • $244 million in annual revenue transport cost savings • Affordable housing required by State law Broke ground last month! Will be completed Fall 2012
  • 59.
    Putting the TODDatabase to Work • New map-based website • Limited to CTOD partners & FTA currently • Beta-test just completed-thank you! • Working on strategy to release to wider audience in 4-6 weeks
  • 60.
    Coming Soon toa Station Near You • Release to limited audience – advisory review team representing different stakeholders • Collect & synthesize feedback • Make system improvements & enhance applications—EG, Include updated Census 2010 (in 2012) and ACS 2005-2009 data this winter • Dissemination – Create users guide & users group – Develop a ―train the trainer‖ curriculum – Prepare & implement a marketing plan
  • 61.
    Thank You! CTODContacts for the National TOD Database Are: Nadine Fogarty nfogarty@strategiceconomics.com Maria Choca Urban maria@cnt.org Abby Thorne-Lyman athorne@reconnectingamerica.org