
Download to read offline
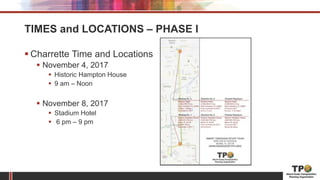
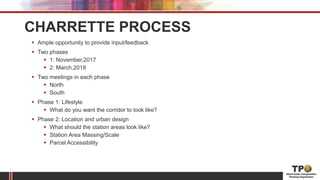

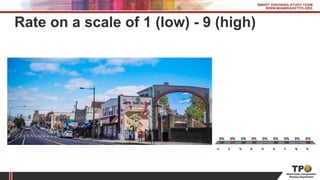
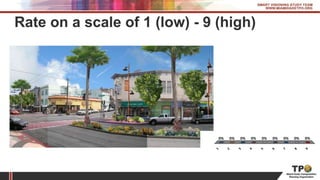
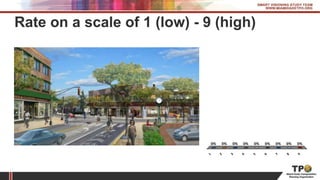
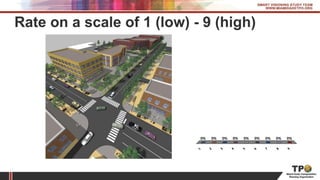
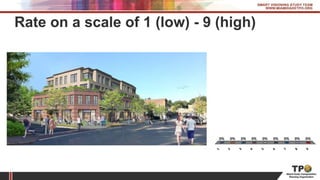
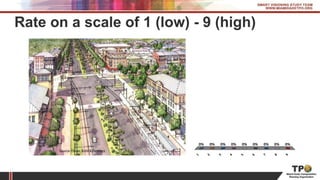
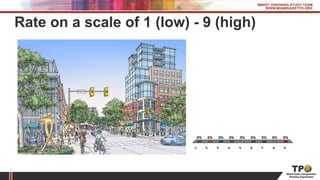
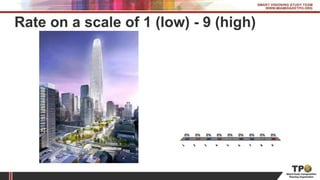
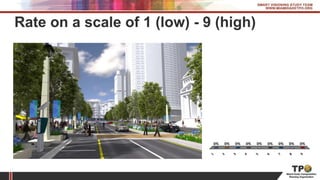
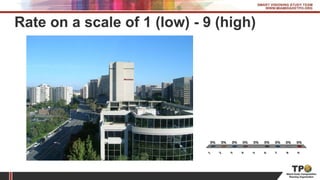
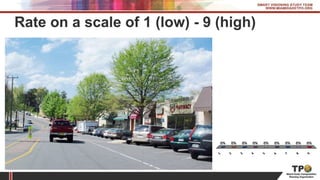
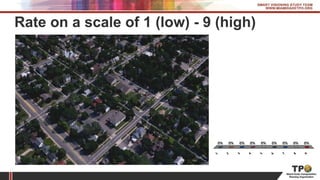
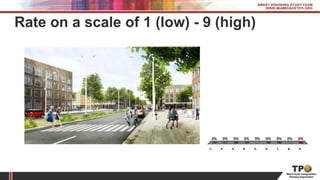
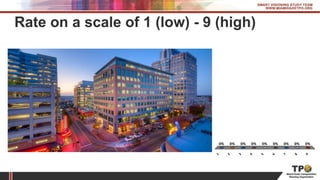
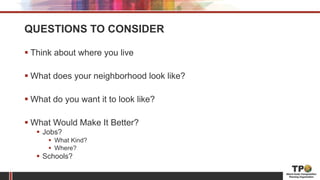

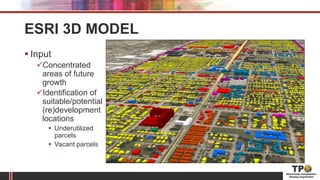
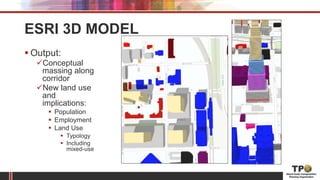
The document summarizes a land use charrette for the North Corridor transit study. It provides information on the charrette dates and locations in November 2017. The charrette process will have two phases to gather input on community visions for lifestyle and station area design. Visuals and polling were used to get feedback from participants on what types of development they prefer and what their neighborhoods currently look like. Next steps include refining the information from the charrettes using an ESRI modeling tool to create conceptual development scenarios for population, employment, and land use changes along the corridor.


