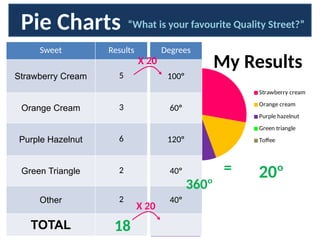
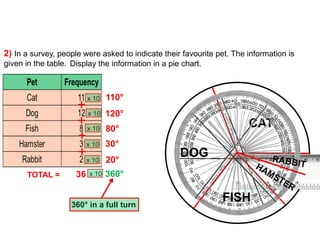
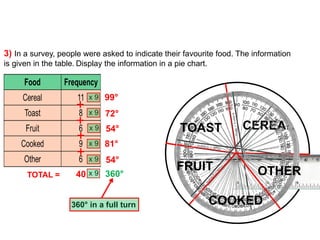
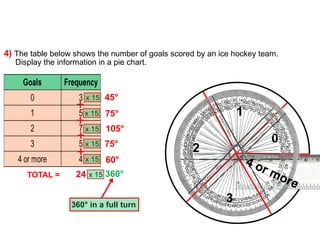
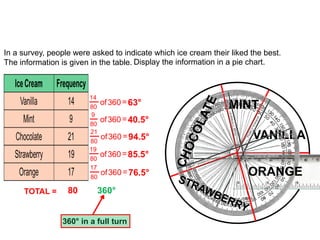
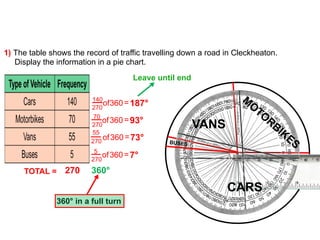
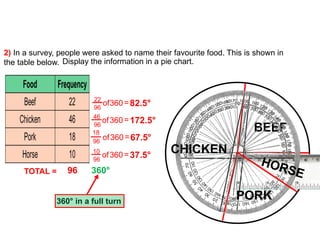
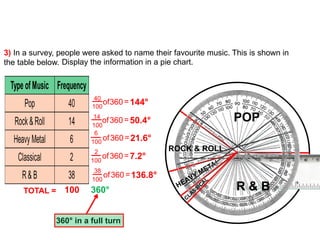
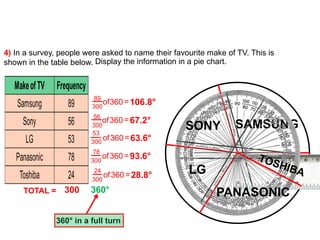
The document presents various survey results displayed as pie charts, including preferences for candies, subjects, pets, foods, ice creams, traffic types, and TV brands. Each survey includes a total count and calculates the corresponding angles for pie chart representation. The data highlights popular choices across different categories based on respondents' selections.


![Presenting-Experimental-Data-Grade-8 [Autosaved].pptx](https://cdn.slidesharecdn.com/ss_thumbnails/presenting-experimental-data-grade-8autosaved-240925105557-9775d0ae-thumbnail.jpg?width=640&height=640&fit=bounds)
![Presenting-Experimental-Data-Grade-8 [Autosaved].pptx](https://cdn.slidesharecdn.com/ss_thumbnails/presenting-experimental-data-grade-8autosaved-240925104859-008a237a-thumbnail.jpg?width=640&height=640&fit=bounds)


![Drawing pie charts[1]](https://cdn.slidesharecdn.com/ss_thumbnails/drawingpiecharts1-140423094435-phpapp01-thumbnail.jpg?width=640&height=640&fit=bounds)


