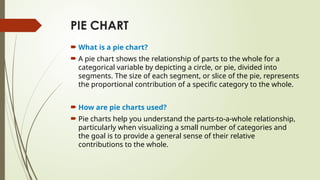
PRESENTATION OF DATA
• PIE CHART
• BAR GRAPH FOR NOMINAL DATA
• Prepared by: Mary Ann Malate
PIE CHART
 What is a pie chart?
 A pie chart shows the relationship of parts to the whole for a
categorical variable by depicting a circle, or pie, divided into
segments. The size of each segment, or slice of the pie, represents
the proportional contribution of a specific category to the whole.
 How are pie charts used?
 Pie charts help you understand the parts-to-a-whole relationship,
particularly when visualizing a small number of categories and
the goal is to provide a general sense of their relative
contributions to the whole.
A pie chart, sometimes called a circle chart, is a way of
summarizing a set of nominal data or displaying the different
values of a given variable (e.g. percentage distribution). This type
of chart is a circle divided into a series of segments. Each
segment represents a particular category. The area of each
segment is the same proportion of a circle as the category is of
the total data set.
Pie chart usually shows the component parts of a whole.
Sometimes you will see a segment of the drawing separated
from the rest of the pie in order to emphasize an important
piece of information. This is called an exploded pie chart.
Pie charts should be used sparingly for two
reasons:
1. They are best used for displaying statistical
information when there are no more than six
components only—otherwise, the resulting
picture will be too complex to understand.
2. Pie charts are not useful when the values of
each component are too similar because it is
difficult to see the differences between slice
sizes.
Constructing a pie chart
 A pie chart uses percentages to compare information. Percentages are used
because they are the easiest way to represent a whole. The whole is equal to 100%.
 For example, if you spend 7 hours at school and 55 minutes of that time is spent
eating lunch, then 13.1% of your school day was spent eating lunch. To present this
in a pie chart, you would need to find out how many degrees represent 13.1%.
 This calculation is done by developing the equation:
 percent ÷ 100 × 360 degrees = the number of degrees
 This ratio works because the total percent of the pie chart represents 100% and
there are 360 degrees in a circle. Therefore 47.16 degrees of the circle (13.1%)
represents the time spent eating lunch.
7 hours = 420 min
55/420 = 13.1 %
Percent ÷ 100 × 360° = the no.
of degrees
13.1 ÷ 100 × 360° = 47.16°
47.16 °
A pie chart is
constructed by
converting the
share of each
component into a
percentage of
360 degrees. In
Chart 5.4.2,
music
preferences in
14- to 19-year-
olds are clearly
shown.
To reproduce the pie chart:
If 50% of the students liked rap, then 50% of the whole circle graph
(360 degrees) is equal to 180 degrees.
1. Draw a circle with your protractor.
2. Starting from the 12 o’clock position on the circle, measure an
angle of 180 degrees with your protractor. The rap component
should make up half of your circle. Mark this radius off with your
ruler.
3. Repeat the process for each remaining music category, drawing in
the radius according to its percentage of 360 degrees. The final
category need not be measured as its radius is already in position.
4. Label the segments with percentage values. The percentage and
category level should be indicated beside their corresponding
segments.
Tip! When drawing a pie chart, ensure that
the segments are ordered by size (largest
to smallest) and in a clockwise direction.
Activity:
 A pet shop’s record shows the type of pets sold.
50% are dogs, 30% are cats, 15% are birds, and 5% are
fishes. Solve for the corresponding no. of degrees and
present this data in a pie chart.
BAR GRAPH FOR NOMINAL DATA
 Nominal data are divided into mutually exclusive categories that
do not have a natural order, nor do they provide any
quantitative information.
 The definition of nominal in statistics is “in name only.” This
definition indicates how these data consist of category names—
all you can do is name the group to which each observation
belongs. Nominal and categorical data are synonyms, and can
be used interchangeably.
Nominal Variable
Category Names
Gender
 Male
 Female
 Non-binary
Blood Type
 A
 B
 AB
 O
College Major
 Statistics
 Political Science
 Psychology
 Engineering
Area Code for Phone Calls
 605
 423
 682
Note that when categorical data use numbers, such as area codes, they do
not provide numerical information. They’re still only names of groups.
Bar charts highlight differences between categories or other
discrete data. Look for differences between categories as a
screening method for identifying possible relationships. If your
dataset includes multiple categorical variables, bar charts can
help you understand the relationship between them.
Bar charts typically contain the following elements:
•Y-axis representing counts, variable function (average, sum,
standard deviation), or other summary value.
•Categories or discrete values on the x-axis.
•Vertical bars representing the value for each category.
•Optionally, the bars can be clustered in groups and/or stacked
to facilitate comparisons.
The table below shows the two categorical variables
which are gender and ice cream flavor preference.
How to calculate row and column percentages in a two-way table:
 Row Percentage: Take a cell value and divide by the cell’s row total.
 Column Percentage: Take a cell value and divide by the cell’s column total.
Activity:
The following data were obtained when 150 students were asked
about their favorite beverages.
Water – 60
Coffee – 35
Soda – 30
Tea – 15
Milk- 10
Present this data through a bar graph.
Thank you!

PieChartAndBarGraphforNominalllData.pptx

  • 1.
    PRESENTATION OF DATA •PIE CHART • BAR GRAPH FOR NOMINAL DATA • Prepared by: Mary Ann Malate
  • 2.
    PIE CHART  Whatis a pie chart?  A pie chart shows the relationship of parts to the whole for a categorical variable by depicting a circle, or pie, divided into segments. The size of each segment, or slice of the pie, represents the proportional contribution of a specific category to the whole.  How are pie charts used?  Pie charts help you understand the parts-to-a-whole relationship, particularly when visualizing a small number of categories and the goal is to provide a general sense of their relative contributions to the whole.
  • 3.
    A pie chart,sometimes called a circle chart, is a way of summarizing a set of nominal data or displaying the different values of a given variable (e.g. percentage distribution). This type of chart is a circle divided into a series of segments. Each segment represents a particular category. The area of each segment is the same proportion of a circle as the category is of the total data set. Pie chart usually shows the component parts of a whole. Sometimes you will see a segment of the drawing separated from the rest of the pie in order to emphasize an important piece of information. This is called an exploded pie chart.
  • 5.
    Pie charts shouldbe used sparingly for two reasons: 1. They are best used for displaying statistical information when there are no more than six components only—otherwise, the resulting picture will be too complex to understand. 2. Pie charts are not useful when the values of each component are too similar because it is difficult to see the differences between slice sizes.
  • 6.
    Constructing a piechart  A pie chart uses percentages to compare information. Percentages are used because they are the easiest way to represent a whole. The whole is equal to 100%.  For example, if you spend 7 hours at school and 55 minutes of that time is spent eating lunch, then 13.1% of your school day was spent eating lunch. To present this in a pie chart, you would need to find out how many degrees represent 13.1%.  This calculation is done by developing the equation:  percent ÷ 100 × 360 degrees = the number of degrees  This ratio works because the total percent of the pie chart represents 100% and there are 360 degrees in a circle. Therefore 47.16 degrees of the circle (13.1%) represents the time spent eating lunch.
  • 7.
    7 hours =420 min 55/420 = 13.1 % Percent ÷ 100 × 360° = the no. of degrees 13.1 ÷ 100 × 360° = 47.16° 47.16 °
  • 8.
    A pie chartis constructed by converting the share of each component into a percentage of 360 degrees. In Chart 5.4.2, music preferences in 14- to 19-year- olds are clearly shown.
  • 9.
    To reproduce thepie chart: If 50% of the students liked rap, then 50% of the whole circle graph (360 degrees) is equal to 180 degrees. 1. Draw a circle with your protractor. 2. Starting from the 12 o’clock position on the circle, measure an angle of 180 degrees with your protractor. The rap component should make up half of your circle. Mark this radius off with your ruler. 3. Repeat the process for each remaining music category, drawing in the radius according to its percentage of 360 degrees. The final category need not be measured as its radius is already in position. 4. Label the segments with percentage values. The percentage and category level should be indicated beside their corresponding segments.
  • 10.
    Tip! When drawinga pie chart, ensure that the segments are ordered by size (largest to smallest) and in a clockwise direction.
  • 11.
    Activity:  A petshop’s record shows the type of pets sold. 50% are dogs, 30% are cats, 15% are birds, and 5% are fishes. Solve for the corresponding no. of degrees and present this data in a pie chart.
  • 12.
    BAR GRAPH FORNOMINAL DATA  Nominal data are divided into mutually exclusive categories that do not have a natural order, nor do they provide any quantitative information.  The definition of nominal in statistics is “in name only.” This definition indicates how these data consist of category names— all you can do is name the group to which each observation belongs. Nominal and categorical data are synonyms, and can be used interchangeably.
  • 13.
    Nominal Variable Category Names Gender Male  Female  Non-binary Blood Type  A  B  AB  O College Major  Statistics  Political Science  Psychology  Engineering Area Code for Phone Calls  605  423  682 Note that when categorical data use numbers, such as area codes, they do not provide numerical information. They’re still only names of groups.
  • 14.
    Bar charts highlightdifferences between categories or other discrete data. Look for differences between categories as a screening method for identifying possible relationships. If your dataset includes multiple categorical variables, bar charts can help you understand the relationship between them. Bar charts typically contain the following elements: •Y-axis representing counts, variable function (average, sum, standard deviation), or other summary value. •Categories or discrete values on the x-axis. •Vertical bars representing the value for each category. •Optionally, the bars can be clustered in groups and/or stacked to facilitate comparisons.
  • 15.
    The table belowshows the two categorical variables which are gender and ice cream flavor preference.
  • 17.
    How to calculaterow and column percentages in a two-way table:  Row Percentage: Take a cell value and divide by the cell’s row total.  Column Percentage: Take a cell value and divide by the cell’s column total.
  • 19.
    Activity: The following datawere obtained when 150 students were asked about their favorite beverages. Water – 60 Coffee – 35 Soda – 30 Tea – 15 Milk- 10 Present this data through a bar graph.
  • 20.