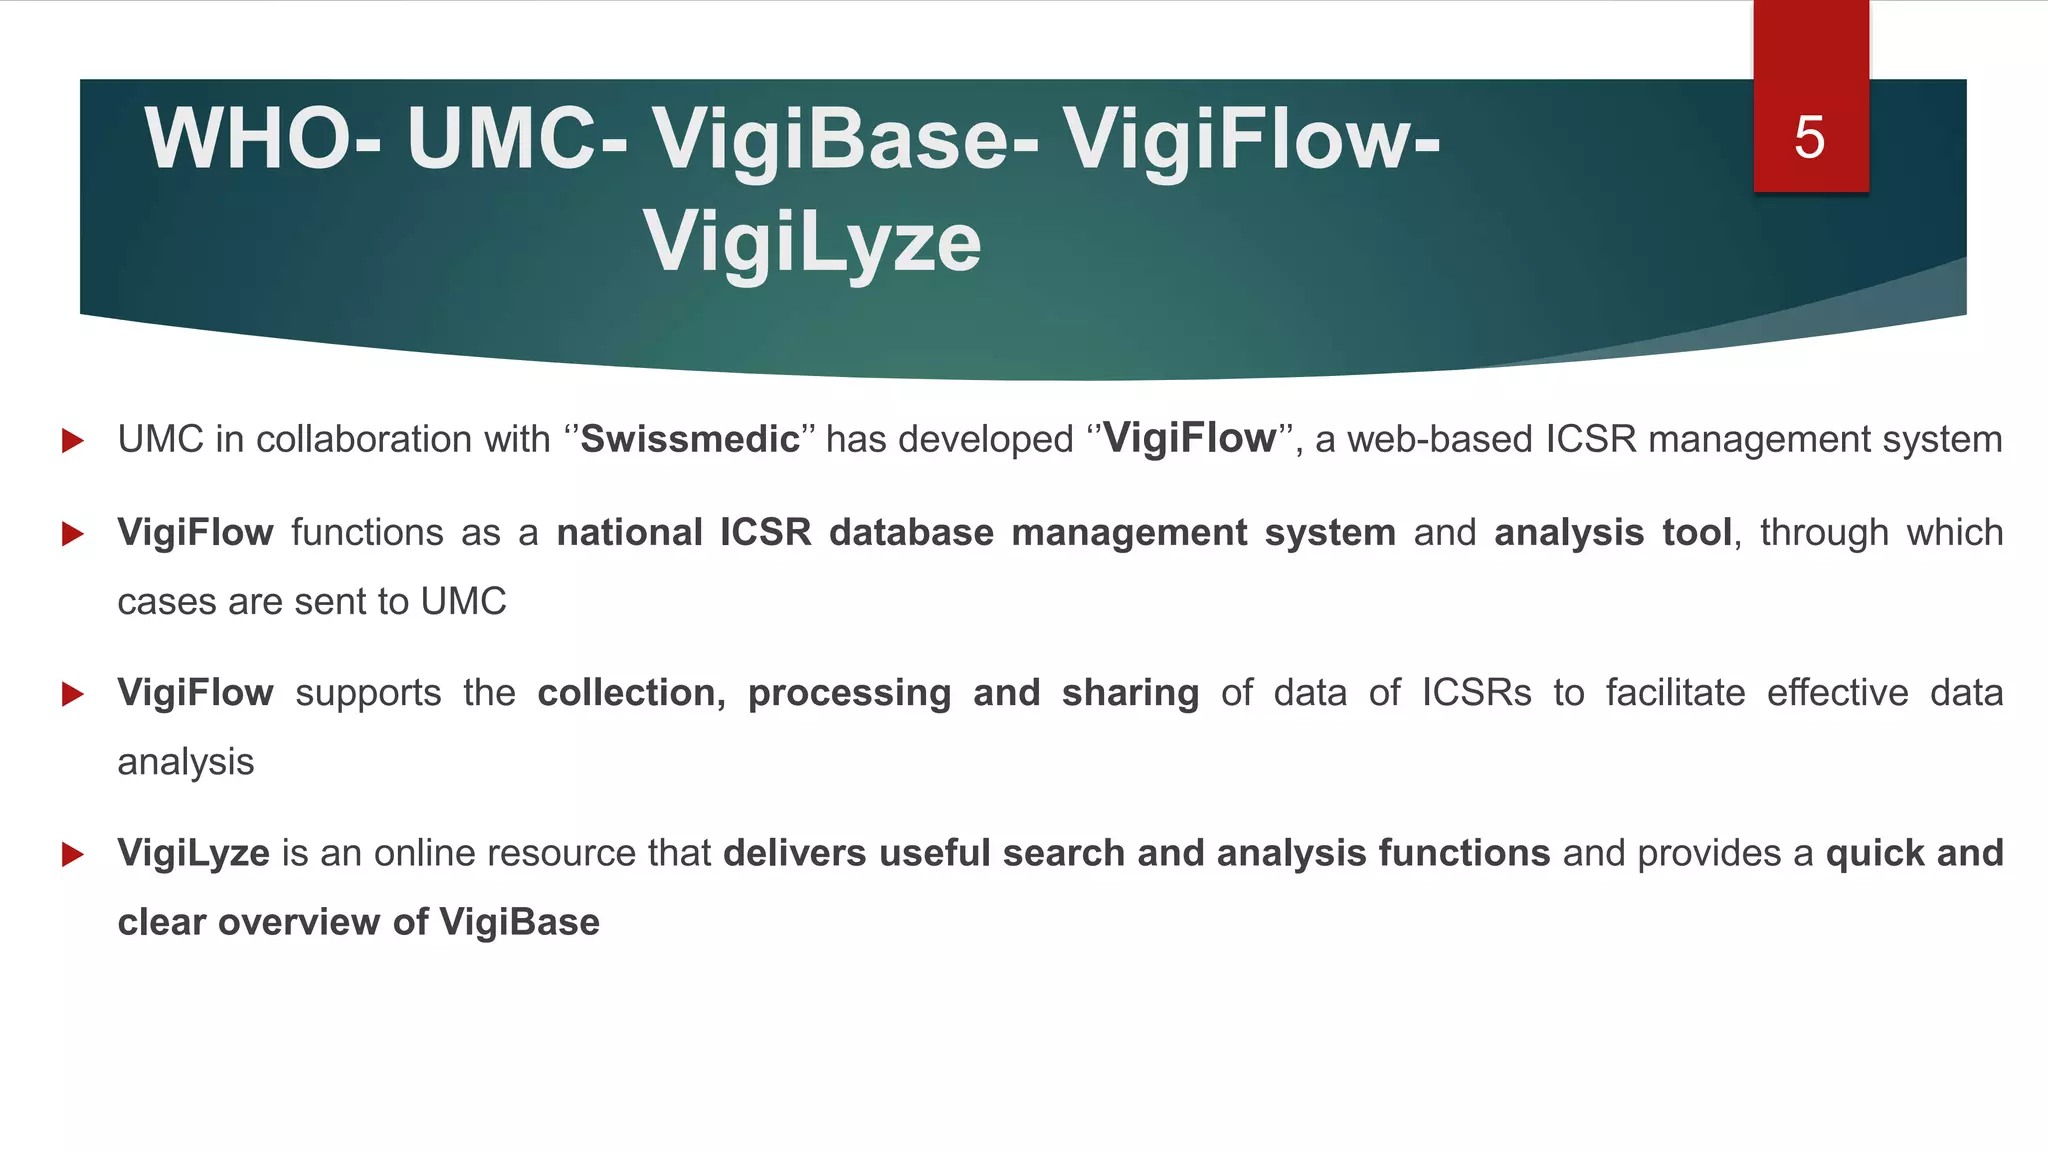
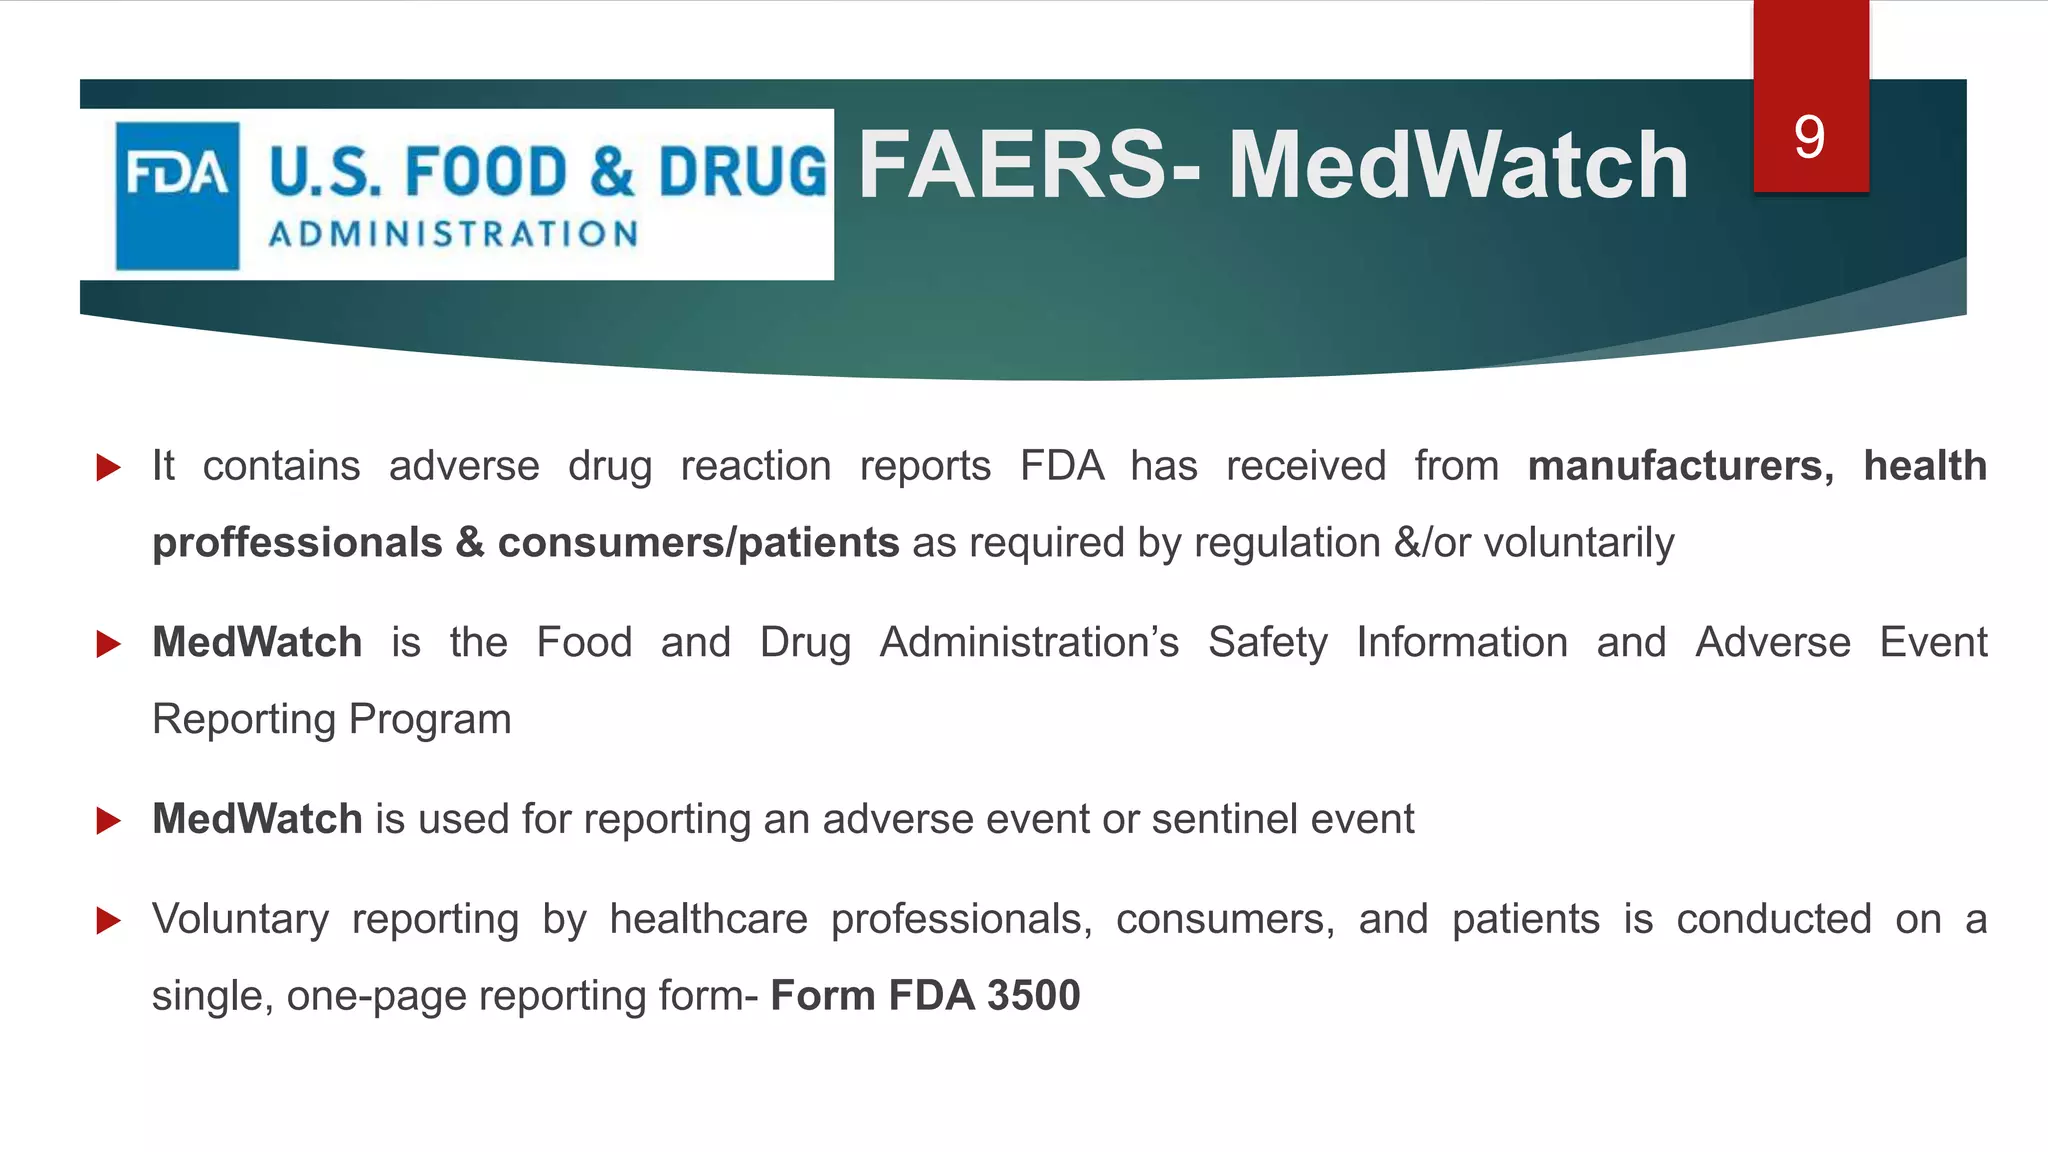
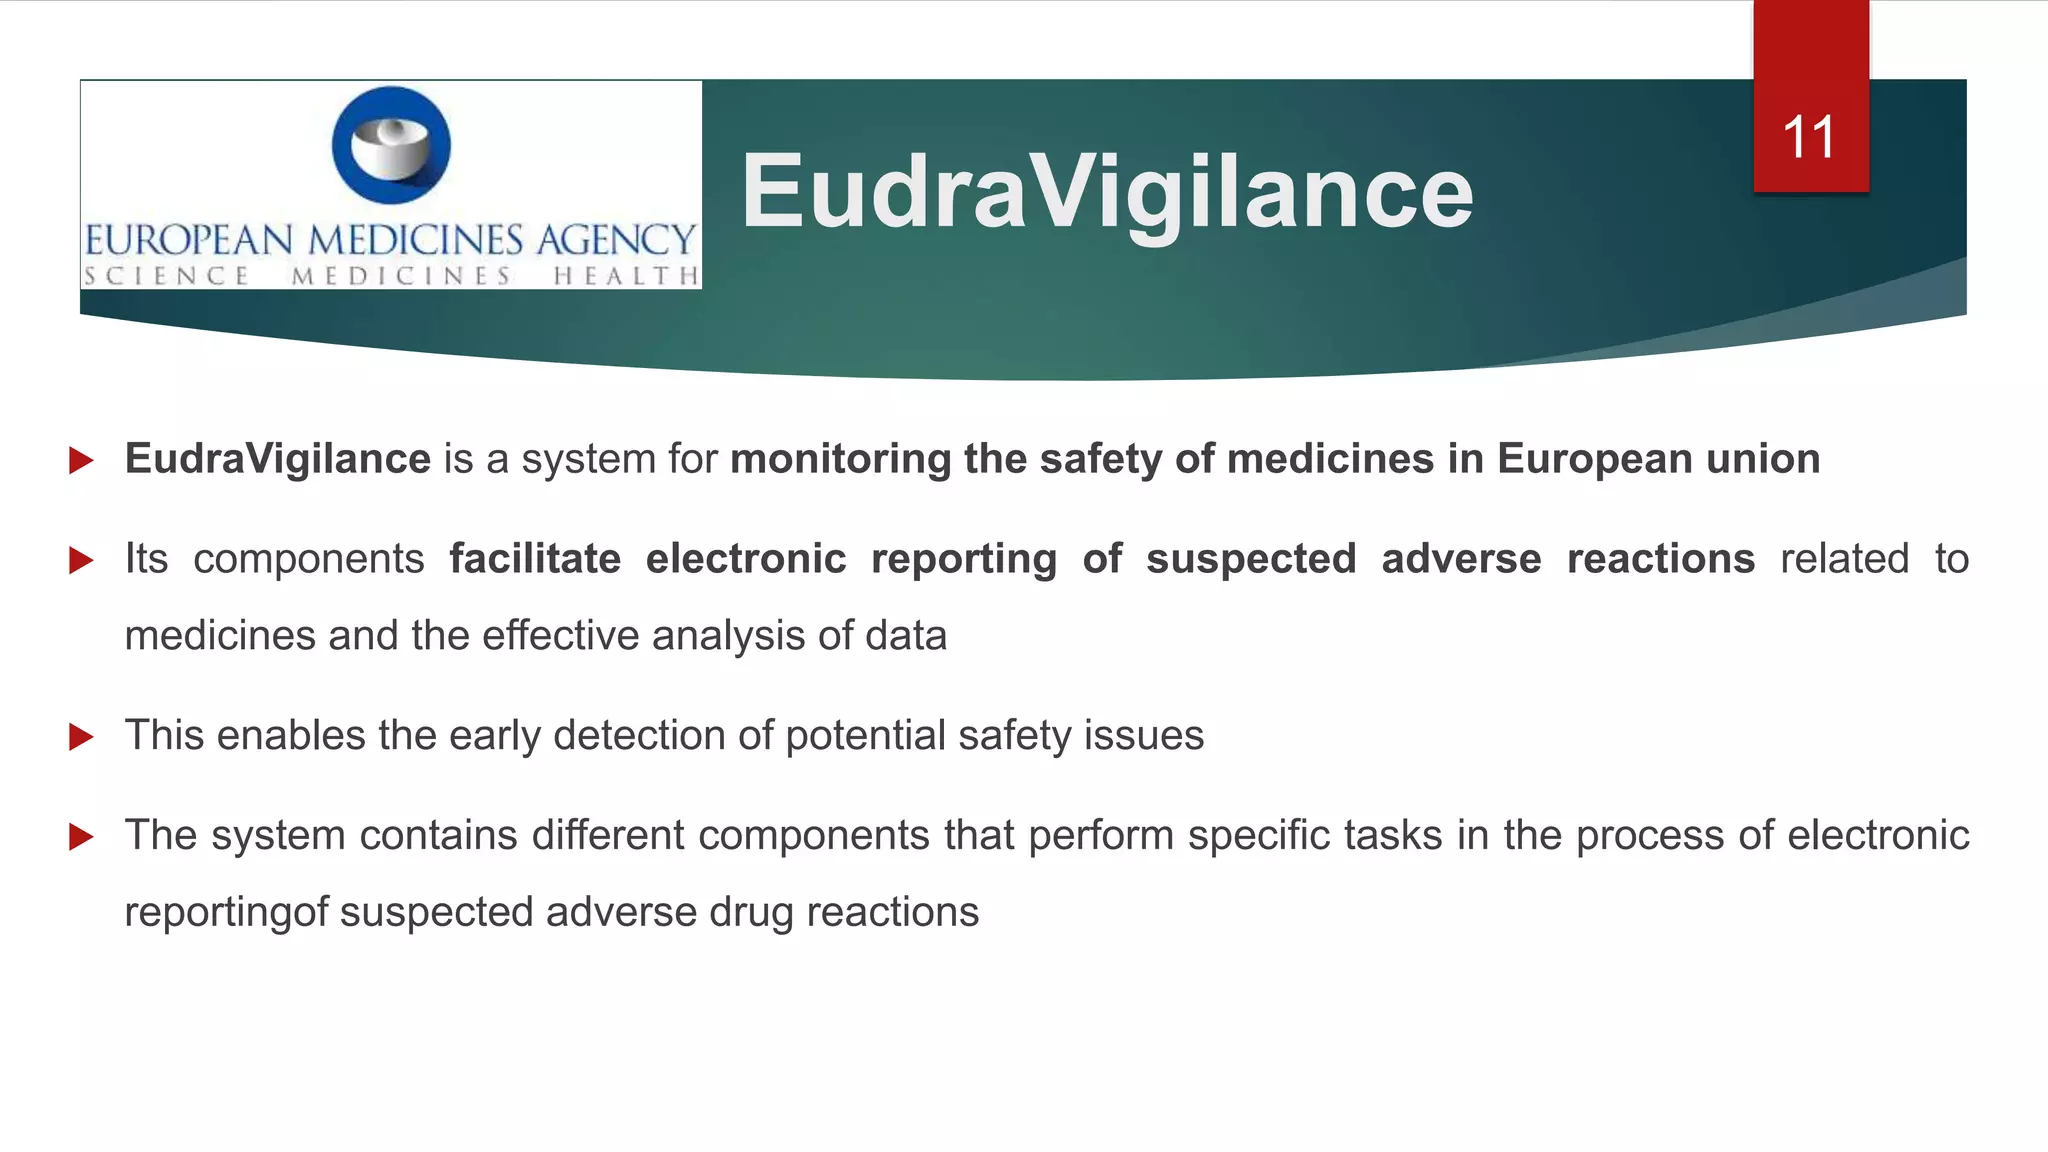
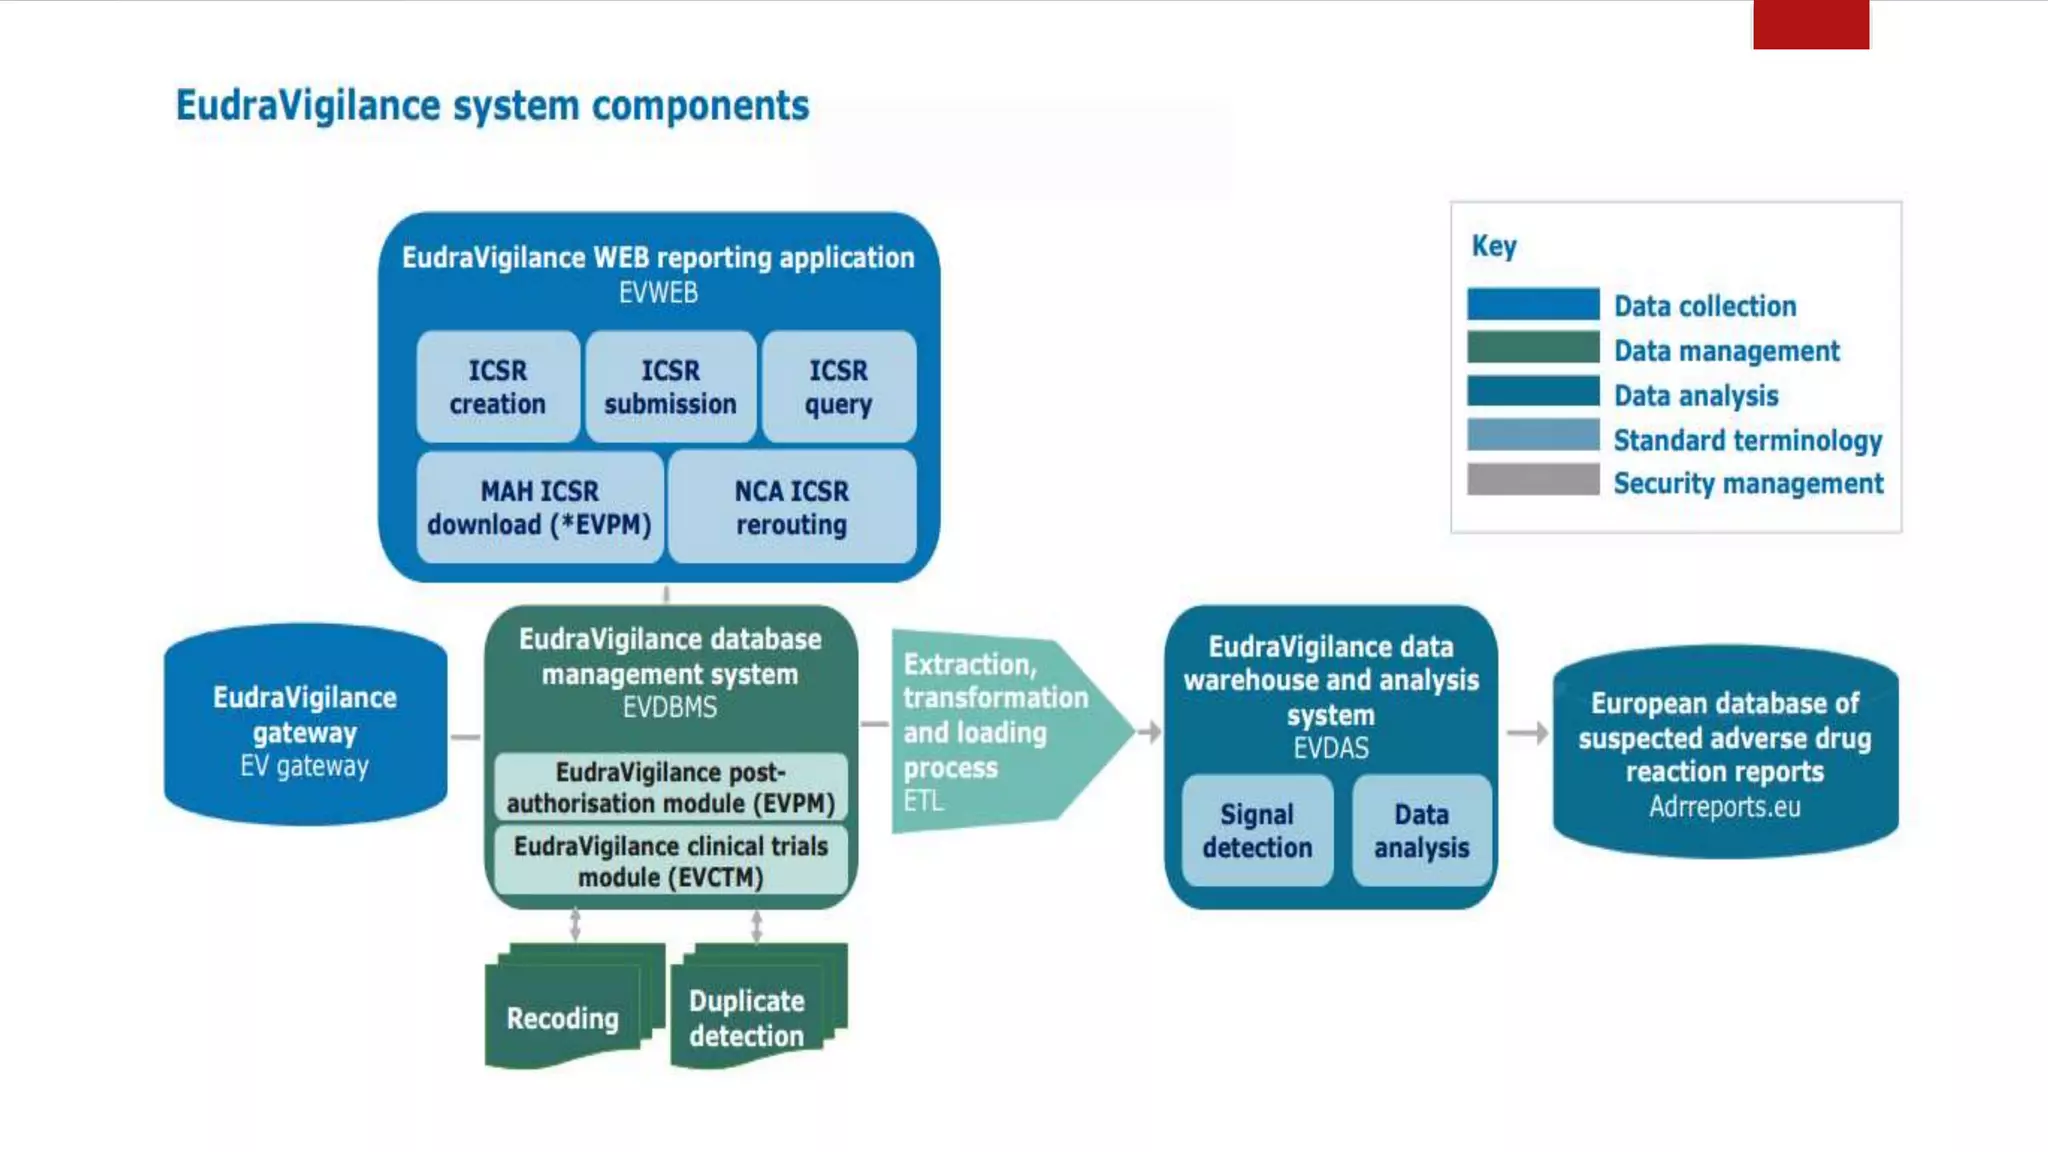
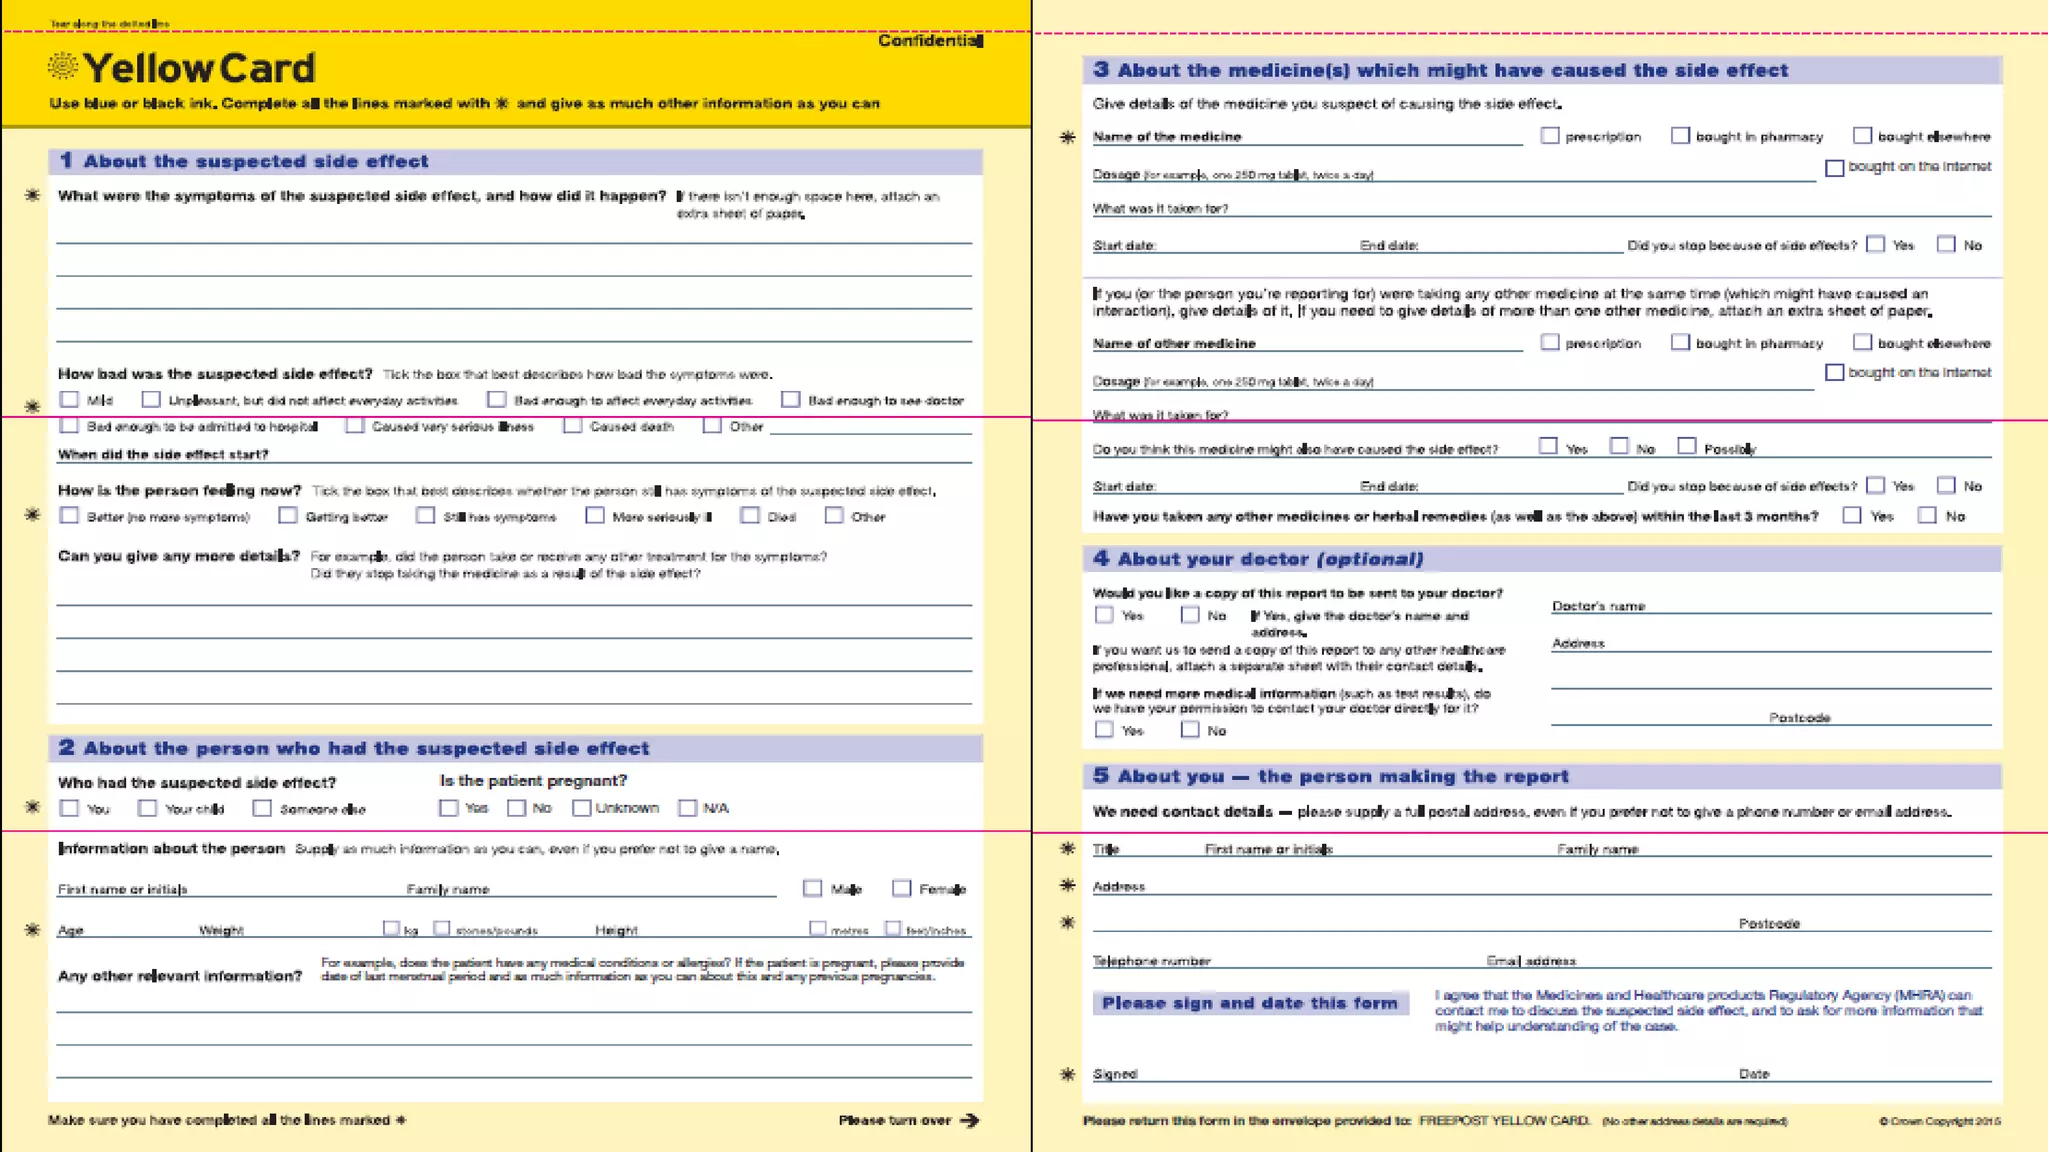
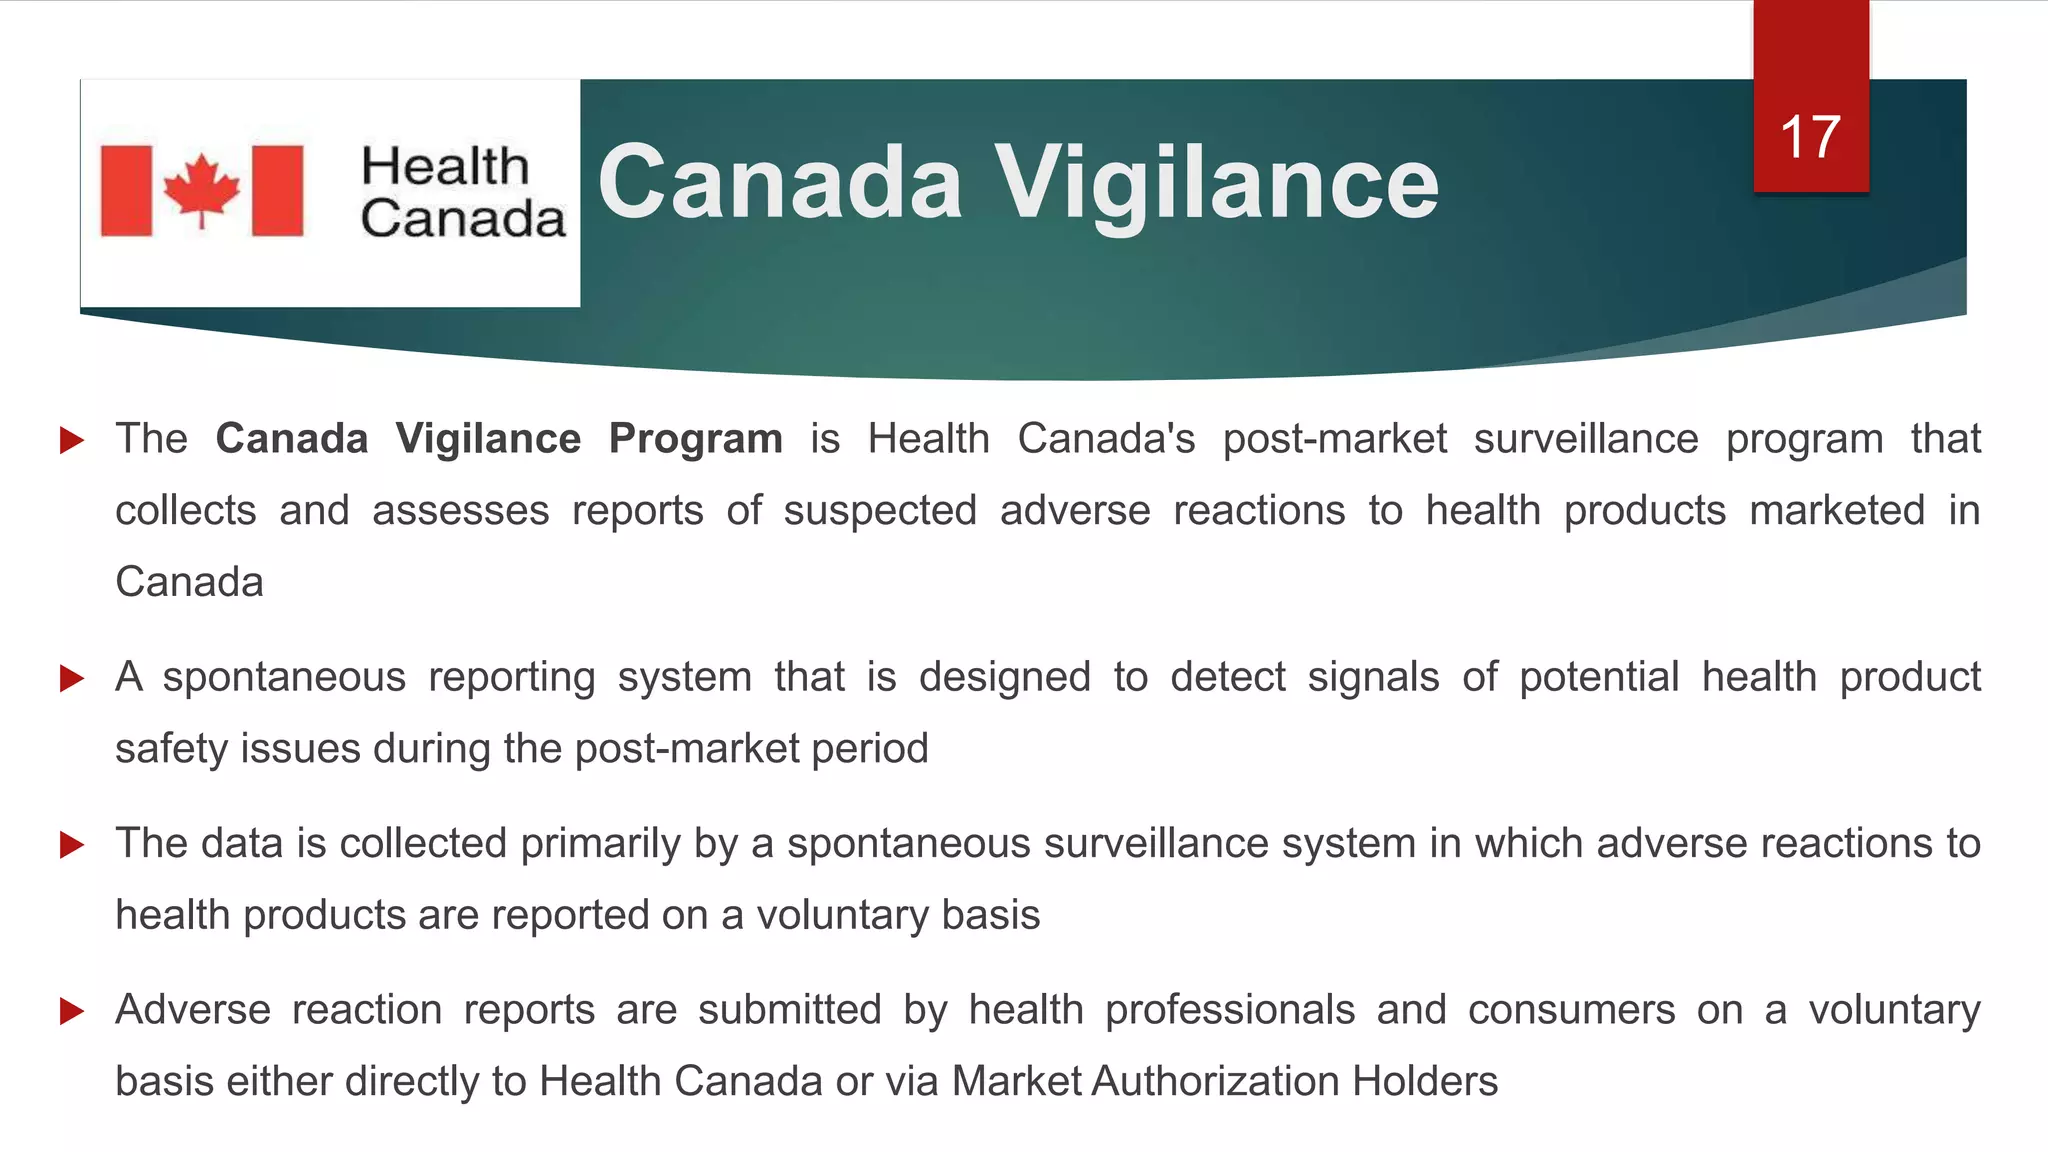
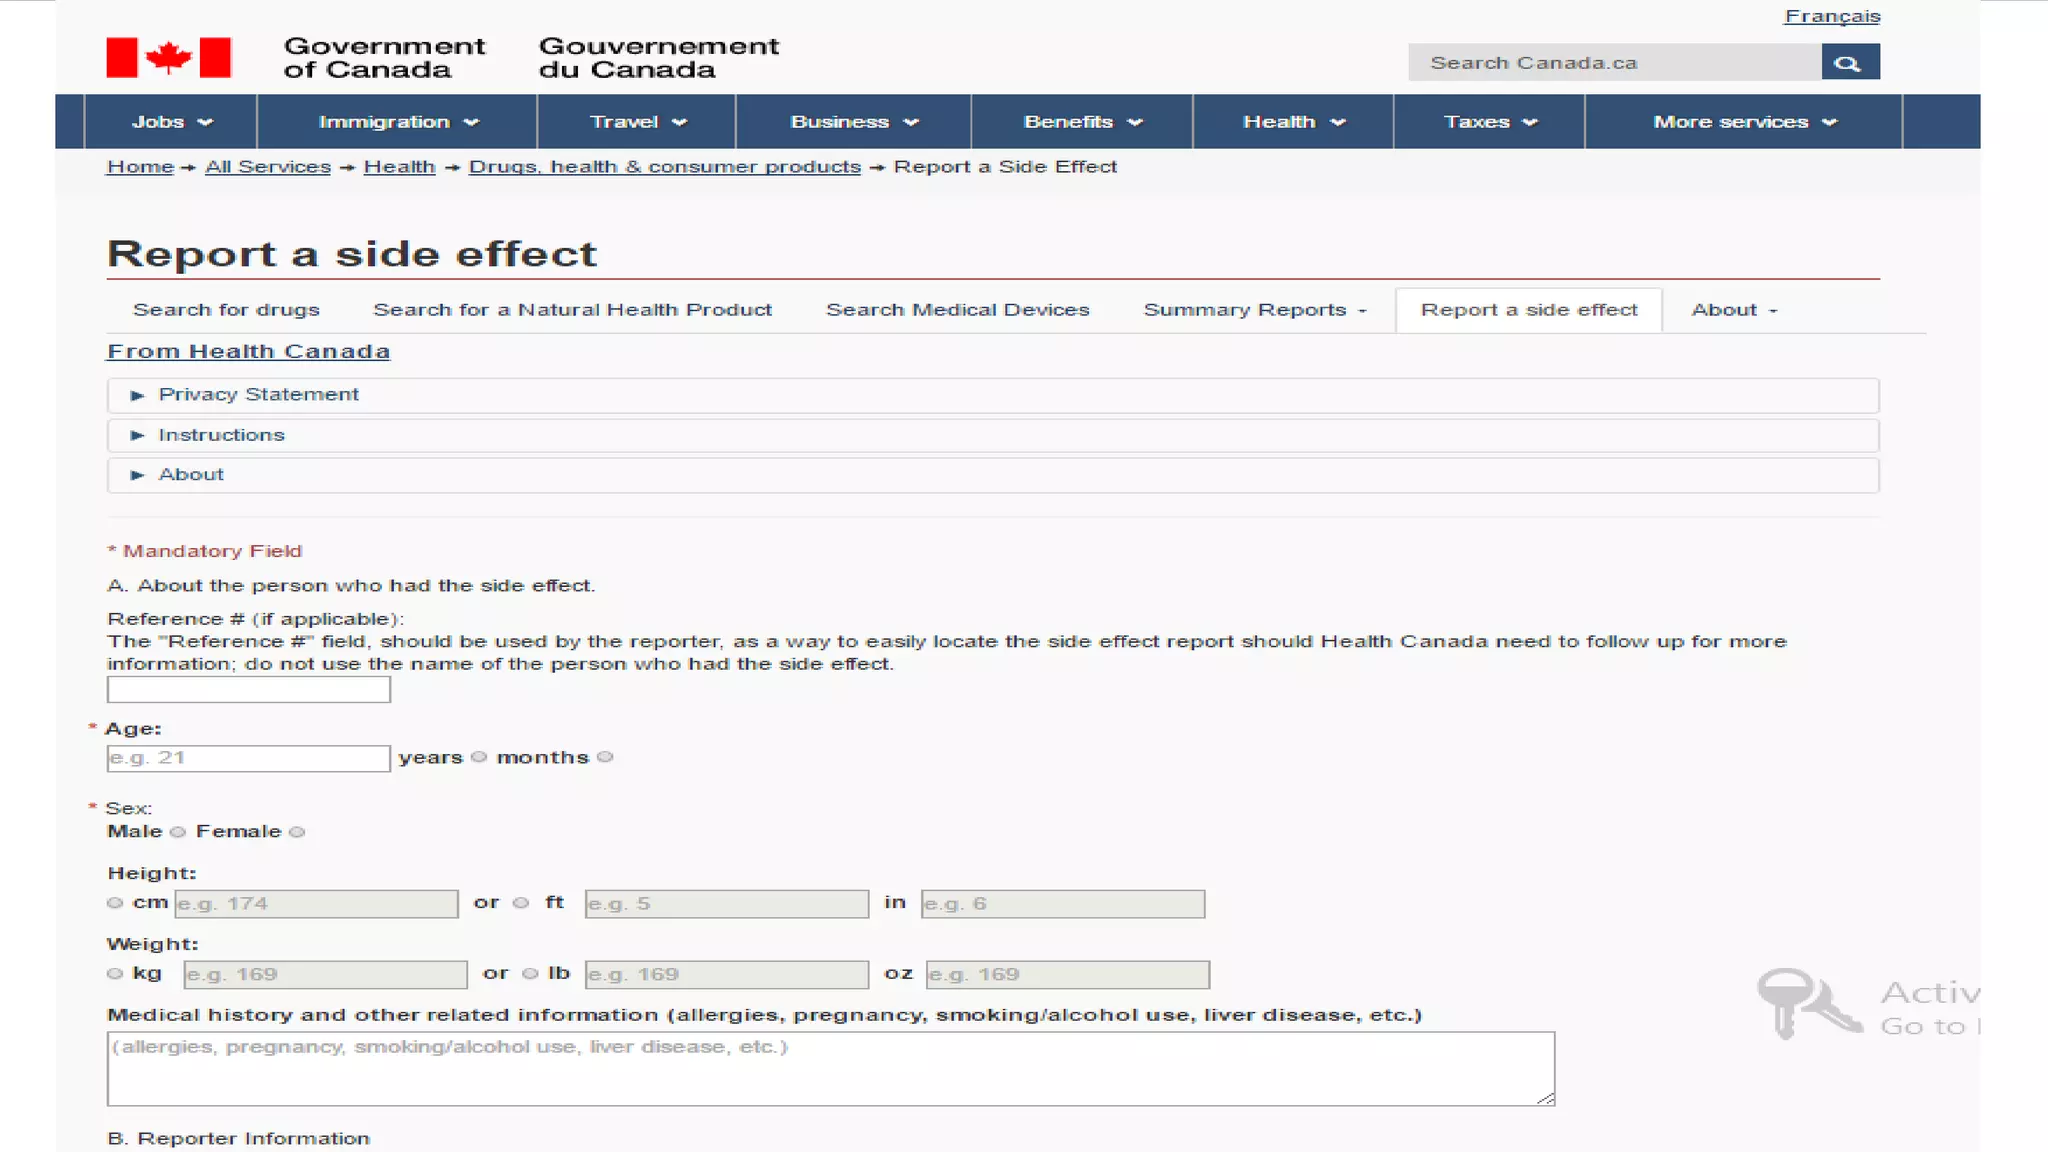
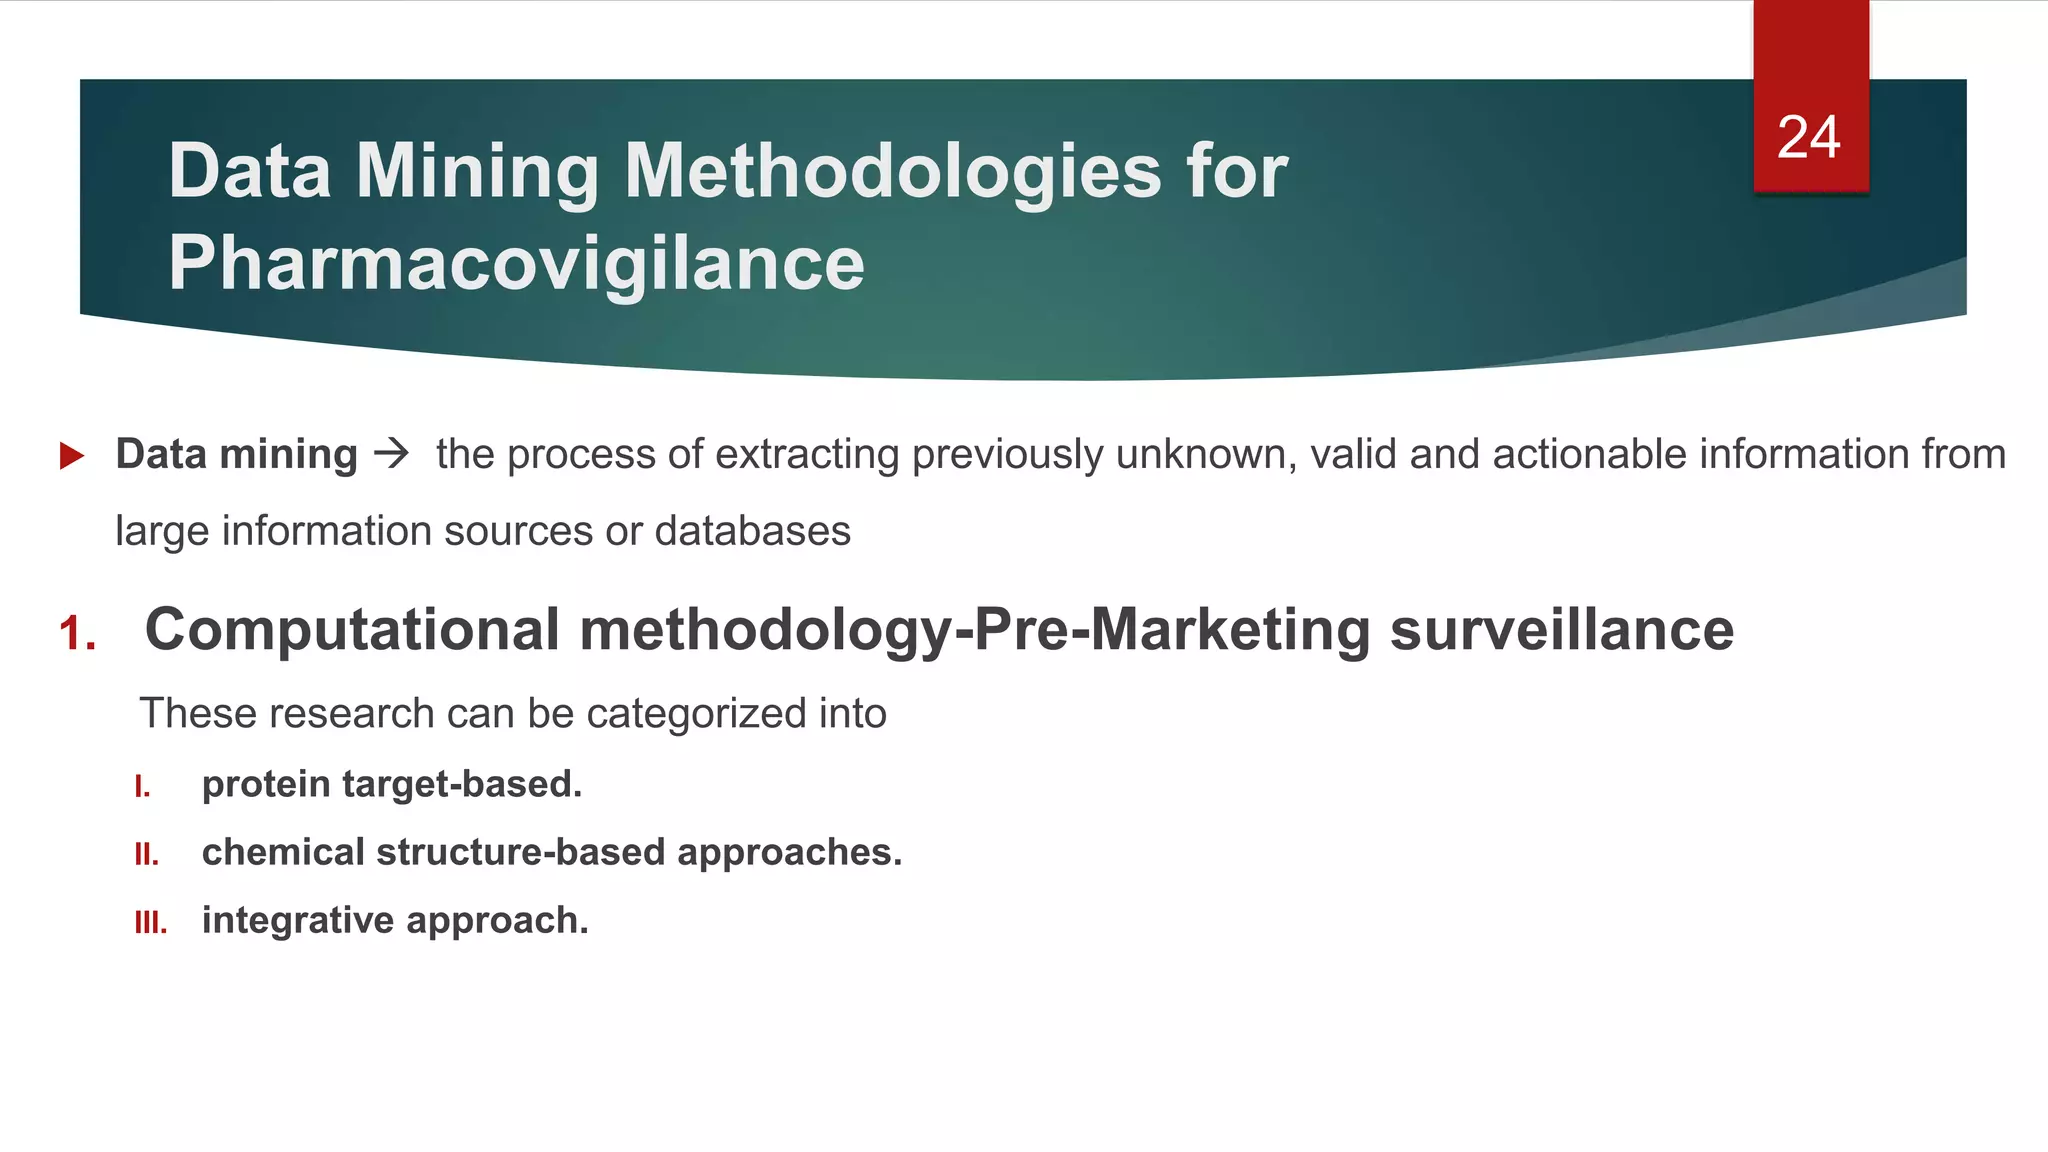
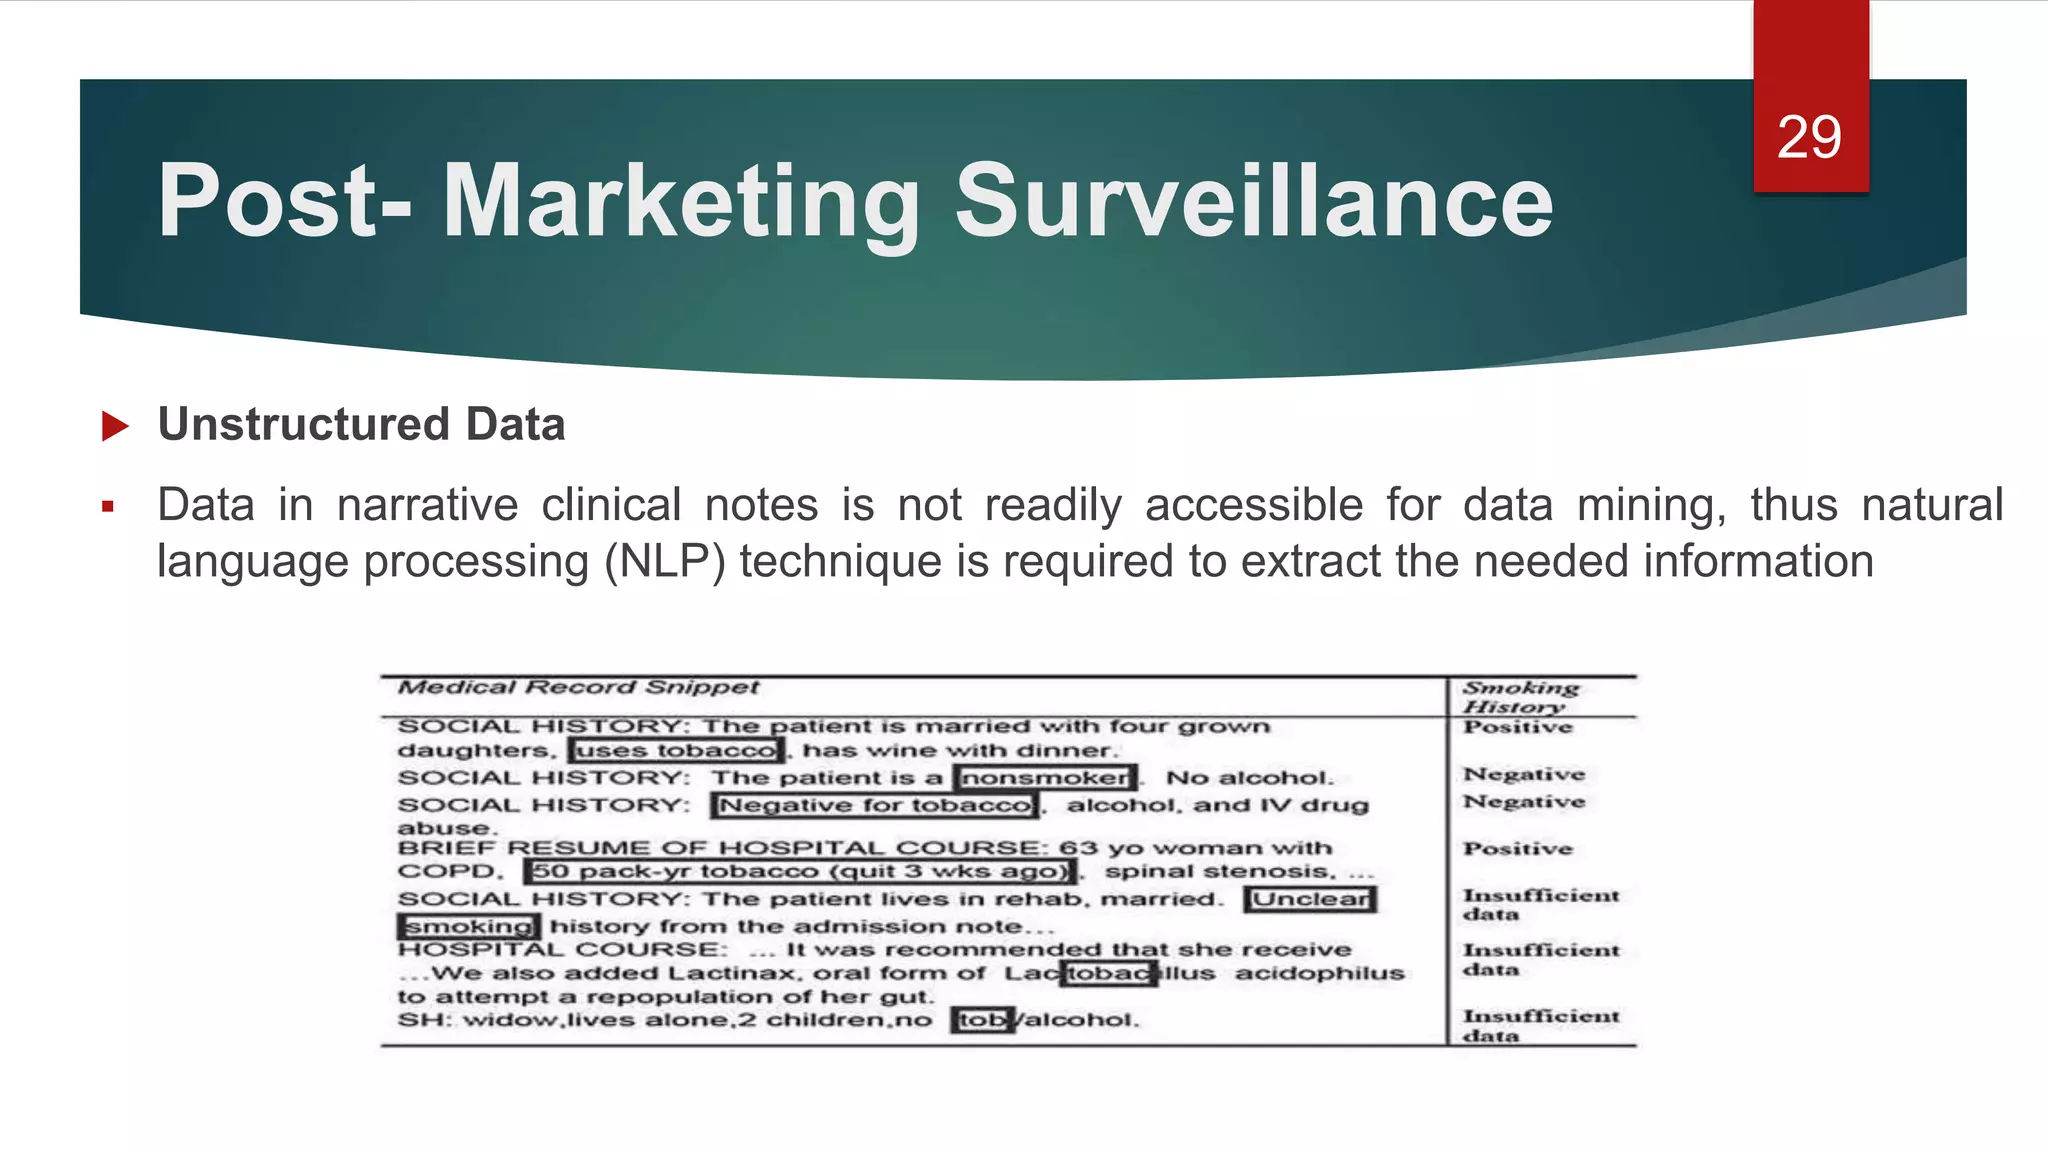
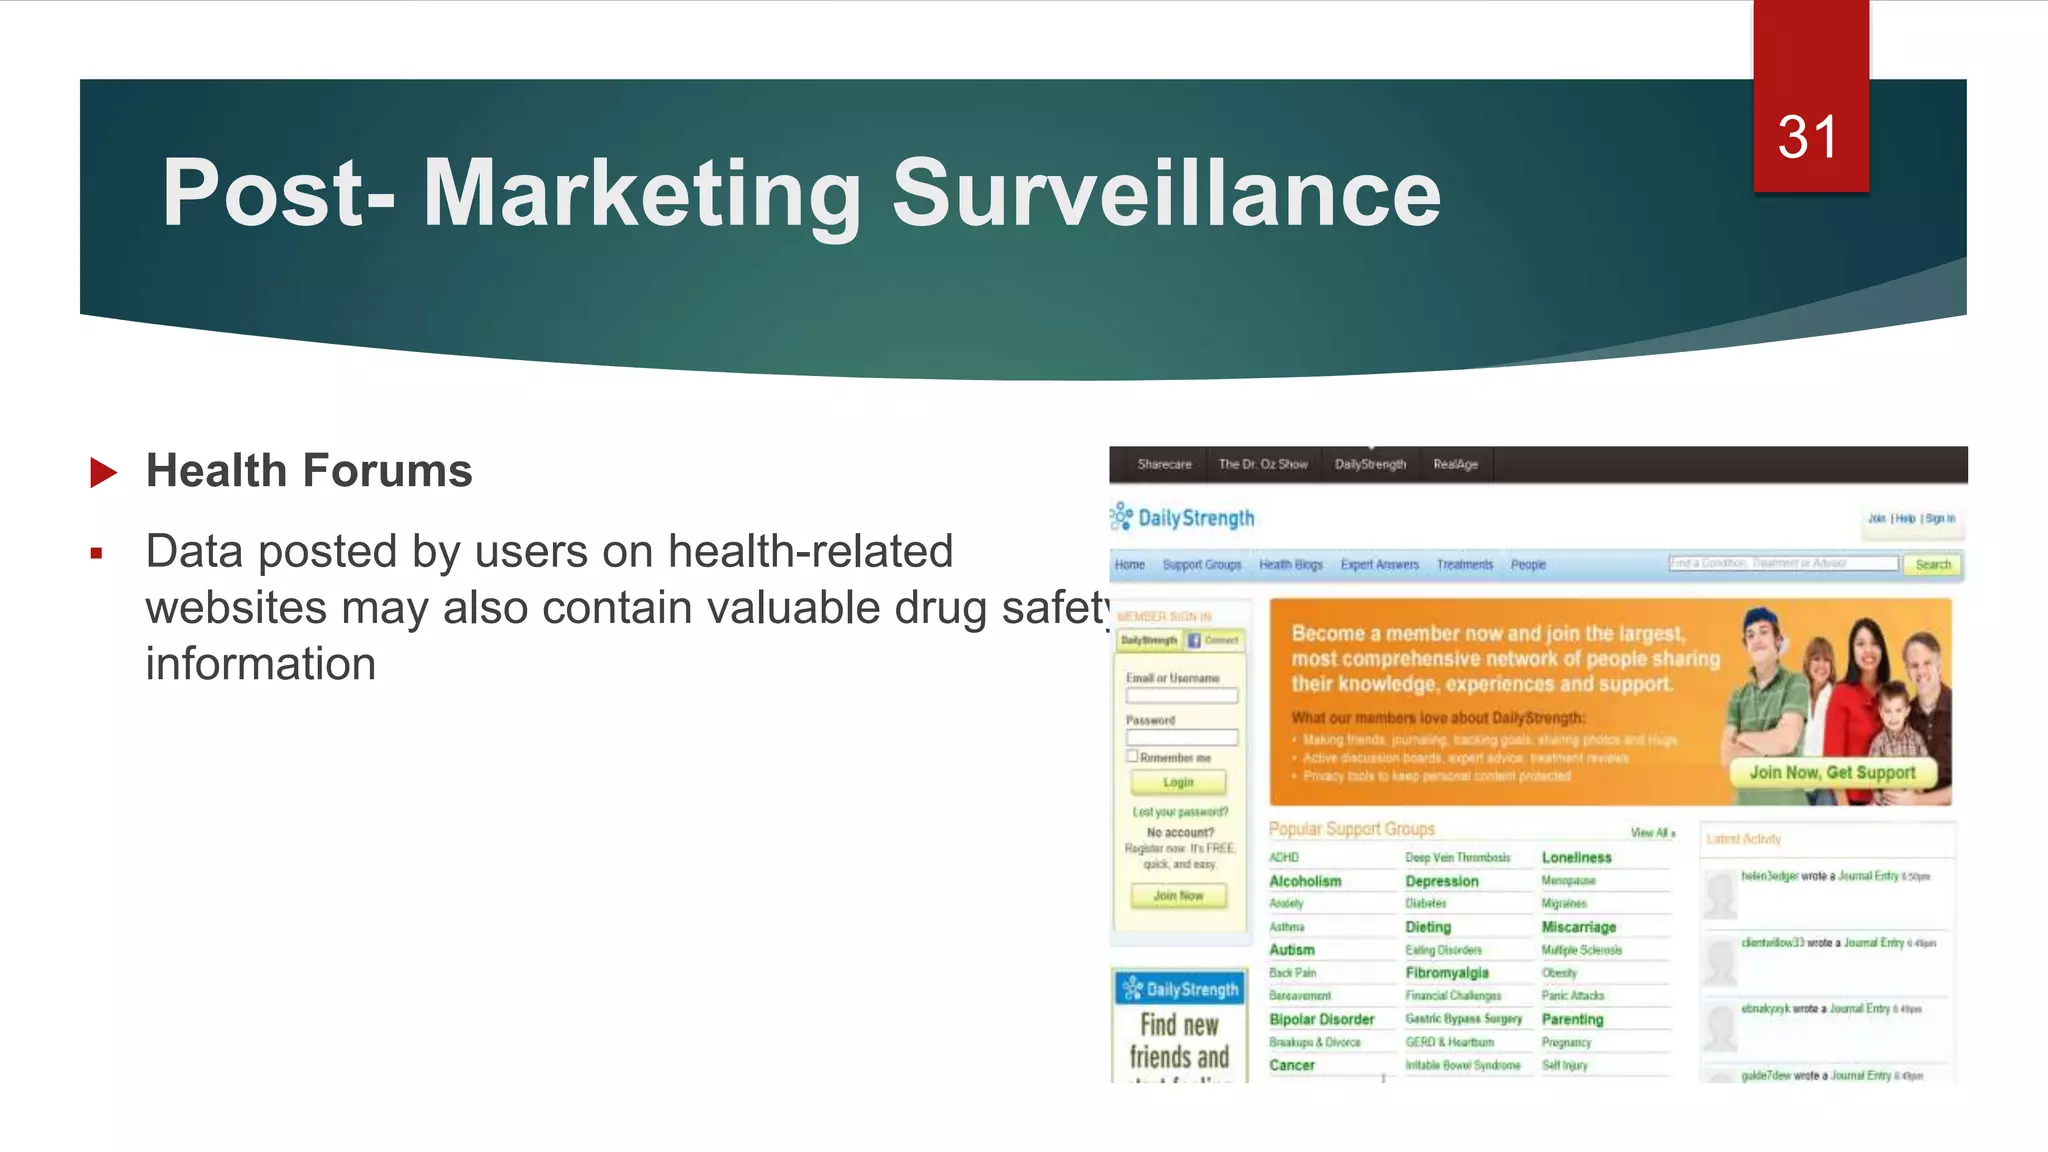
Pharmacovigilance:
Systems & Methodologies
Across The Globe
ILHAR HASHIM, M PHARM-CLINICAL RESEARCH
NATIONAL INSTITUTE OF PHARMACEUTICAL EDUCATION AND RESEARCH (NIPER), MOHALI, INDIA-160062
1
WHO- UMC- VigiBase- VigiFlow-
VigiLyze
 VigiBase is a World Health Organization’s (WHO) global Individual Case
Safety Report (ICSR) database
 Contains ICSRs submitted by the participating member states enrolled
under WHO’s international drug monitoring programme
 It is the single largest drug safety data repository in the world
 The Uppsala Monitoring Centre (UMC) on behalf of WHO, is maintaining
VigiBase
 Vigibase is used to obtain the information about a safety profile of a
medicinal product
2
WHO- UMC- VigiBase- VigiFlow-
VigiLyze
 These data are used by pharmaceutical industries, academic institutions and regulatory
authorities for statistical signal detection, updating periodic reports, ICSR comparisons with
company databases and studying the reporting patterns
 The data (pre-dominantly post-marketing serious and non-serious cases) is collected from each
of its 110 member states which currently comprises to over 10 million ICSRs
 About a hundred thousand ICSRs are added each year
 These submissions are in ICH -E2B standard for electronic transmission of ICSRs
3
WHO- UMC- VigiBase- VigiFlow-
VigiLyze
 It is mandatory for all the participating countries (125 members states and 28 associate
members) to submit ICSRs to UMC via its appointed national centre based in the respective
member states
 These reports are usually sent to the respective national centre by marketing authorization
holders, health care professionals (HCP), consumers or any regional centre
4
WHO- UMC- VigiBase- VigiFlow-
VigiLyze
 UMC in collaboration with ‘’Swissmedic’’ has developed ‘’VigiFlow’’, a web-based ICSR management system
 VigiFlow functions as a national ICSR database management system and analysis tool, through which
cases are sent to UMC
 VigiFlow supports the collection, processing and sharing of data of ICSRs to facilitate effective data
analysis
 VigiLyze is an online resource that delivers useful search and analysis functions and provides a quick and
clear overview of VigiBase
5
6
7
FAERS- MedWatch
 The FDA Adverse Event Reporting System (FAERS) is a database that contains information on
adverse event and medication error reports submitted to FDA
 The database is designed to support the FDA's post-marketing safety surveillance program
for drug and therapeutic biologic products
 The informatic structure of the FAERS database adheres to the international safety reporting
guidance issued by the International Conference on Harmonization (ICH E2B)
 Adverse events and medication errors are coded to terms in the Medical Dictionary for
Regulatory Activities (MedDRA) terminology
8
 It contains adverse drug reaction reports FDA has received from manufacturers, health
proffessionals & consumers/patients as required by regulation &/or voluntarily
 MedWatch is the Food and Drug Administration’s Safety Information and Adverse Event
Reporting Program
 MedWatch is used for reporting an adverse event or sentinel event
 Voluntary reporting by healthcare professionals, consumers, and patients is conducted on a
single, one-page reporting form- Form FDA 3500
9
FAERS- MedWatch 9
10
EudraVigilance
 EudraVigilance is a system for monitoring the safety of medicines in European union
 Its components facilitate electronic reporting of suspected adverse reactions related to
medicines and the effective analysis of data
 This enables the early detection of potential safety issues
 The system contains different components that perform specific tasks in the process of electronic
reportingof suspected adverse drug reactions
11
1212
EudraVigilance
13
 The EudraVigilance gateway supports the electronic data interchange (EDI) process, which is
based on the secure electronic exchange of safety messages between a sender and a receiver
 The safety messages contain individual case safety reports(ICSRs)
 The EudraVigilance web application (EVWEB) is the interface to the EudraVigilance database
management system (EDBMS) and allows registered users to create, send and view ICSRs,
safety and acknowledgement messages
 EVWEB also enables users to perform queries
EudraVigilance
14
 Marketing authorisation holders and sponsors of clinical trials must report and evaluate
suspected adverse drug reactions during the development and following the marketing
authorization of medicinal products in the European Economic Area (EEA)
 Marketing authorisation holders must also electronically submit information on medicinal
products authorised in the European Union (EU)
Yellow Card Scheme
 The Yellow Card Scheme is the UK system for collecting information on suspected adverse drug
reactions (ADRs) to medicines. The scheme allows the safety of the medicines and vaccines that
are on the market to be monitored
 It is run by the Medicines and Healthcare Products Regulatory Agency (MHRA) and
the Commission on Human Medicines (CHM).
 Suspected ADRs are collected on all licensed medicines and vaccines, from those issued on
prescription to medicines bought over the counter from a pharmacist or supermarket
 Yellow Cards are available from pharmacies and a few are presented near the back of the BNF
as tear-off pages
15
16
Canada Vigilance
 The Canada Vigilance Program is Health Canada's post-market surveillance program that
collects and assesses reports of suspected adverse reactions to health products marketed in
Canada
 A spontaneous reporting system that is designed to detect signals of potential health product
safety issues during the post-market period
 The data is collected primarily by a spontaneous surveillance system in which adverse reactions to
health products are reported on a voluntary basis
 Adverse reaction reports are submitted by health professionals and consumers on a voluntary
basis either directly to Health Canada or via Market Authorization Holders
17
18
Blue card
 Blue card adverse reaction reporting form
 Form to report suspected adverse reactions to vaccines and prescription, over-the-counter and
complementary medicines in Australia
 Send completed Blue cards to the TGA
By mail to: Pharmacovigilance and Special Access Branch, Reply Paid 100,
Woden ACT 2606
19
20
Pharmacovigilance
programme of India (PvPI)
21
22
23
Data Mining Methodologies for
Pharmacovigilance
 Data mining  the process of extracting previously unknown, valid and actionable information from
large information sources or databases
1. Computational methodology-Pre-Marketing surveillance
These research can be categorized into
I. protein target-based.
II. chemical structure-based approaches.
III. integrative approach.
24
Protein Target-based Approach
 Drugs typically work by activating or inhibiting the function of a protein, which in turn results in
therapeutic benefits to a patient.
 Drugs with similar in vitro protein binding profiles tend to similar side-effects,
Chemical Structure-based Approach
 The chemical structure-based approach attempts to link ADRs to their chemical structures
25
Computational methodology-
Pre-Marketing surveillance
Computational methodology-
Pre-Marketing surveillance
Integrative Approach
 Huang et al. proposed a new computational framework to predict ADRs by integrating
systems biology data that include protein targets, protein-protein interaction network,
gene ontology (GO) annotation and reported side effects
 Recently, Liu et al. investigated the use of phenotypic information, together with chemical
and biological properties of drugs, to predict ADRs
26
Post- Marketing Surveillance
 Several unique data sources are available for post marketing PhV
1. Spontaneous Reports
 Spontaneous reporting systems (SRSs) have served as the core data-collection system for post-
marketing drug surveillance since 1960
 Some of the prominent SRSs are the Adverse Event Reporting System (AERS) maintained by the
US FDA and the VigiBase managed by the World Health Organization (WHO)
 Many post-marketing surveillance analyses are based on these reports voluntarily submitted to the
national SRSs, which include disproportionality analysis and data mining algorithms
27
Post- Marketing Surveillance
2. Electronic Medical Records
 Computerized medical record created in an organization that delivers care, EMRs contain not only
detailed patient information but also copious longitudinal clinical data
 EMR databases consist of data in two types formats:
 Structured (e.g., laboratory data)- Several groups have employed computational methods on
structured or coded data in EMRs to identify specific ADR signals
28
Post- Marketing Surveillance
 Unstructured Data
 Data in narrative clinical notes is not readily accessible for data mining, thus natural
language processing (NLP) technique is required to extract the needed information
29
Post- Marketing Surveillance
3. Non-conventional Data Sources
 Biomedical Literature
 Biomedical literature can be used as a
complementary resource for prioritizing drug-ADR
associations generated from SRSs
30
Post- Marketing Surveillance
 Health Forums
 Data posted by users on health-related
websites may also contain valuable drug safety
information
31
Data Analysis Techniques in PV
 Disproportionality Analysis (DPA)
 It involves frequency analyses of 2x2 contingency tables to quantify the degree to which a drug and
ADR co-occurs “disproportionally” compared with what would be expected if there were no association
 Many approaches are applied, the straight forward method is the calculation of frequentist metrics
 Relative Reporting Ratio (RRR), Proportional Reporting Ratio (PRR), Reporting Odds Ratio
(ROR)
 DPA methods are effective in detecting single Drug-ADR associations
32
Data Analysis Techniques in PV
 For bayesian approach, algorithms are more complex, such as Gamma-poisson shrinker (GPS)
and the Multi-item gamma-poisson shrinker (MGPS) providing Empirical bayesian geometric
mean (EBGM) score
 Information component (IC) score of Bayesian confidence propagation neural network
(BCPNN)
 Tatonetti et al applied the Bi clustering algorithm to identify drug groups that share a common set of ADRs
in SRS data
33
Data Analysis Techniques in PV
 Hazard identification
 Where a small group of pharmacists reviews all reports, identifies new hazards, and prioritizes them for
action. Recommendations are then disseminated to the participants (most hospitals) every two weeks via a
newsletter, Medication Safety Alert
 Summaries and descriptions
 A simple classification scheme can provide summaries and descriptions that permit determination of
frequencies or ranking by order of frequency
 An example of this would be a reporting system that records medication errors classified by dose, route, patient,
etc. Calculating frequencies permits prioritization that can be used by focused systems to allocate further
resources.
34
Data Analysis Techniques in PV
 Trend and cluster analysis
 Trend analysis, obtained by calculating and observing rates of events over time, can identify significant
changes that suggest new problems (or, if improving, that safety measures are working)
 Trends can also be detected using statistical control methodologies
 A cluster of events that suddenly arises suggests a need for inquiry
 Correlations
 An analysis of correlations to evaluate the strength of the relationship between two variables, such as
whether dosing errors occur more frequently among chemotherapy patients than among patients
undergoing other treatments
35
Data Analysis Techniques in PV
 Risk analysis
 With adequate data, a reporting system can develop valuable information about risk
 With a large number of reports, estimations of the probability of recurrence of a specific type of adverse
event or error can be calculated
 Analysis of reported outcomes can also produce an estimate of the average severity of harm caused by the
incident
 Causal analysis
 If causal factors such as workloads, communication, teamwork, equipment, environment, staffing and the like
are included, then correlations among many cause and effect relationships can yield important insights into
a health-care system’s vulnerabilities
36
Data Analysis Techniques in PV
 Systems analysis
 The ultimate aim of reporting is to lead to systems improvements by understanding the
systems failures that caused the error or injury
 At the organizational level, this requires investigation and interviews with involved parties to
elicit the contributing factors and underlying design failures
 A national reporting system must receive this level of information in order to identify common
and recurring systems failures
37
38

Pharmacovigilance systems & methodologies across the globe

  • 1.
    Pharmacovigilance: Systems & Methodologies AcrossThe Globe ILHAR HASHIM, M PHARM-CLINICAL RESEARCH NATIONAL INSTITUTE OF PHARMACEUTICAL EDUCATION AND RESEARCH (NIPER), MOHALI, INDIA-160062 1
  • 2.
    WHO- UMC- VigiBase-VigiFlow- VigiLyze  VigiBase is a World Health Organization’s (WHO) global Individual Case Safety Report (ICSR) database  Contains ICSRs submitted by the participating member states enrolled under WHO’s international drug monitoring programme  It is the single largest drug safety data repository in the world  The Uppsala Monitoring Centre (UMC) on behalf of WHO, is maintaining VigiBase  Vigibase is used to obtain the information about a safety profile of a medicinal product 2
  • 3.
    WHO- UMC- VigiBase-VigiFlow- VigiLyze  These data are used by pharmaceutical industries, academic institutions and regulatory authorities for statistical signal detection, updating periodic reports, ICSR comparisons with company databases and studying the reporting patterns  The data (pre-dominantly post-marketing serious and non-serious cases) is collected from each of its 110 member states which currently comprises to over 10 million ICSRs  About a hundred thousand ICSRs are added each year  These submissions are in ICH -E2B standard for electronic transmission of ICSRs 3
  • 4.
    WHO- UMC- VigiBase-VigiFlow- VigiLyze  It is mandatory for all the participating countries (125 members states and 28 associate members) to submit ICSRs to UMC via its appointed national centre based in the respective member states  These reports are usually sent to the respective national centre by marketing authorization holders, health care professionals (HCP), consumers or any regional centre 4
  • 5.
    WHO- UMC- VigiBase-VigiFlow- VigiLyze  UMC in collaboration with ‘’Swissmedic’’ has developed ‘’VigiFlow’’, a web-based ICSR management system  VigiFlow functions as a national ICSR database management system and analysis tool, through which cases are sent to UMC  VigiFlow supports the collection, processing and sharing of data of ICSRs to facilitate effective data analysis  VigiLyze is an online resource that delivers useful search and analysis functions and provides a quick and clear overview of VigiBase 5
  • 6.
  • 7.
  • 8.
    FAERS- MedWatch  TheFDA Adverse Event Reporting System (FAERS) is a database that contains information on adverse event and medication error reports submitted to FDA  The database is designed to support the FDA's post-marketing safety surveillance program for drug and therapeutic biologic products  The informatic structure of the FAERS database adheres to the international safety reporting guidance issued by the International Conference on Harmonization (ICH E2B)  Adverse events and medication errors are coded to terms in the Medical Dictionary for Regulatory Activities (MedDRA) terminology 8
  • 9.
     It containsadverse drug reaction reports FDA has received from manufacturers, health proffessionals & consumers/patients as required by regulation &/or voluntarily  MedWatch is the Food and Drug Administration’s Safety Information and Adverse Event Reporting Program  MedWatch is used for reporting an adverse event or sentinel event  Voluntary reporting by healthcare professionals, consumers, and patients is conducted on a single, one-page reporting form- Form FDA 3500 9 FAERS- MedWatch 9
  • 10.
  • 11.
    EudraVigilance  EudraVigilance isa system for monitoring the safety of medicines in European union  Its components facilitate electronic reporting of suspected adverse reactions related to medicines and the effective analysis of data  This enables the early detection of potential safety issues  The system contains different components that perform specific tasks in the process of electronic reportingof suspected adverse drug reactions 11
  • 12.
  • 13.
    EudraVigilance 13  The EudraVigilancegateway supports the electronic data interchange (EDI) process, which is based on the secure electronic exchange of safety messages between a sender and a receiver  The safety messages contain individual case safety reports(ICSRs)  The EudraVigilance web application (EVWEB) is the interface to the EudraVigilance database management system (EDBMS) and allows registered users to create, send and view ICSRs, safety and acknowledgement messages  EVWEB also enables users to perform queries
  • 14.
    EudraVigilance 14  Marketing authorisationholders and sponsors of clinical trials must report and evaluate suspected adverse drug reactions during the development and following the marketing authorization of medicinal products in the European Economic Area (EEA)  Marketing authorisation holders must also electronically submit information on medicinal products authorised in the European Union (EU)
  • 15.
    Yellow Card Scheme The Yellow Card Scheme is the UK system for collecting information on suspected adverse drug reactions (ADRs) to medicines. The scheme allows the safety of the medicines and vaccines that are on the market to be monitored  It is run by the Medicines and Healthcare Products Regulatory Agency (MHRA) and the Commission on Human Medicines (CHM).  Suspected ADRs are collected on all licensed medicines and vaccines, from those issued on prescription to medicines bought over the counter from a pharmacist or supermarket  Yellow Cards are available from pharmacies and a few are presented near the back of the BNF as tear-off pages 15
  • 16.
  • 17.
    Canada Vigilance  TheCanada Vigilance Program is Health Canada's post-market surveillance program that collects and assesses reports of suspected adverse reactions to health products marketed in Canada  A spontaneous reporting system that is designed to detect signals of potential health product safety issues during the post-market period  The data is collected primarily by a spontaneous surveillance system in which adverse reactions to health products are reported on a voluntary basis  Adverse reaction reports are submitted by health professionals and consumers on a voluntary basis either directly to Health Canada or via Market Authorization Holders 17
  • 18.
  • 19.
    Blue card  Bluecard adverse reaction reporting form  Form to report suspected adverse reactions to vaccines and prescription, over-the-counter and complementary medicines in Australia  Send completed Blue cards to the TGA By mail to: Pharmacovigilance and Special Access Branch, Reply Paid 100, Woden ACT 2606 19
  • 20.
  • 21.
  • 22.
  • 23.
  • 24.
    Data Mining Methodologiesfor Pharmacovigilance  Data mining  the process of extracting previously unknown, valid and actionable information from large information sources or databases 1. Computational methodology-Pre-Marketing surveillance These research can be categorized into I. protein target-based. II. chemical structure-based approaches. III. integrative approach. 24
  • 25.
    Protein Target-based Approach Drugs typically work by activating or inhibiting the function of a protein, which in turn results in therapeutic benefits to a patient.  Drugs with similar in vitro protein binding profiles tend to similar side-effects, Chemical Structure-based Approach  The chemical structure-based approach attempts to link ADRs to their chemical structures 25 Computational methodology- Pre-Marketing surveillance
  • 26.
    Computational methodology- Pre-Marketing surveillance IntegrativeApproach  Huang et al. proposed a new computational framework to predict ADRs by integrating systems biology data that include protein targets, protein-protein interaction network, gene ontology (GO) annotation and reported side effects  Recently, Liu et al. investigated the use of phenotypic information, together with chemical and biological properties of drugs, to predict ADRs 26
  • 27.
    Post- Marketing Surveillance Several unique data sources are available for post marketing PhV 1. Spontaneous Reports  Spontaneous reporting systems (SRSs) have served as the core data-collection system for post- marketing drug surveillance since 1960  Some of the prominent SRSs are the Adverse Event Reporting System (AERS) maintained by the US FDA and the VigiBase managed by the World Health Organization (WHO)  Many post-marketing surveillance analyses are based on these reports voluntarily submitted to the national SRSs, which include disproportionality analysis and data mining algorithms 27
  • 28.
    Post- Marketing Surveillance 2.Electronic Medical Records  Computerized medical record created in an organization that delivers care, EMRs contain not only detailed patient information but also copious longitudinal clinical data  EMR databases consist of data in two types formats:  Structured (e.g., laboratory data)- Several groups have employed computational methods on structured or coded data in EMRs to identify specific ADR signals 28
  • 29.
    Post- Marketing Surveillance Unstructured Data  Data in narrative clinical notes is not readily accessible for data mining, thus natural language processing (NLP) technique is required to extract the needed information 29
  • 30.
    Post- Marketing Surveillance 3.Non-conventional Data Sources  Biomedical Literature  Biomedical literature can be used as a complementary resource for prioritizing drug-ADR associations generated from SRSs 30
  • 31.
    Post- Marketing Surveillance Health Forums  Data posted by users on health-related websites may also contain valuable drug safety information 31
  • 32.
    Data Analysis Techniquesin PV  Disproportionality Analysis (DPA)  It involves frequency analyses of 2x2 contingency tables to quantify the degree to which a drug and ADR co-occurs “disproportionally” compared with what would be expected if there were no association  Many approaches are applied, the straight forward method is the calculation of frequentist metrics  Relative Reporting Ratio (RRR), Proportional Reporting Ratio (PRR), Reporting Odds Ratio (ROR)  DPA methods are effective in detecting single Drug-ADR associations 32
  • 33.
    Data Analysis Techniquesin PV  For bayesian approach, algorithms are more complex, such as Gamma-poisson shrinker (GPS) and the Multi-item gamma-poisson shrinker (MGPS) providing Empirical bayesian geometric mean (EBGM) score  Information component (IC) score of Bayesian confidence propagation neural network (BCPNN)  Tatonetti et al applied the Bi clustering algorithm to identify drug groups that share a common set of ADRs in SRS data 33
  • 34.
    Data Analysis Techniquesin PV  Hazard identification  Where a small group of pharmacists reviews all reports, identifies new hazards, and prioritizes them for action. Recommendations are then disseminated to the participants (most hospitals) every two weeks via a newsletter, Medication Safety Alert  Summaries and descriptions  A simple classification scheme can provide summaries and descriptions that permit determination of frequencies or ranking by order of frequency  An example of this would be a reporting system that records medication errors classified by dose, route, patient, etc. Calculating frequencies permits prioritization that can be used by focused systems to allocate further resources. 34
  • 35.
    Data Analysis Techniquesin PV  Trend and cluster analysis  Trend analysis, obtained by calculating and observing rates of events over time, can identify significant changes that suggest new problems (or, if improving, that safety measures are working)  Trends can also be detected using statistical control methodologies  A cluster of events that suddenly arises suggests a need for inquiry  Correlations  An analysis of correlations to evaluate the strength of the relationship between two variables, such as whether dosing errors occur more frequently among chemotherapy patients than among patients undergoing other treatments 35
  • 36.
    Data Analysis Techniquesin PV  Risk analysis  With adequate data, a reporting system can develop valuable information about risk  With a large number of reports, estimations of the probability of recurrence of a specific type of adverse event or error can be calculated  Analysis of reported outcomes can also produce an estimate of the average severity of harm caused by the incident  Causal analysis  If causal factors such as workloads, communication, teamwork, equipment, environment, staffing and the like are included, then correlations among many cause and effect relationships can yield important insights into a health-care system’s vulnerabilities 36
  • 37.
    Data Analysis Techniquesin PV  Systems analysis  The ultimate aim of reporting is to lead to systems improvements by understanding the systems failures that caused the error or injury  At the organizational level, this requires investigation and interviews with involved parties to elicit the contributing factors and underlying design failures  A national reporting system must receive this level of information in order to identify common and recurring systems failures 37
  • 38.