Downloaded 27 times


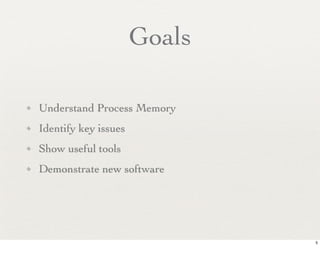
![Ouch!
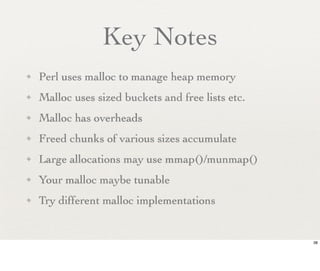
$ perl some_script.pl
Out of memory!
$
$ perl some_script.pl
Killed.
$
$ perl some_script.pl
$
Someone shouts: "Hey! My process has been killed!"
$ perl some_script.pl
[...later...] "Umm, what's taking so long?"
6
Have you experienced one of these?](https://image.slidesharecdn.com/perlmemory-yapcasia-2012-120928040504-phpapp01/85/Perl-Memory-Use-201209-6-320.jpg)
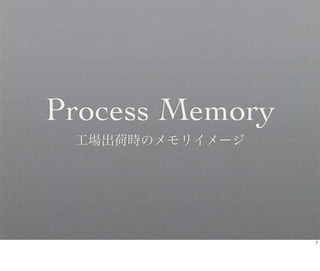

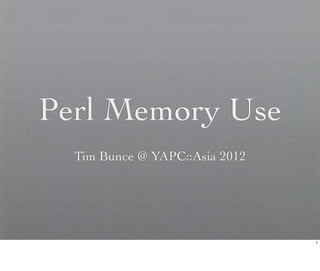
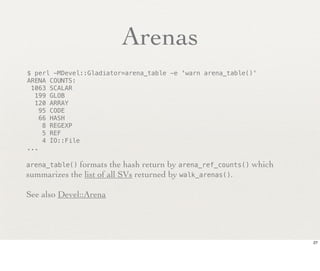
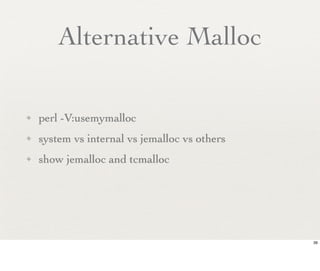
![$ perl -e 'system("cat /proc/$$/maps")'
address perms ... pathname
00400000-00401000 r-xp ... /.../perl-5.NN.N/bin/perl
00601000-00602000 rw-p ... /.../perl-5.NN.N/bin/perl
0087f000-008c1000 rw-p ... [heap]
7f858cba1000-7f8592a32000 r--p ... /usr/lib/locale/locale-archive-rpm
7f8592c94000-7f8592e1a000 r-xp ... /lib64/libc-2.12.so
7f8592e1a000-7f859301a000 ---p ... /lib64/libc-2.12.so
7f859301a000-7f859301e000 r--p ... /lib64/libc-2.12.so
7f859301e000-7f859301f000 rw-p ... /lib64/libc-2.12.so
7f859301f000-7f8593024000 rw-p ...
...other libs...
7f8593d1b000-7f8593e7c000 r-xp ... /.../lib/5.NN.N/x86_64-linux/CORE/libperl.so
7f8593e7c000-7f859407c000 ---p ... /.../lib/5.NN.N/x86_64-linux/CORE/libperl.so
7f859407c000-7f8594085000 rw-p ... /.../lib/5.NN.N/x86_64-linux/CORE/libperl.so
7f85942a6000-7f85942a7000 rw-p ...
7fff61284000-7fff6129a000 rw-p ... [stack]
7fff613fe000-7fff61400000 r-xp ... [vdso]
ffffffffff600000-ffffffffff601000 r-xp ... [vsyscall]
10
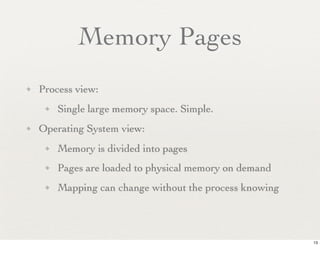
/proc/$$/maps has more detail. One line per ‘segment’.
Permissions indicate code (x) vs read-only data (r) vs writable-data/stack/heap (rw).](https://image.slidesharecdn.com/perlmemory-yapcasia-2012-120928040504-phpapp01/85/Perl-Memory-Use-201209-10-320.jpg)

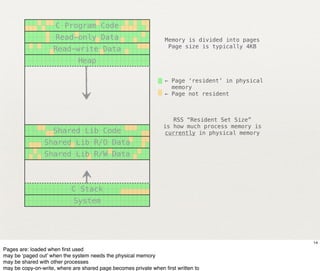
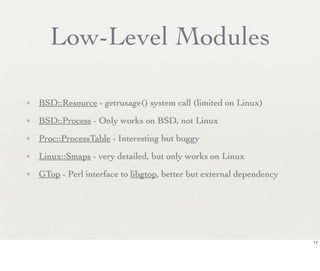


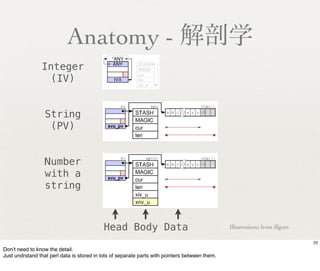
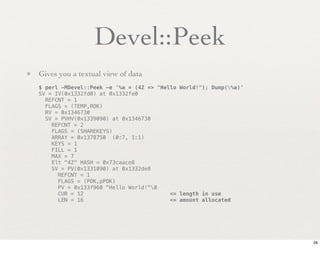
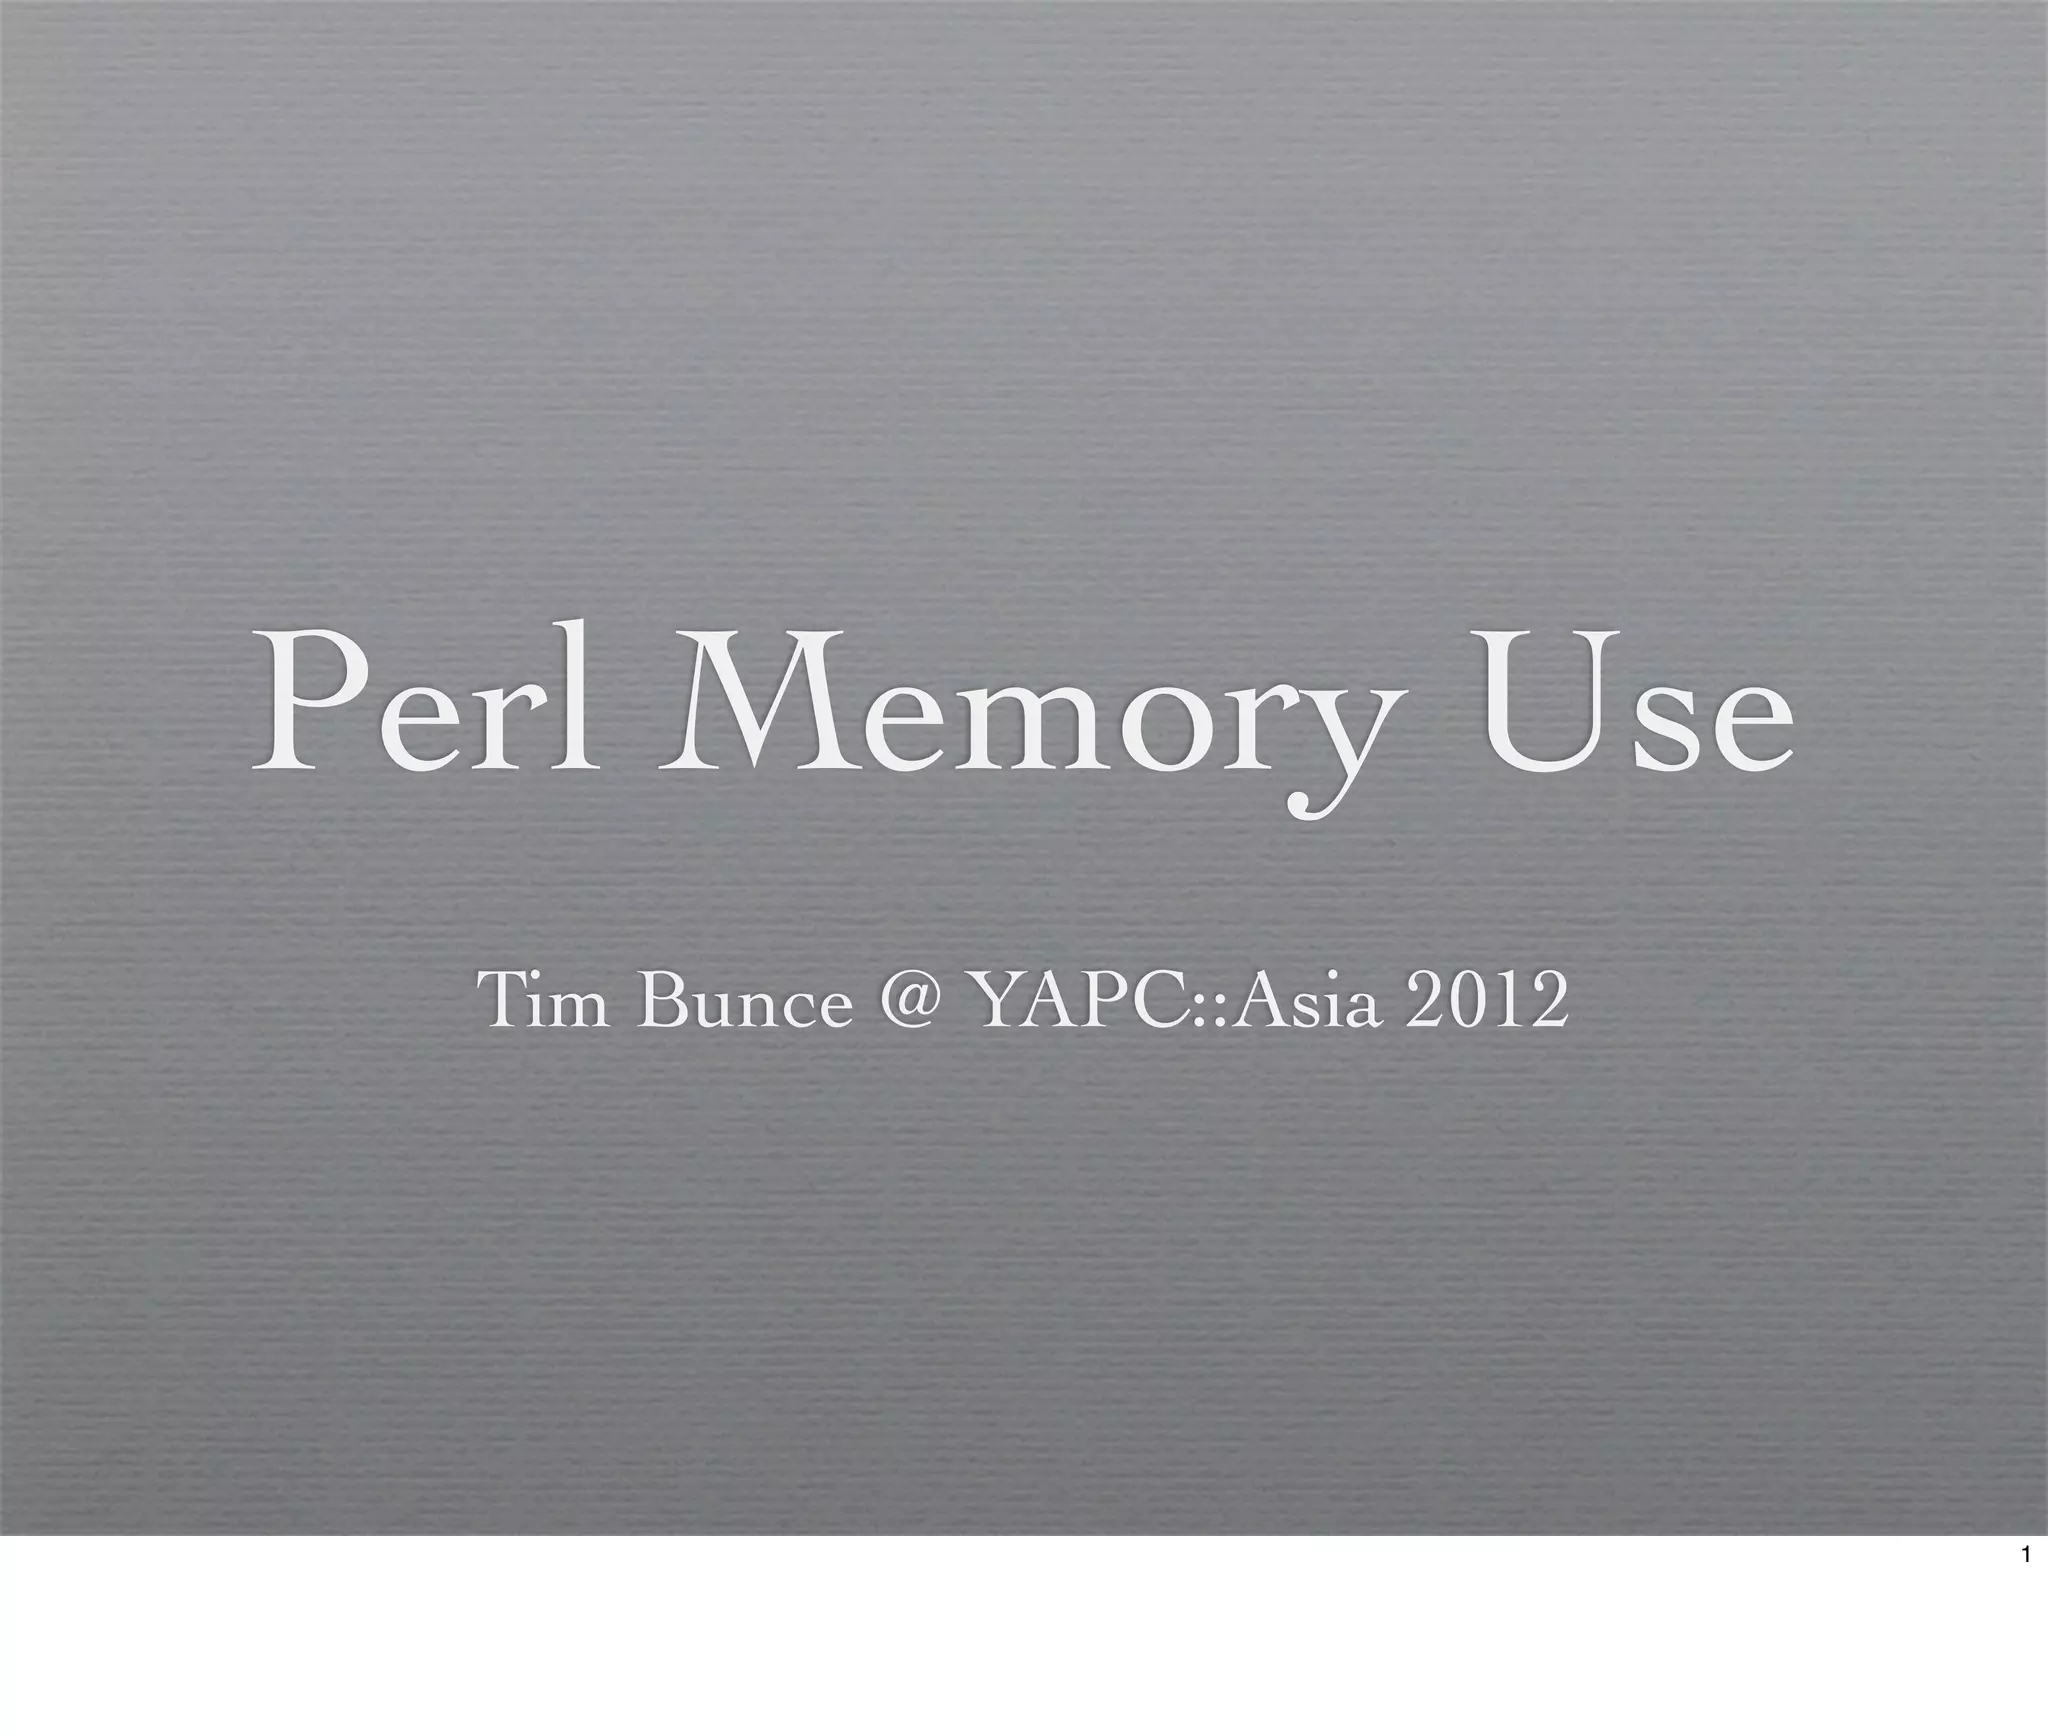
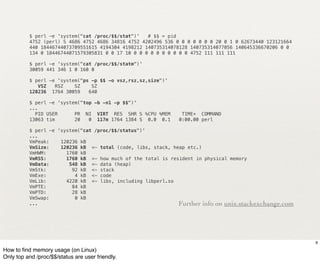
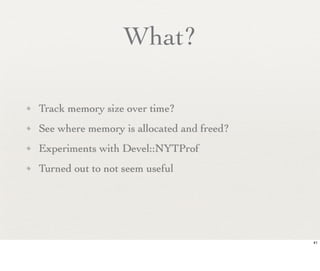
![Devel::Size
• Gives you a measure of the size of a data structure
$ perl -MDevel::Size=total_size -le 'print total_size( 0 )'
24
$ perl -MDevel::Size=total_size -le 'print total_size( [] )'
64
$ perl -MDevel::Size=total_size -le 'print total_size( {} )'
120
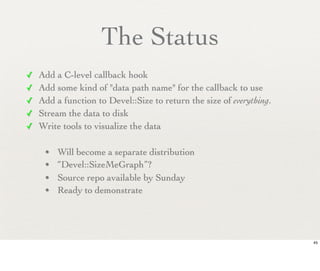
$ perl -MDevel::Size=total_size -le 'print total_size( [ 1..100 ] )'
3264
• Is very fast, and accurate for most simple data types.
• Has limitations and bugs, but is the best tool we have.
29
Makes somewhat arbitrary decisions about what to include for non-data types
Doesn't or can't accurately measure subs, forms, regexes, and IOs.
Can't measure 'everything' (total_size(%main::) is the best v0.77 can do)](https://image.slidesharecdn.com/perlmemory-yapcasia-2012-120928040504-phpapp01/85/Perl-Memory-Use-201209-29-320.jpg)
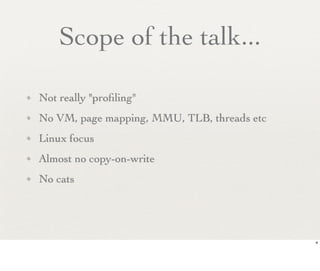
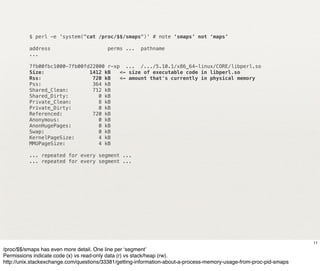
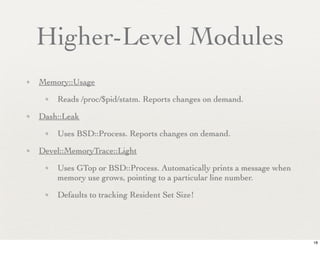
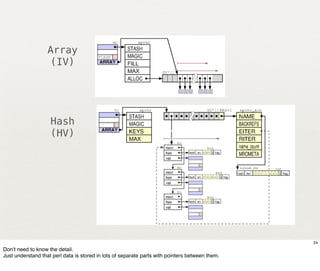
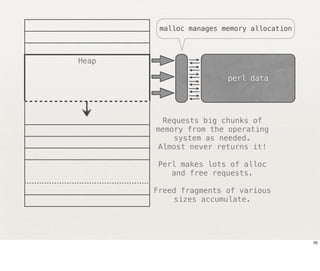
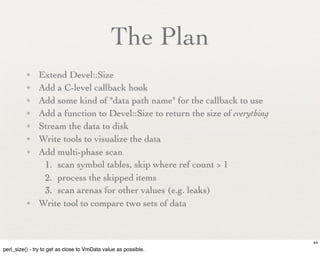
![Devel::Size 0.77
perl -MDevel::Size=total_size -we '
sub foo { my $var = "#" x 2**20; foo($_[0]-1) if $_[0]; 1 }
system("grep VmData /proc/$$/status");
printf "%d kBn", total_size(&foo)/1024;
foo(50);
system("grep VmData /proc/$$/status");
printf "%d kBn", total_size(&foo)/1024;
'
VmData:! 796 kB
7 kB
VmData:! 105652 kB
8 kB
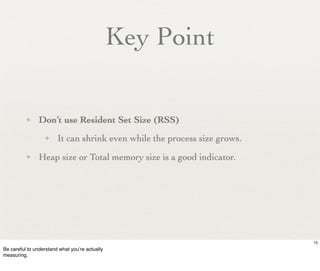
• VmData grew by ~100MB, we expected ~50MB, extra copy of value.
• Devel::Size 0.77 doesn't measure what's in sub pads (lexicals).
30](https://image.slidesharecdn.com/perlmemory-yapcasia-2012-120928040504-phpapp01/85/Perl-Memory-Use-201209-30-320.jpg)
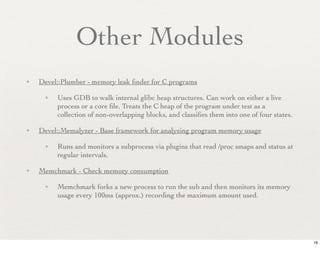
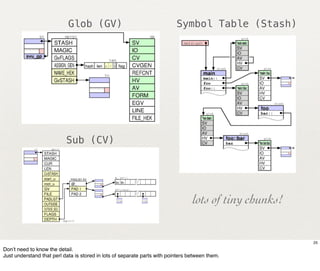
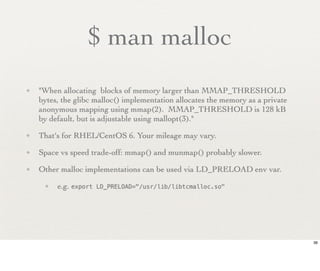
![Devel::Size 0.77 + hacks
perl -MDevel::Size=total_size -we '
sub foo { my $var = "#" x 2**20; foo($_[0]-1) if $_[0];1 }
system("grep VmData /proc/$$/status");
printf "%d kBn", total_size(&foo)/1024;
foo(50);
system("grep VmData /proc/$$/status");
printf "%d kBn", total_size(&foo)/1024;
'
VmData:! 796 kB
293 kB
VmData:! 105656 kB
104759 kB
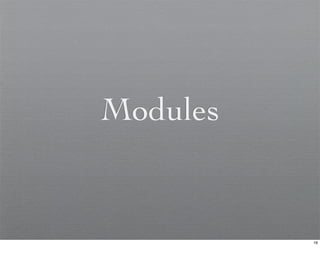
• Now does include the pad variables.
• But note the 293 kB initial value - it's measuring too much. Work in progress.
31](https://image.slidesharecdn.com/perlmemory-yapcasia-2012-120928040504-phpapp01/85/Perl-Memory-Use-201209-31-320.jpg)
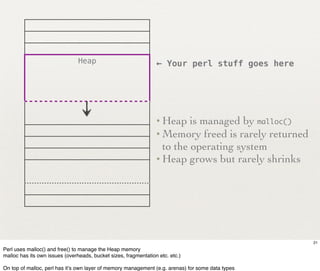
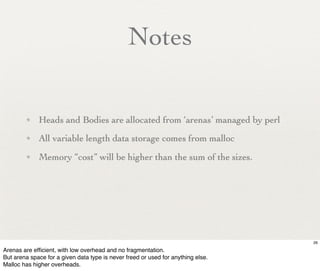
![Devel::Size 0.77 + hacks
$ report='printf "total_size %6d kBn", total_size(%main::)/1024;
system("grep VmData /proc/$$/status")'
$ perl -MDevel::Size=total_size -we “$report”
total_size 290 kB
VmData: 800 kB
$ perl -MMoose -MDevel::Size=total_size -we “$report”
total_size 9474 kB! [ 9474-290 = + 9184 kB ]
VmData: 11824 kB! [ 11824-800 = +11024 kB ]
What accounts for the 1840 kB difference in the increases?
-Arenas and other perl-internals aren't included
-Limitations of Devel::Size measuring subs and regexs
-Malloc heap buckets and fragmentation
32](https://image.slidesharecdn.com/perlmemory-yapcasia-2012-120928040504-phpapp01/85/Perl-Memory-Use-201209-32-320.jpg)


![PERL_DEBUG_MSTATS*
* Requires a perl configured to use it's own malloc (-Dusemymalloc)
$ PERL_DEBUG_MSTATS=1 perl -MMoose -MDevel::Size=total_size -we "$report"
total_size 9474 kB! [ 9474-290 = + 9184 kB ]
VmData: 11824 kB! [ 11824-800 = +11024 kB ]
Memory allocation statistics after execution: (buckets 8(8)..69624(65536)
429248 free: 225 125 69 25 18 1 3 6 0 6 1 23 0 0
! 0 9 26 10
6302120 used: 795 14226 2955 3230 2190 1759 425 112 30 862 11 2 1 2
! 0 1606 8920 4865
Total sbrk(): 6803456/1487:-13. Odd ends: pad+heads+chain+tail: 2048+70040+0+0
• There's 419 kB ("429248 free") is sitting in unused malloc buckets.
• See perldebguts and Devel::Peek docs for details. Also Devel::Mallinfo.
• Note Devel::Size total_size() says 9474 kB but malloc says only 6154 kb allocated!
37
by pgfs](https://image.slidesharecdn.com/perlmemory-yapcasia-2012-120928040504-phpapp01/85/Perl-Memory-Use-201209-37-320.jpg)

![Space in Hiding
✦ Perl tends to consume extra memory to save time
✦ This can lead to surprises, for example:
✦ sub foo {
my $var = "X" x 10_000_000;
}
foo(); # ~20MB still used after return!
✦ sub bar{
my $var = "X" x 10_000_000;
bar($_[0]-1) if $_[0]; # recurse
}
bar(50); # ~1GB still used after return!
42](https://image.slidesharecdn.com/perlmemory-yapcasia-2012-120928040504-phpapp01/85/Perl-Memory-Use-201209-42-320.jpg)


The document discusses Perl memory management, outlining the process memory structure and various tools for monitoring memory usage. It emphasizes the importance of understanding memory metrics like resident set size and heap size, as well as introduces both low-level and higher-level modules for tracking memory. Additionally, it covers memory allocation strategies, the role of malloc in managing heap memory, and practical coding examples for analyzing memory usage in Perl applications.


![[Kiwicon 2011] Post Memory Corruption Memory Analysis](https://cdn.slidesharecdn.com/ss_thumbnails/kiwiconbrossard-111127232850-phpapp01-thumbnail.jpg?width=640&height=640&fit=bounds)
![[HITB Malaysia 2011] Exploit Automation](https://cdn.slidesharecdn.com/ss_thumbnails/brossardhitb2011-111127232630-phpapp02-thumbnail.jpg?width=640&height=640&fit=bounds)
![[Ruxcon 2011] Post Memory Corruption Memory Analysis](https://cdn.slidesharecdn.com/ss_thumbnails/ruxcon-111127233040-phpapp02-thumbnail.jpg?width=640&height=640&fit=bounds)