Downloaded 27 times

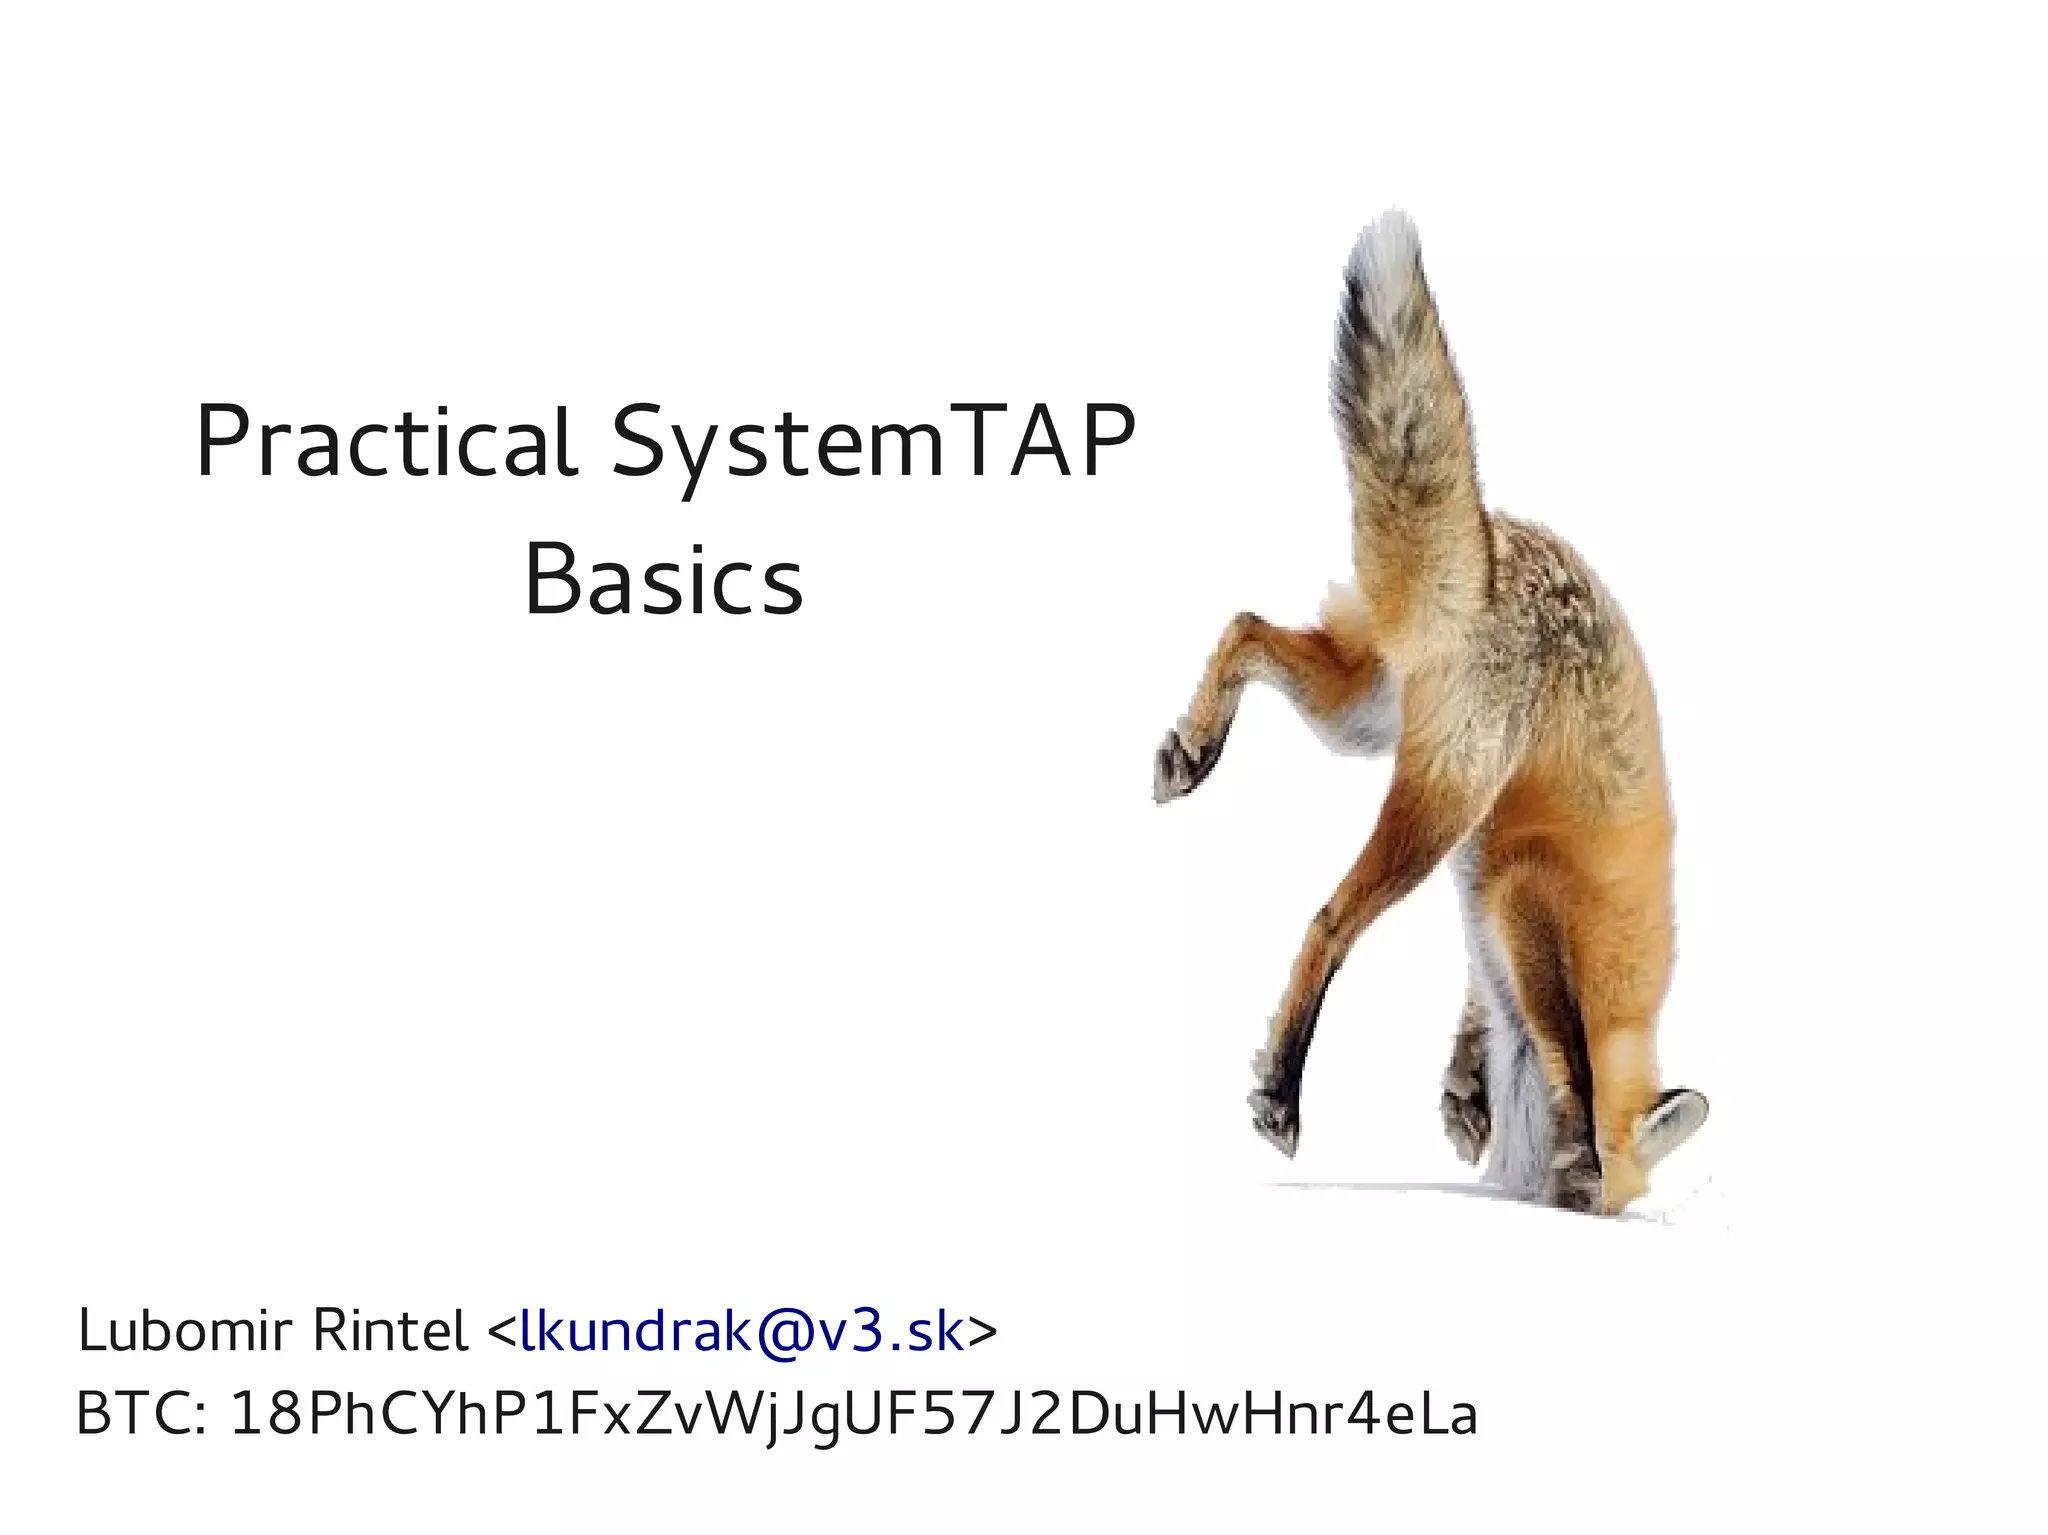
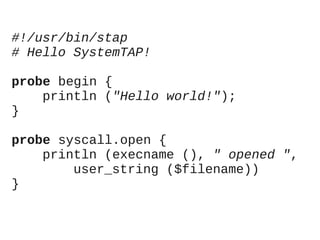

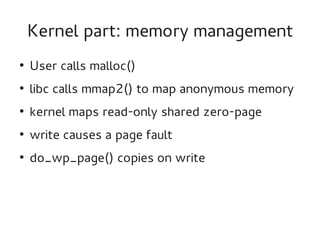
![/* The package a process is
* executing */
global package;
/* A Perl instruction */
probe process
("/usr/lib/perl5/CORE/libperl.so")
.function ("Perl_pp_*")
{
pid = pid ();
package[pid] = user_string (
$my_perl->Icurcop
->cop_stashpv);
}](https://image.slidesharecdn.com/lr-systemtap-130723094246-phpapp01/85/Practical-SystemTAP-basics-Perl-memory-profiling-14-320.jpg)
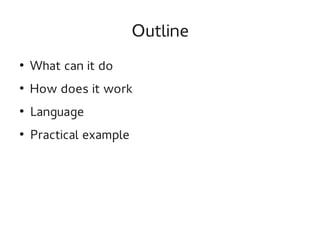
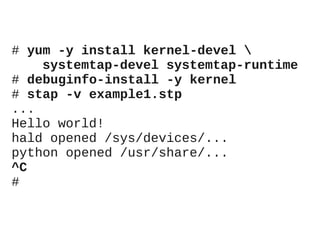
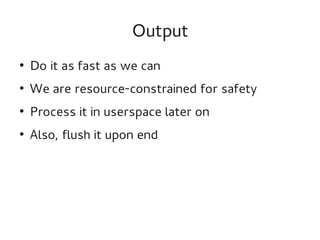
![/* Allocations per package and pid */
global allocs;
/* Account for COW */
probe kernel.function ("do_wp_page")
{
pid = pid ();
pkg = package[pid];
if (pkg != "")
allocs[pkg, pid] <<<
mem_page_size ();
}](https://image.slidesharecdn.com/lr-systemtap-130723094246-phpapp01/85/Practical-SystemTAP-basics-Perl-memory-profiling-16-320.jpg)
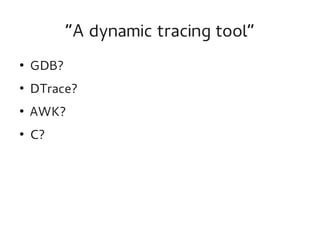
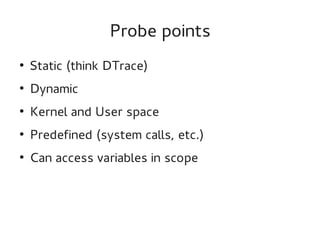
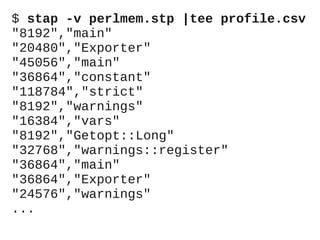
![/* Dump frequently, to so that we
* won't overflow */
probe timer.ms (100), end
{
foreach ([pkg, pid] in allocs) {
printf (""%d","%s"n",
@sum (allocs[pkg, pid]),
pkg)
}
delete allocs;
}](https://image.slidesharecdn.com/lr-systemtap-130723094246-phpapp01/85/Practical-SystemTAP-basics-Perl-memory-profiling-18-320.jpg)


This document provides an overview of the SystemTap dynamic tracing tool. It can trace both kernel and userspace functions and variables. Scripts are written in a powerful scripting language that can inline C code and are compiled into kernel modules. Practical examples are provided, including a Perl memory profiler that traces memory allocations to different Perl packages. Safety features like timeouts help prevent scripts from overloading systems.


![[POSS 2019] OVirt and Ceph: Perfect Combination.?](https://cdn.slidesharecdn.com/ss_thumbnails/pre-poss2019-worteks-ovirt-ceph-191216145947-thumbnail.jpg?width=640&height=640&fit=bounds)