Perl Memory Use
 Tim Bunce @ OSCON July 2012


                               1
Scope of the talk...
✦   Not really "profiling"
✦   No leak detection
✦   No VM, page mapping, MMU, TLB, threads etc
✦   Linux focus
✦   Almost no copy-on-write
✦   No cats


                                                 2
Goals

✦   Give you a top-to-bottom overview
✦   Identify the key issues and complications
✦   Show you useful tools along the way
✦   Future plans


                                                3
Ouch!
$ perl some_script.pl
Out of memory!
$

$ perl some_script.pl
Killed.
$

$ perl some_script.pl
$
Someone shouts: "Hey! My process has been killed!"

$ perl some_script.pl
[later] "Umm, what's taking so long?"


                                                     4
Process Memory


                 5
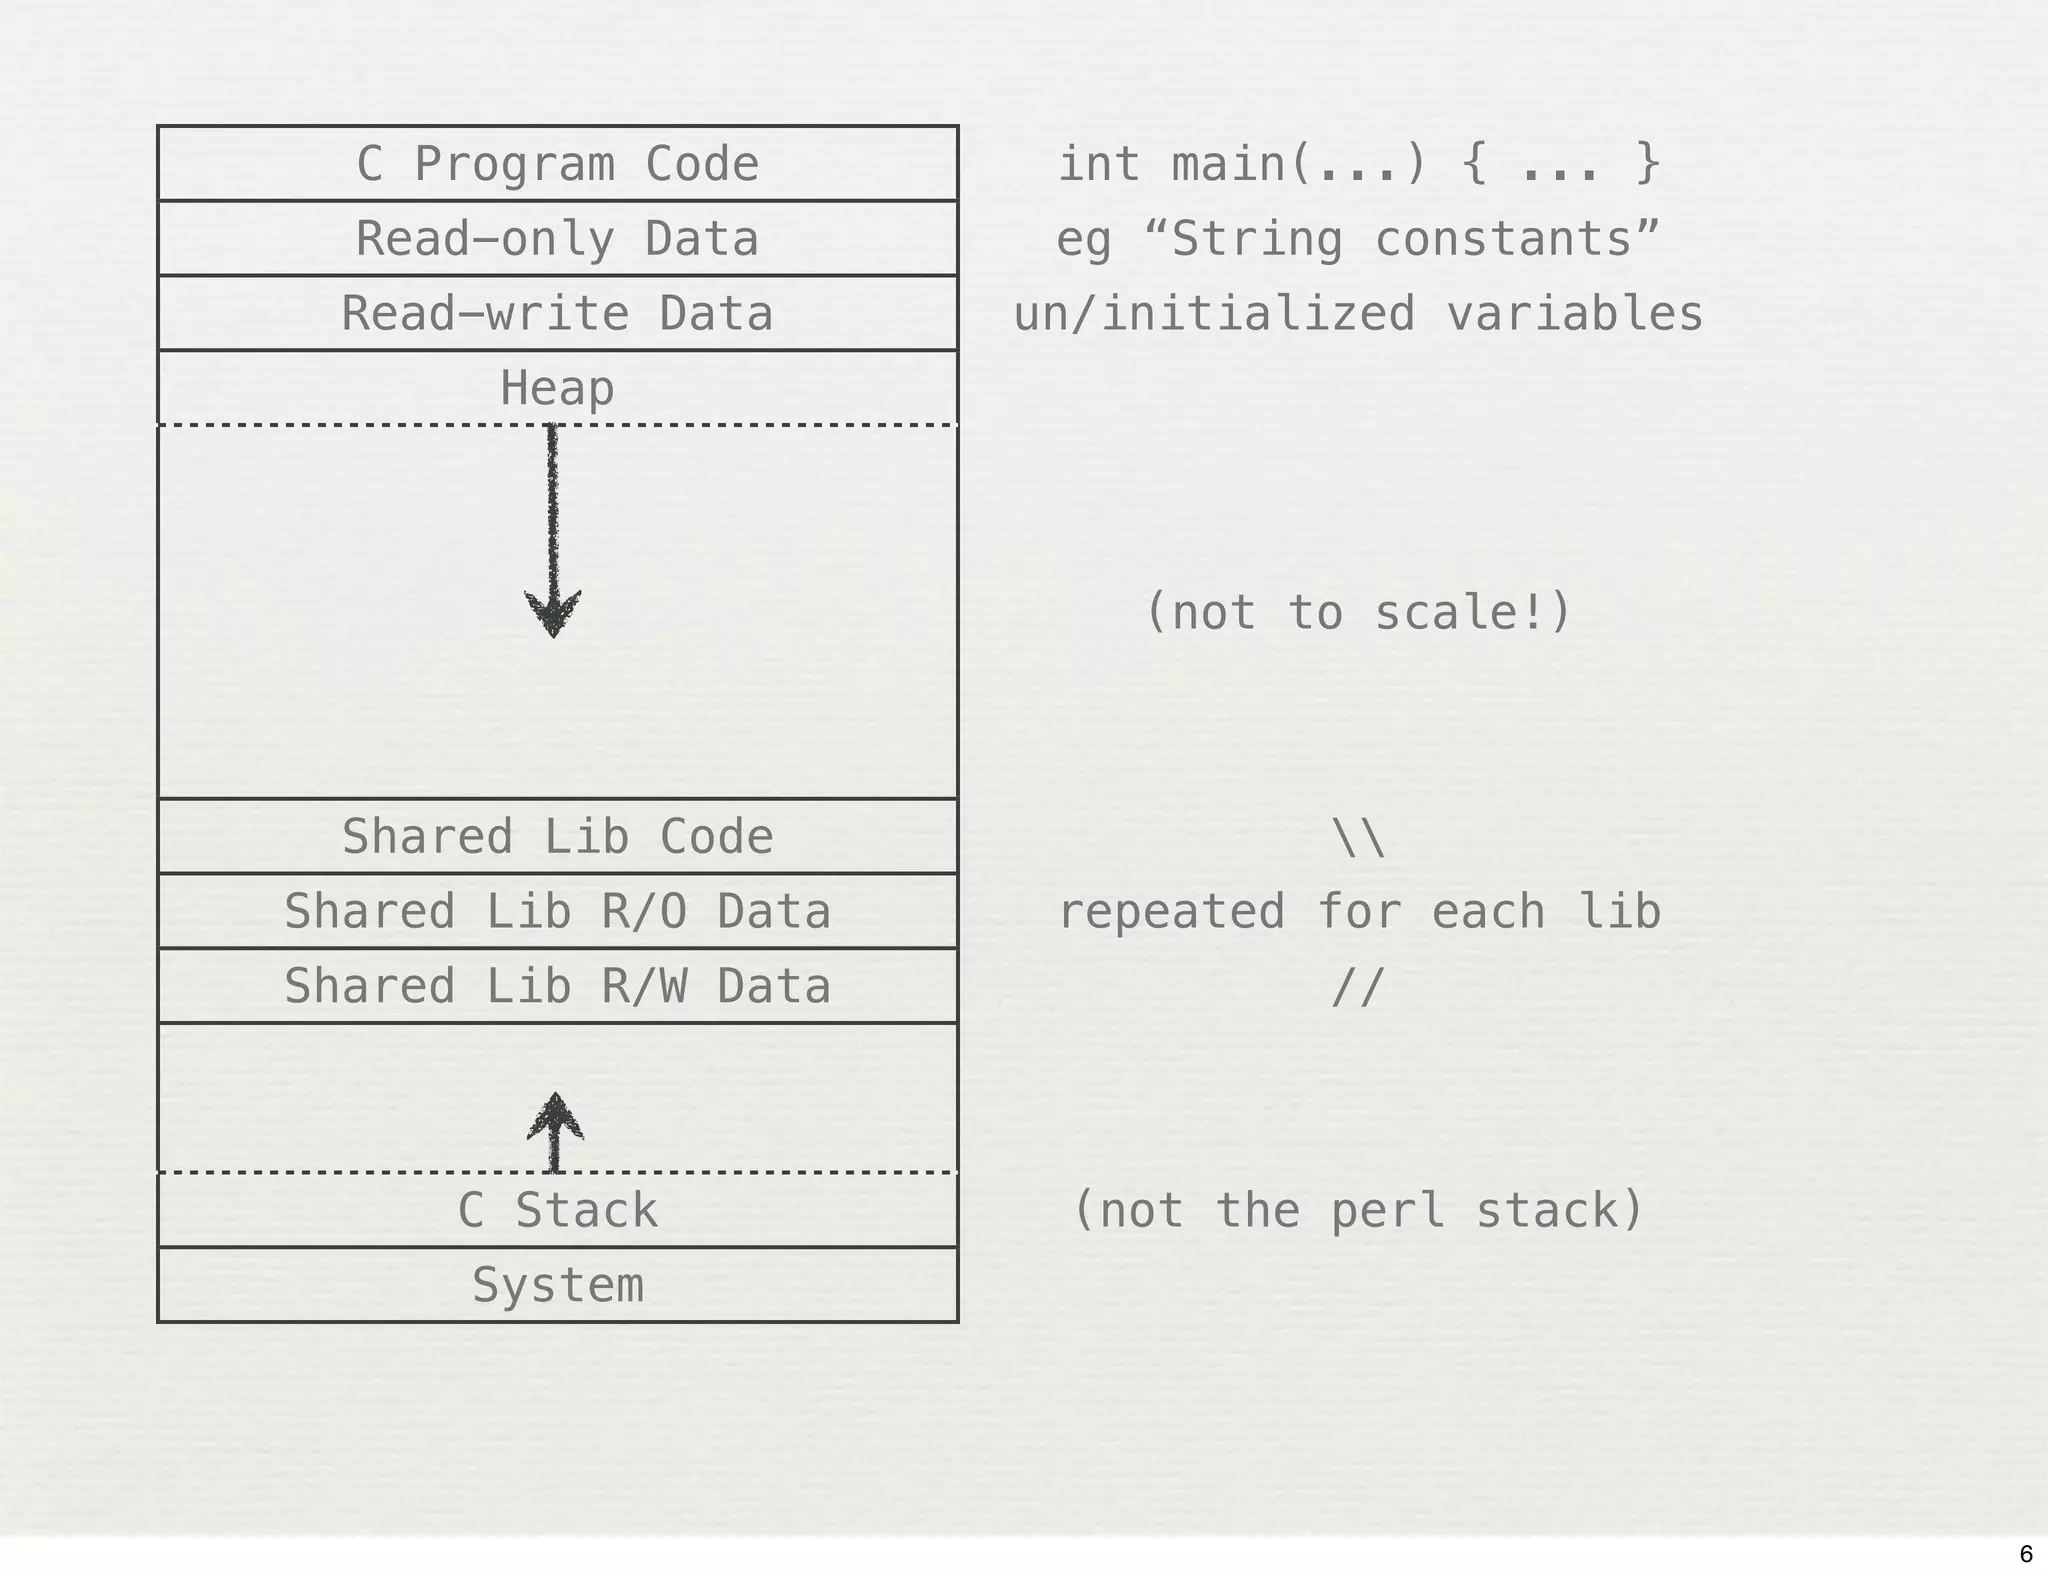
C Program Code       int main(...) { ... }
  Read-only Data       eg “String constants”
 Read-write Data      un/initialized variables
       Heap


                          (not to scale!)


 Shared Lib Code                
Shared Lib R/O Data    repeated for each lib
Shared Lib R/W Data             //


     C Stack           (not the perl stack)
      System


                                                 6
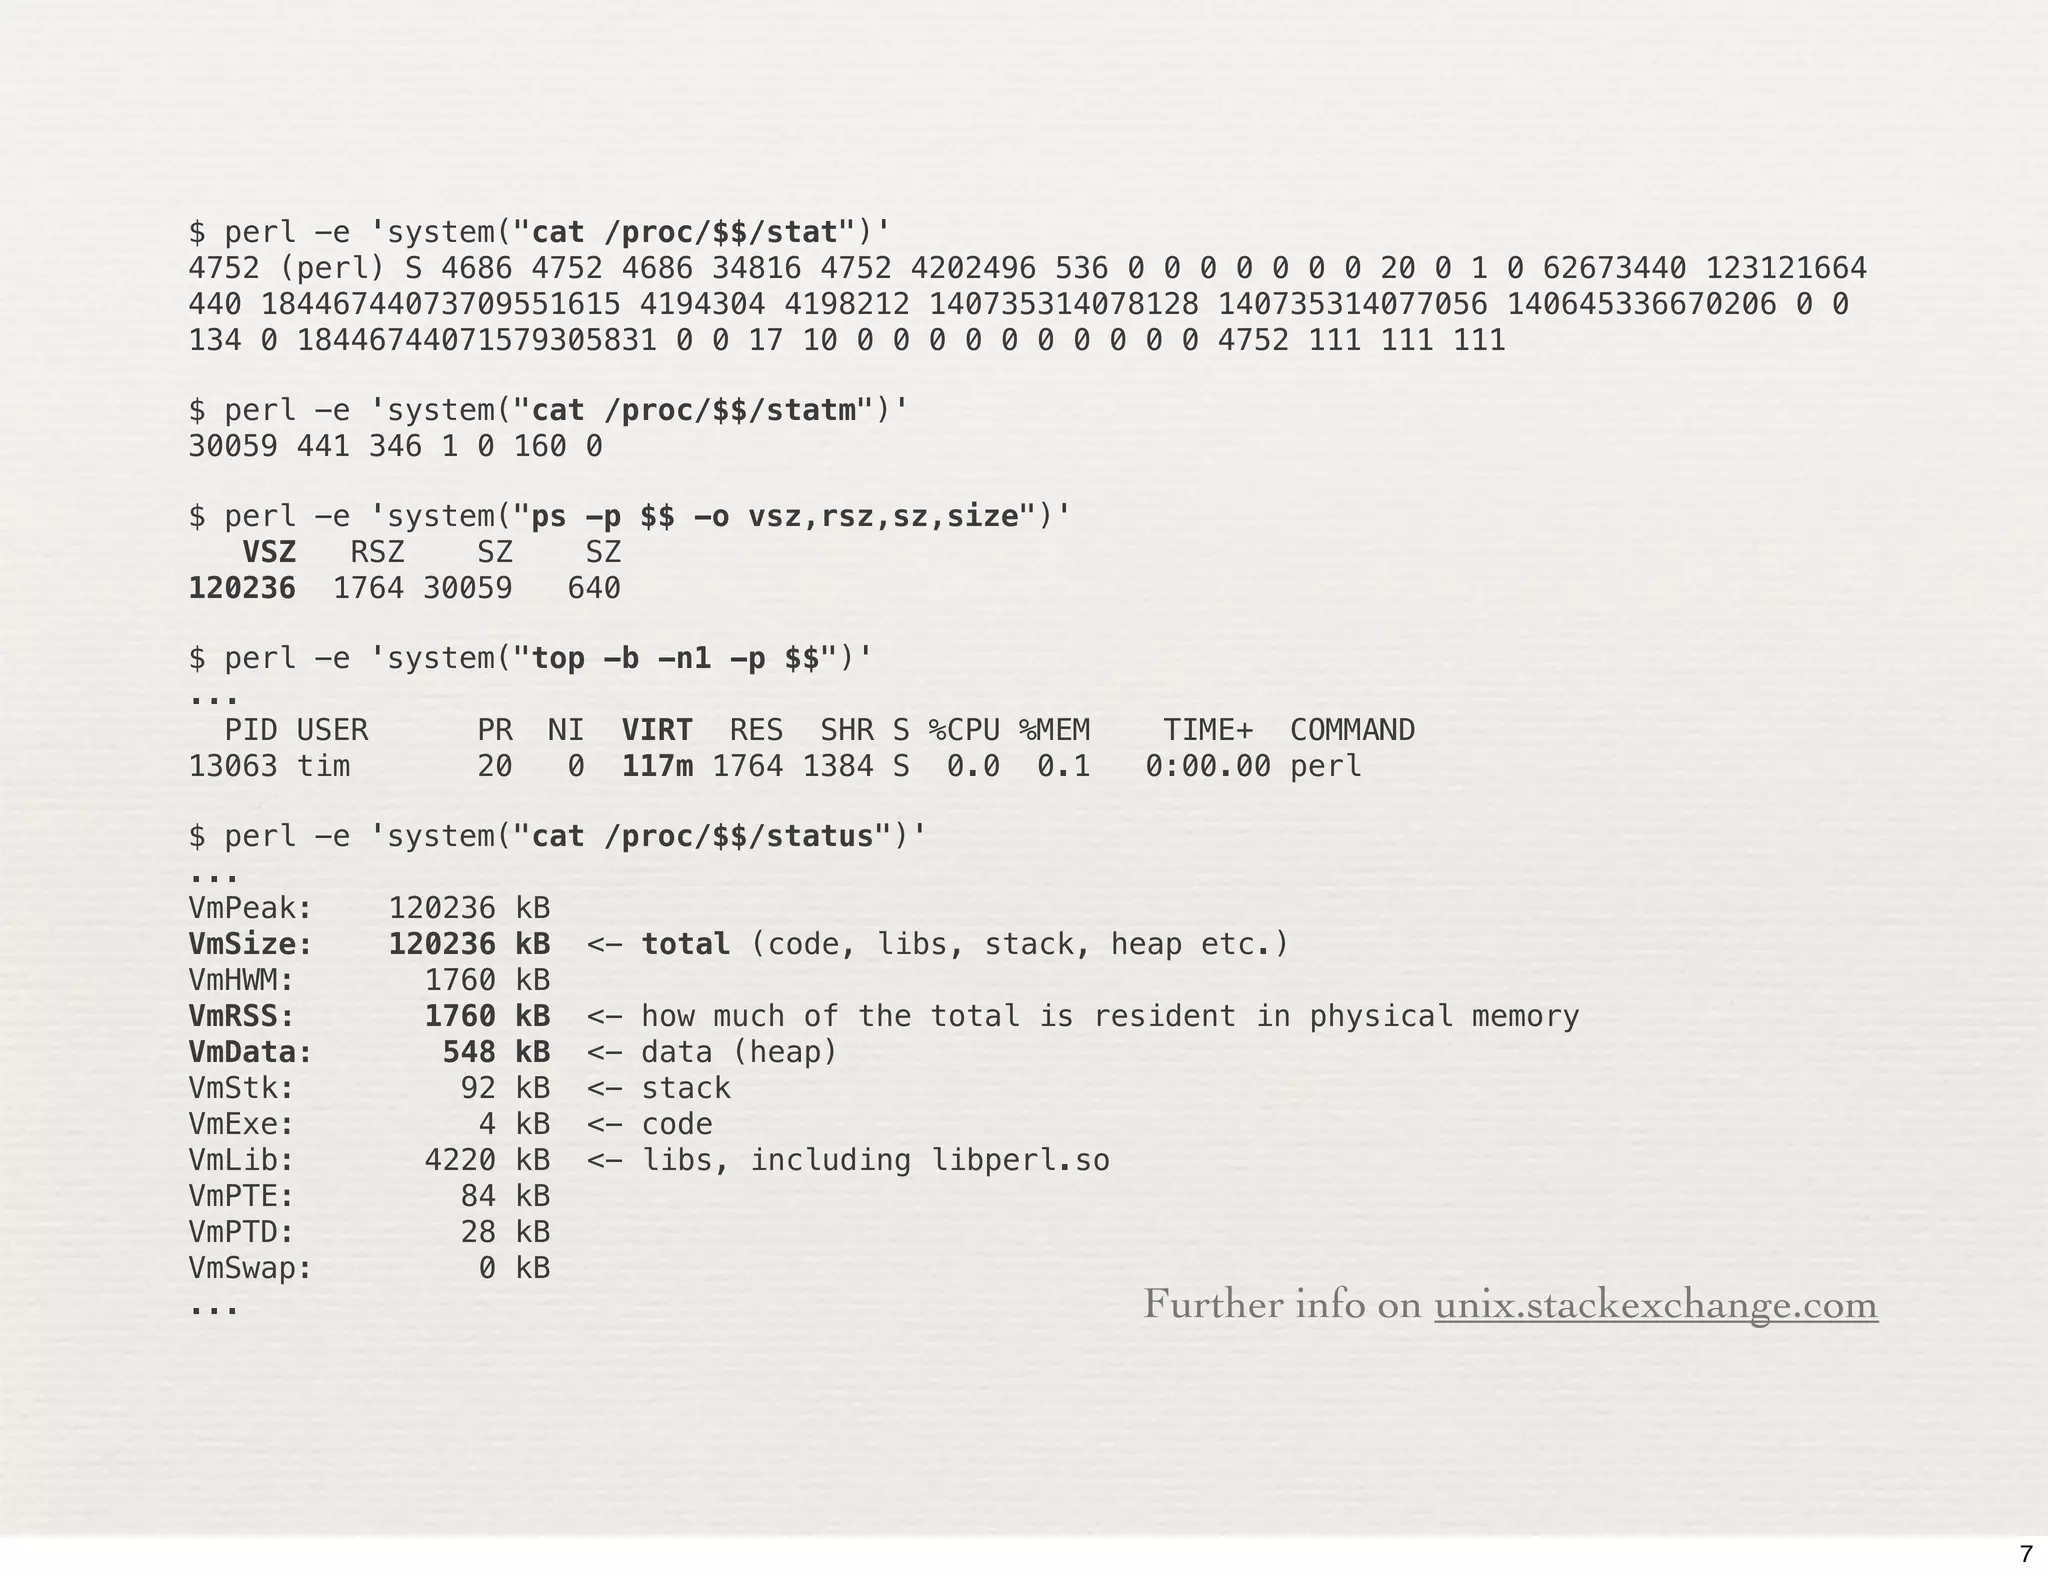
$ perl -e 'system("cat /proc/$$/stat")'
4752 (perl) S 4686 4752 4686 34816 4752 4202496 536 0 0 0 0 0 0 0 20 0 1 0 62673440 123121664
440 18446744073709551615 4194304 4198212 140735314078128 140735314077056 140645336670206 0 0
134 0 18446744071579305831 0 0 17 10 0 0 0 0 0 0 0 0 0 0 4752 111 111 111

$ perl -e 'system("cat /proc/$$/statm")'
30059 441 346 1 0 160 0

$ perl -e 'system("ps -p $$ -o vsz,rsz,sz,size")'
   VSZ   RSZ    SZ    SZ
120236 1764 30059    640

$ perl -e 'system("top -b -n1 -p $$")'
...
  PID USER      PR NI VIRT RES SHR S %CPU %MEM       TIME+ COMMAND
13063 tim       20   0 117m 1764 1384 S 0.0 0.1     0:00.00 perl

$ perl -e 'system("cat /proc/$$/status")'
...
VmPeak:!   120236 kB
VmSize:!   120236 kB <- total (code, libs, stack, heap etc.)
VmHWM:!      1760 kB
VmRSS:!      1760 kB <- how much of the total is resident in physical memory
VmData:!      548 kB <- data (heap)
VmStk:!        92 kB <- stack
VmExe:!         4 kB <- code
VmLib:!      4220 kB <- libs, including libperl.so
VmPTE:!        84 kB
VmPTD:!        28 kB
VmSwap:!        0 kB
...                                                 Further info on unix.stackexchange.com


                                                                                                7
$ perl -e 'system("cat /proc/$$/maps")'
address                   perms ... pathname
00400000-00401000         r-xp ...   /.../perl-5.NN.N/bin/perl
00601000-00602000         rw-p ...   /.../perl-5.NN.N/bin/perl

0087f000-008c1000           rw-p ...     [heap]


7f858cba1000-7f8592a32000 r--p ...       /usr/lib/locale/locale-archive-rpm

7f8592c94000-7f8592e1a000   r-xp   ...   /lib64/libc-2.12.so
7f8592e1a000-7f859301a000   ---p   ...   /lib64/libc-2.12.so
7f859301a000-7f859301e000   r--p   ...   /lib64/libc-2.12.so
7f859301e000-7f859301f000   rw-p   ...   /lib64/libc-2.12.so
7f859301f000-7f8593024000   rw-p   ...

...other libs...

7f8593d1b000-7f8593e7c000   r-xp   ...   /.../lib/5.NN.N/x86_64-linux/CORE/libperl.so
7f8593e7c000-7f859407c000   ---p   ...   /.../lib/5.NN.N/x86_64-linux/CORE/libperl.so
7f859407c000-7f8594085000   rw-p   ...   /.../lib/5.NN.N/x86_64-linux/CORE/libperl.so
7f85942a6000-7f85942a7000   rw-p   ...


7fff61284000-7fff6129a000 rw-p ...       [stack]

7fff613fe000-7fff61400000 r-xp ...   [vdso]
ffffffffff600000-ffffffffff601000 r-xp ... [vsyscall]


                                                                                        8
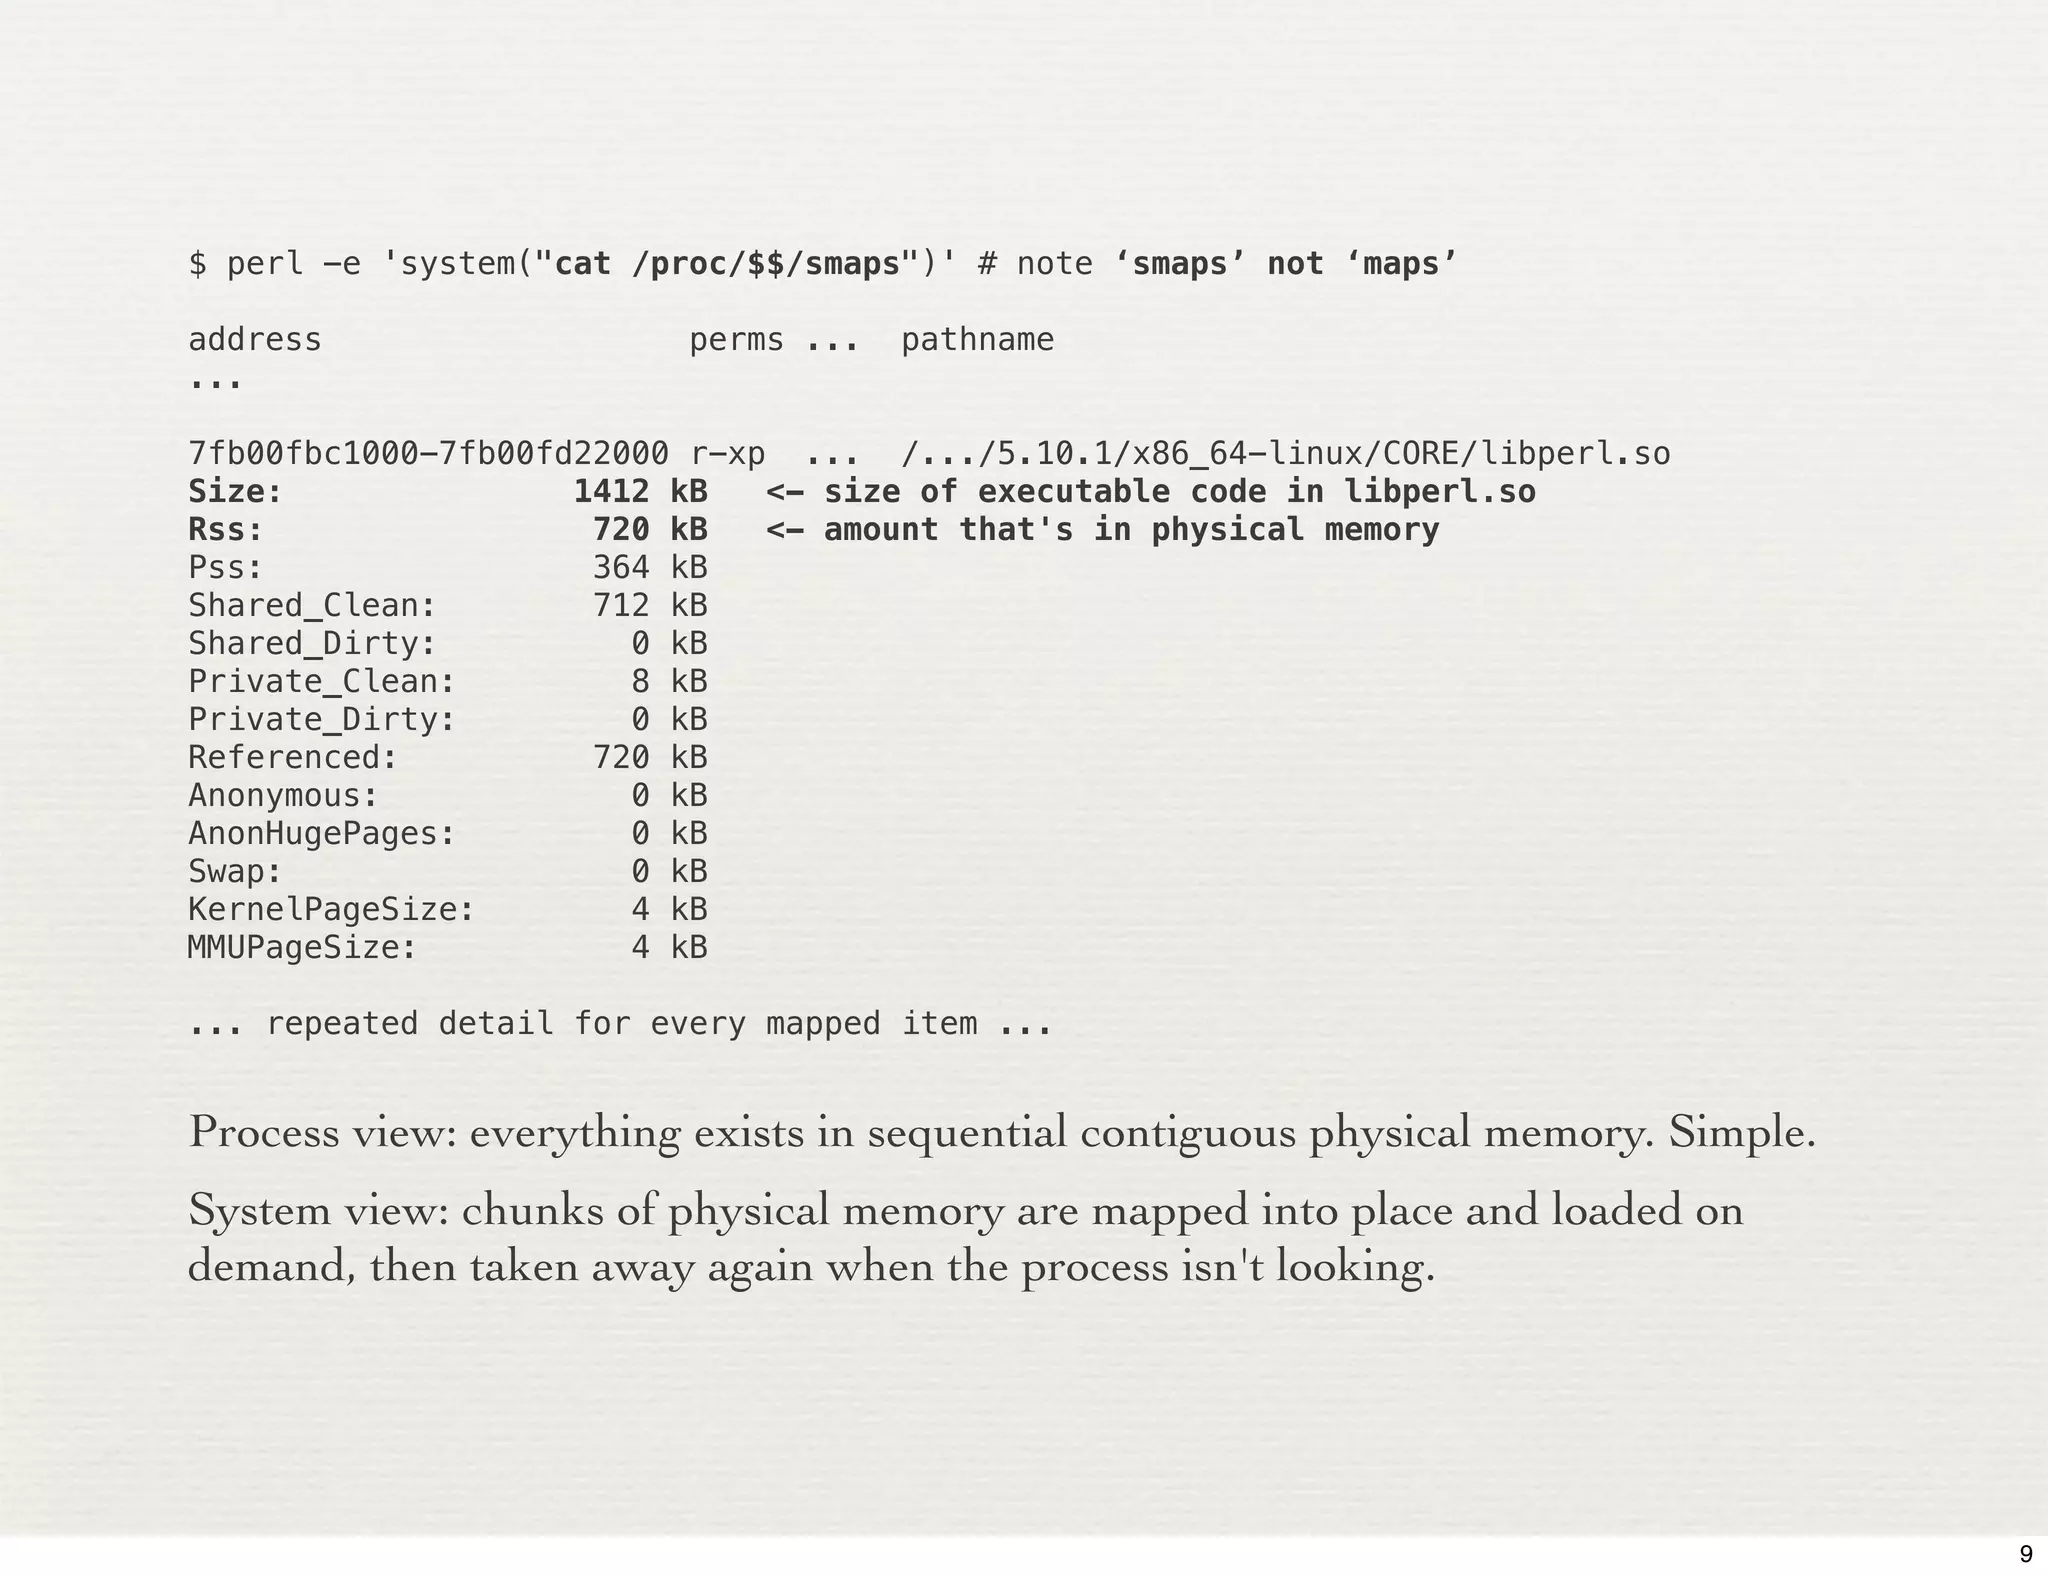
$ perl -e 'system("cat /proc/$$/smaps")' # note ‘smaps’ not ‘maps’

address                   perms ...   pathname
...

7fb00fbc1000-7fb00fd22000 r-xp ... /.../5.10.1/x86_64-linux/CORE/libperl.so
Size:               1412 kB   <- size of executable code in libperl.so
Rss:                 720 kB   <- amount that's in physical memory
Pss:                 364 kB
Shared_Clean:        712 kB
Shared_Dirty:          0 kB
Private_Clean:         8 kB
Private_Dirty:         0 kB
Referenced:          720 kB
Anonymous:             0 kB
AnonHugePages:         0 kB
Swap:                  0 kB
KernelPageSize:        4 kB
MMUPageSize:           4 kB

... repeated detail for every mapped item ...


Process view: everything exists in sequential contiguous physical memory. Simple.
System view: chunks of physical memory are mapped into place and loaded on
demand, then taken away again when the process isn't looking.


                                                                                    9
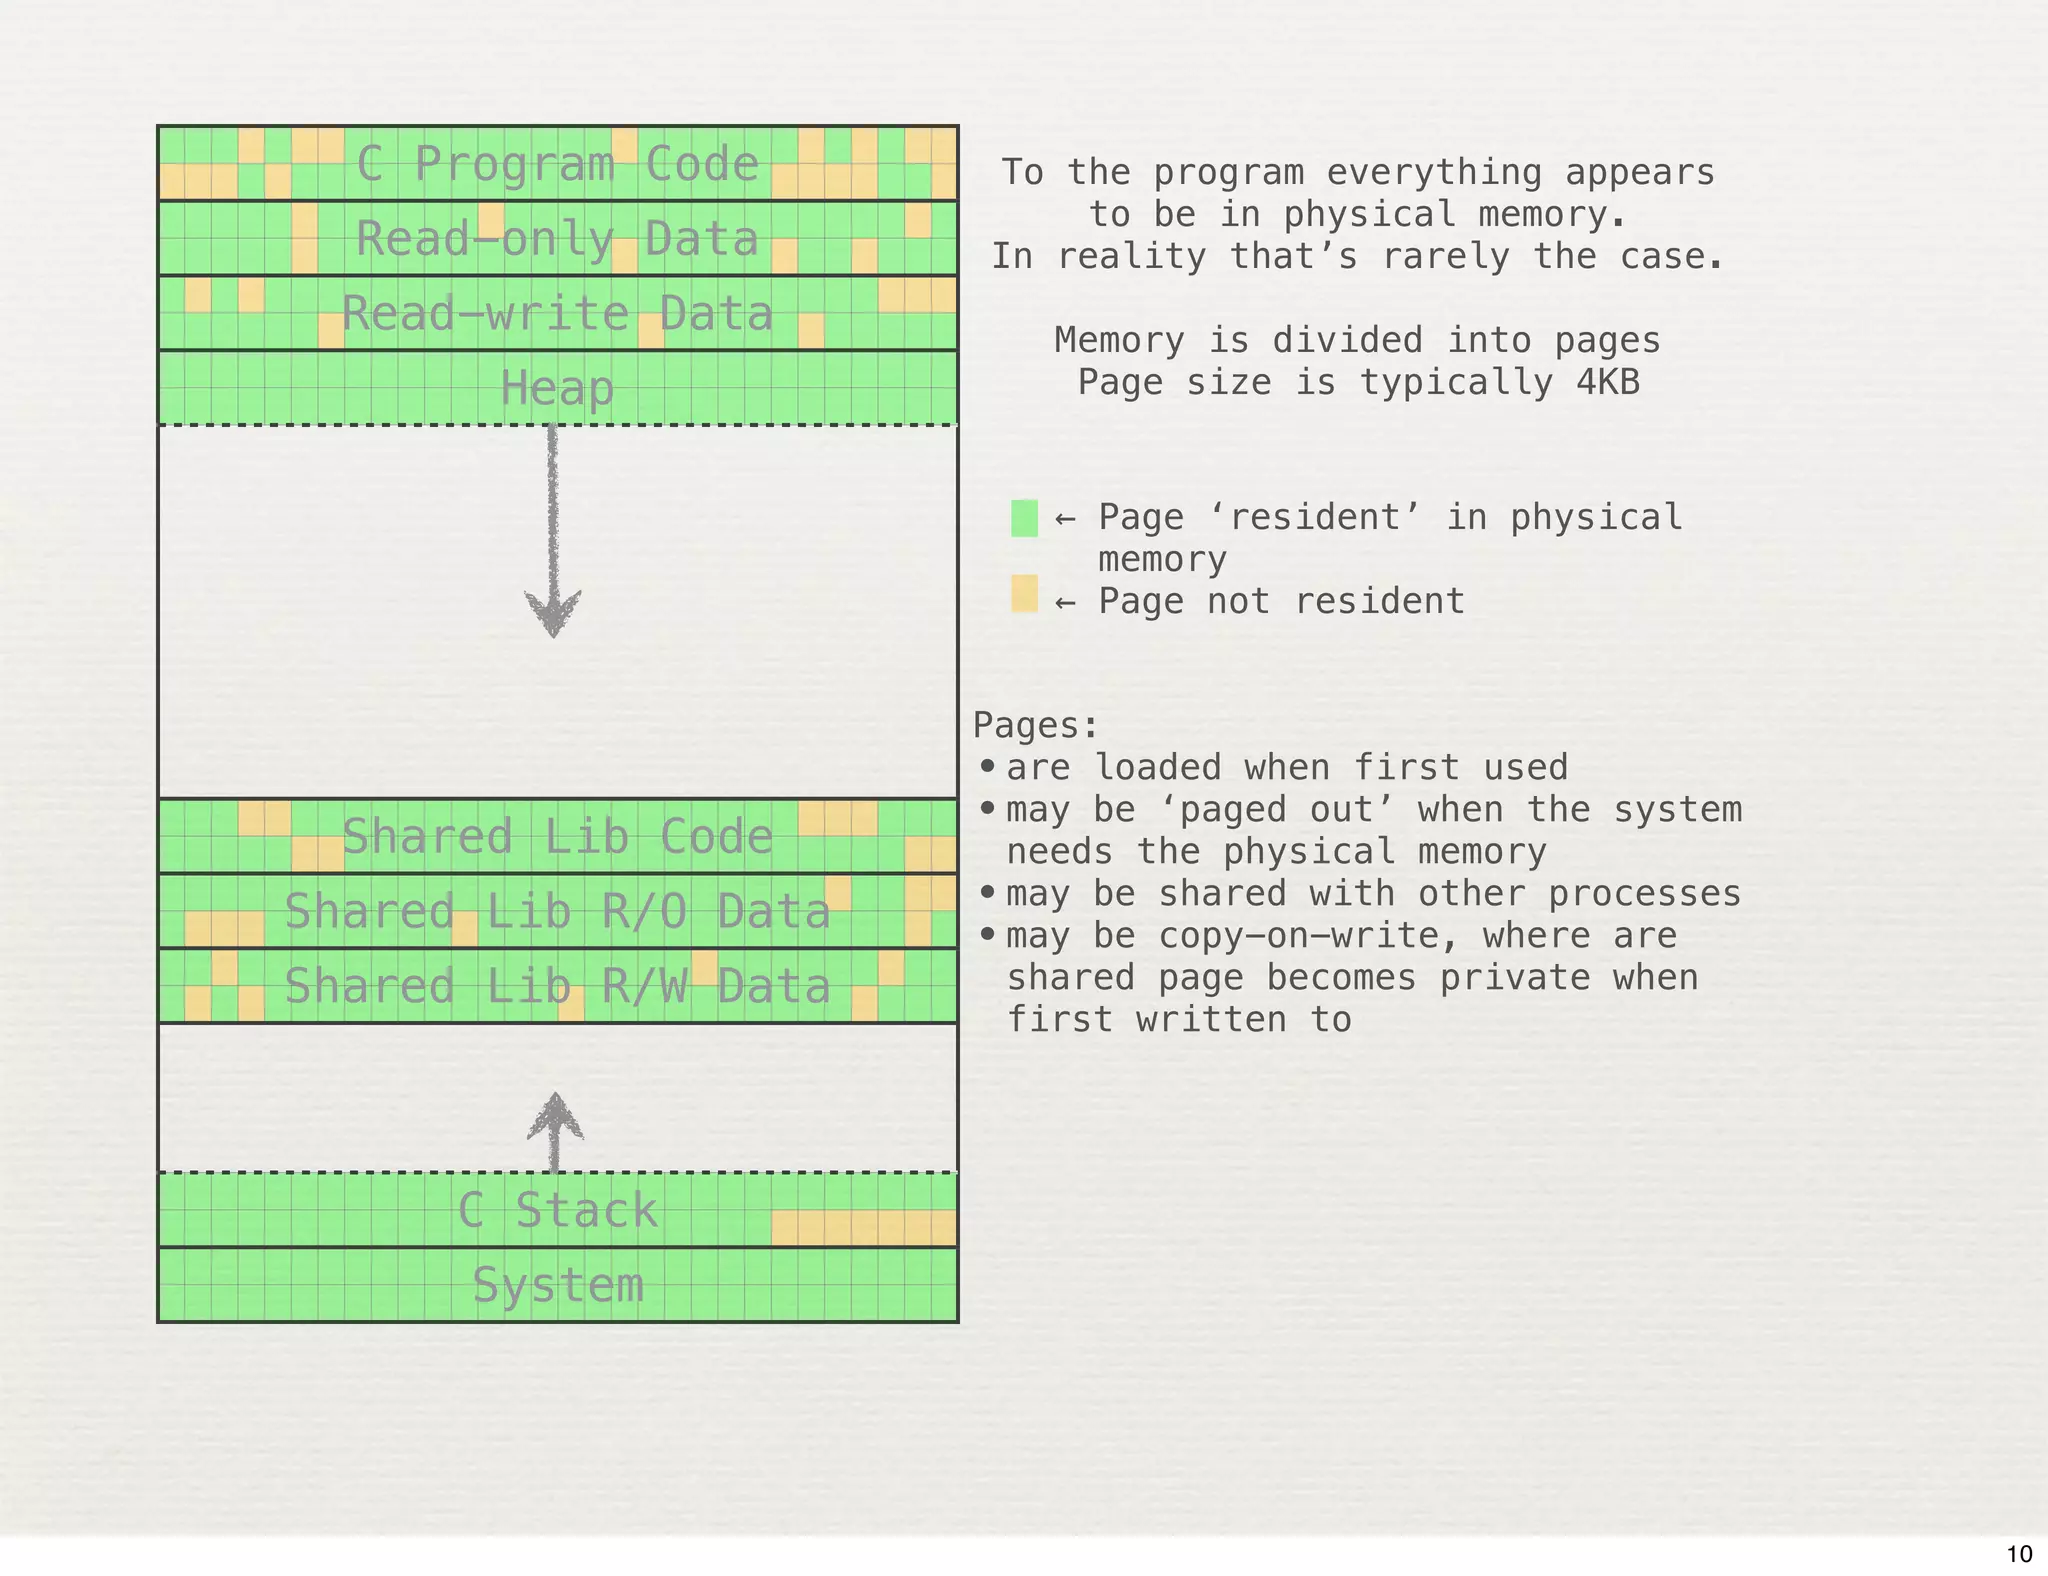
C Program Code      To the program everything appears
                          to be in physical memory.
  Read-only Data      In reality that’s rarely the case.
 Read-write Data         Memory is divided into pages
       Heap               Page size is typically 4KB


                         ← Page ‘resident’ in physical
                           memory
                         ← Page not resident


                      Pages:
                      • are loaded when first used
                      • may be ‘paged out’ when the system
 Shared Lib Code        needs the physical memory
Shared Lib R/O Data   • may be shared with other processes
                      • may be copy-on-write, where are
Shared Lib R/W Data     shared page becomes private when
                        first written to


     C Stack
      System


                                                             10
Key Points
✦   Pages of a process can be paged out if the system wants the physical
    memory. So Resident Set Size (RSS) can shrink even while the
    overall process size grows.
✦   Re private/shared/copy-on-write: If a page is currently paged out its
    attributes are paged out as well. In this case a page is neither reported
    as private nor as shared. It is only included in the process size.
✦   So be careful to understand what you’re actually measuring!
✦   Generally total memory size is a good indicator.


                                                                                11
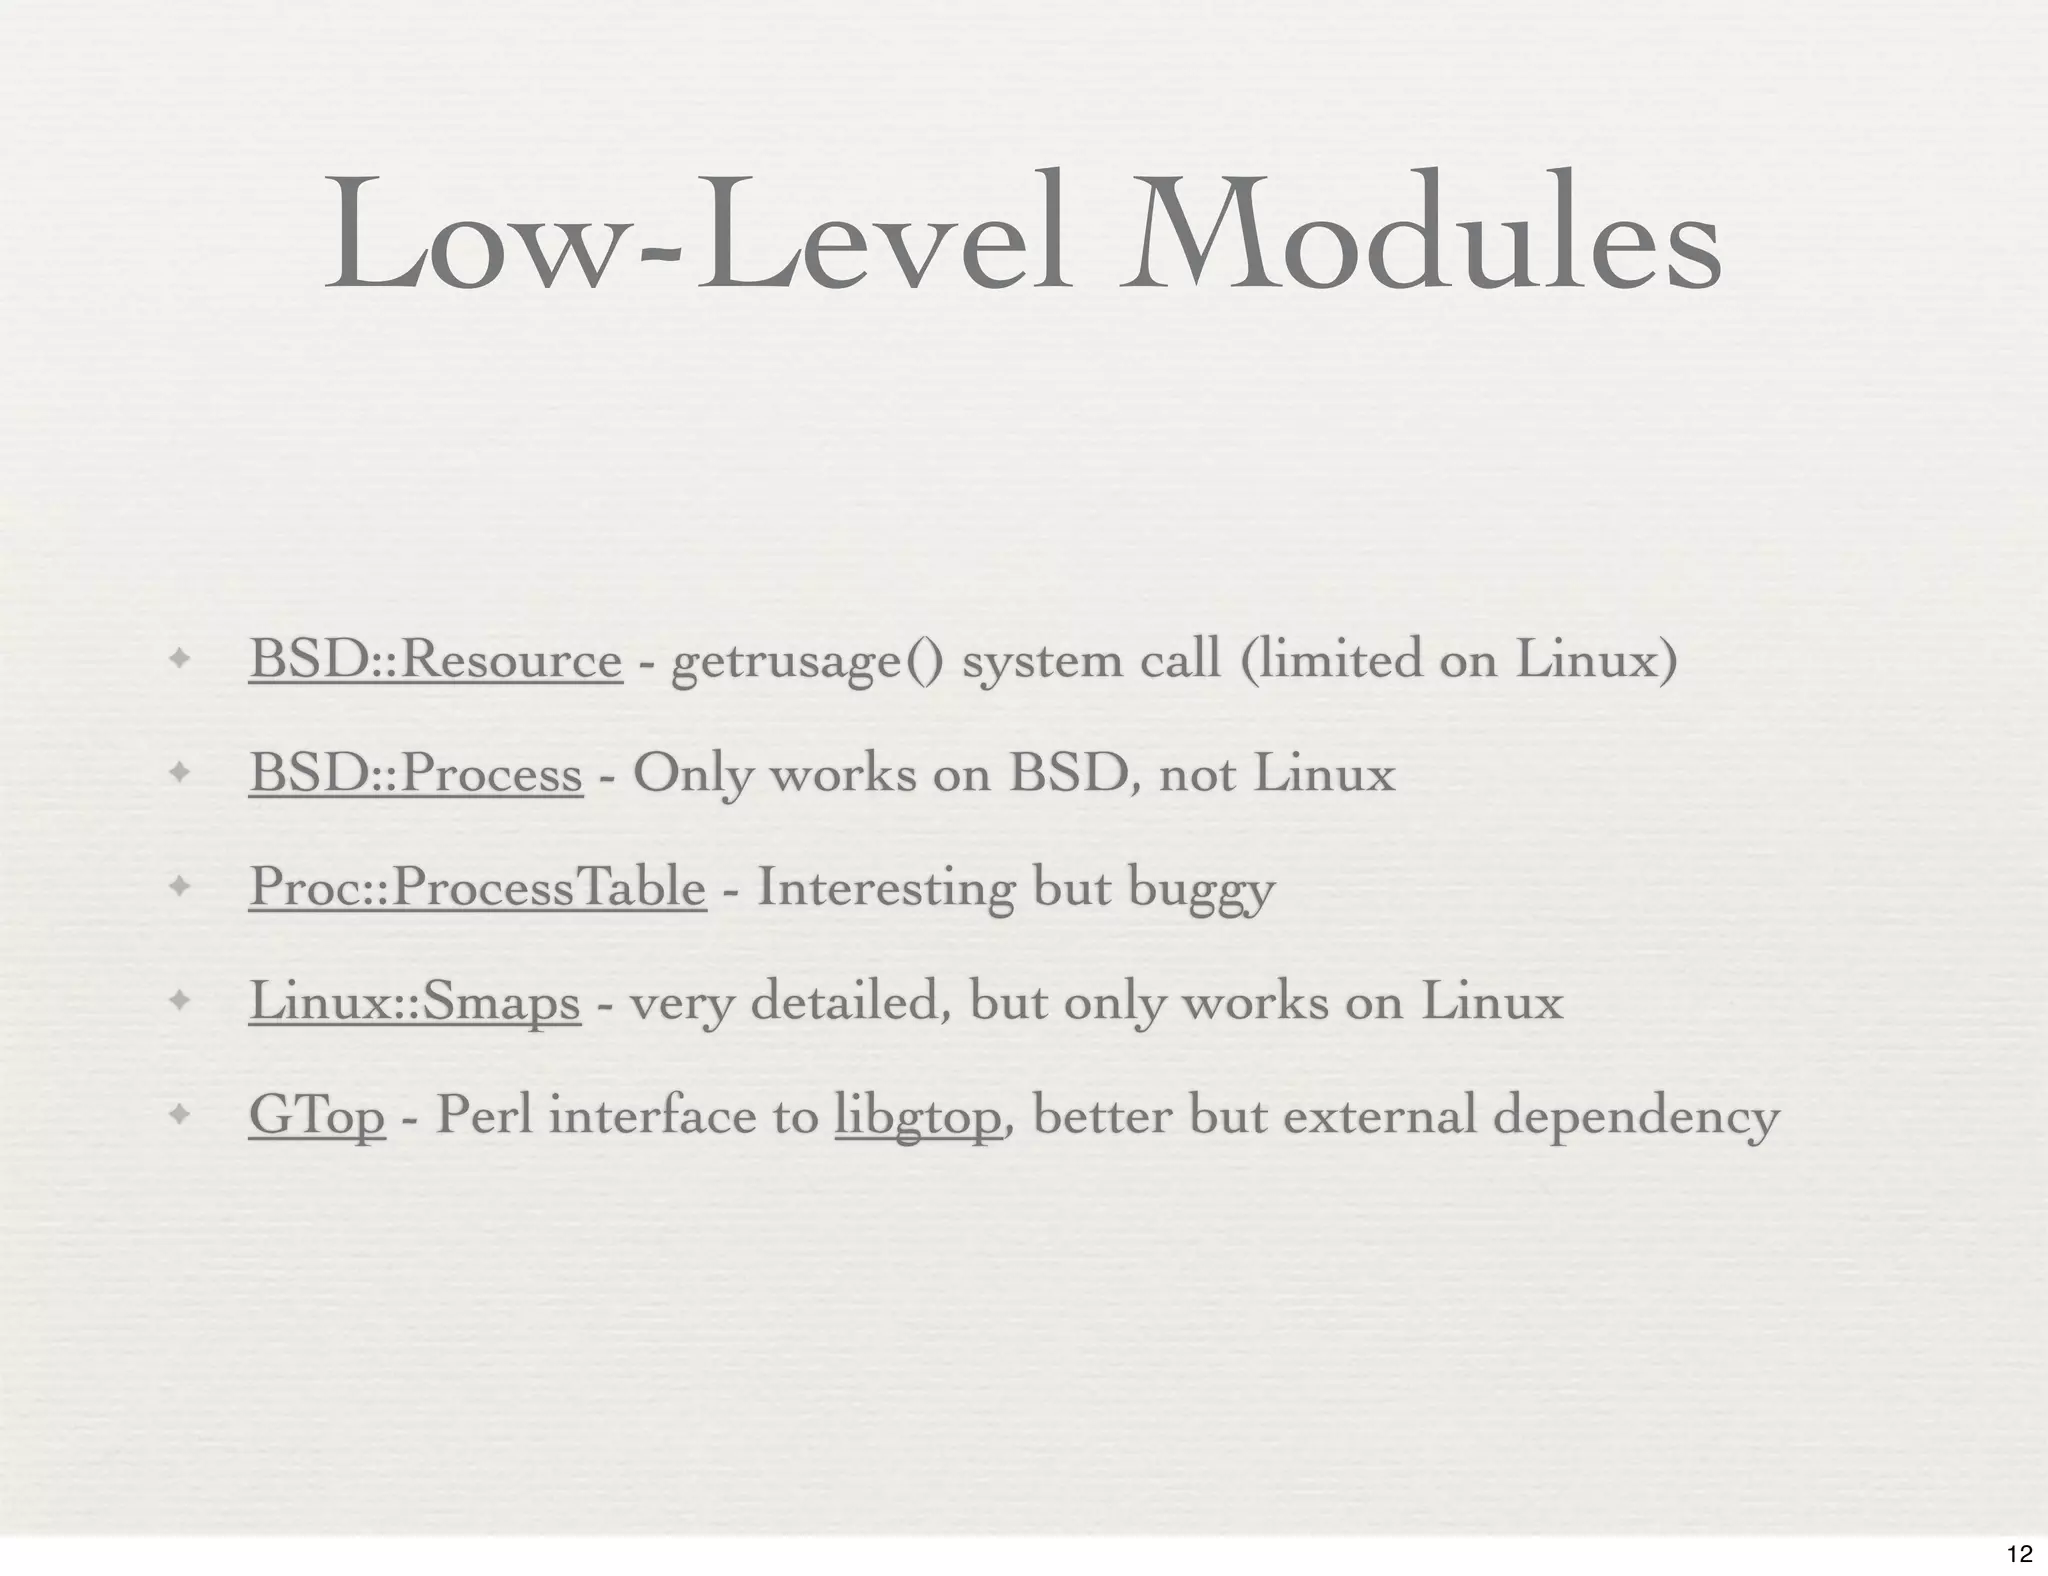
Low-Level Modules

✦   BSD::Resource - getrusage() system call (limited on Linux)
✦   BSD::Process - Only works on BSD, not Linux
✦   Proc::ProcessTable - Interesting but buggy
✦   Linux::Smaps - very detailed, but only works on Linux
✦   GTop - Perl interface to libgtop, better but external dependency


                                                                       12
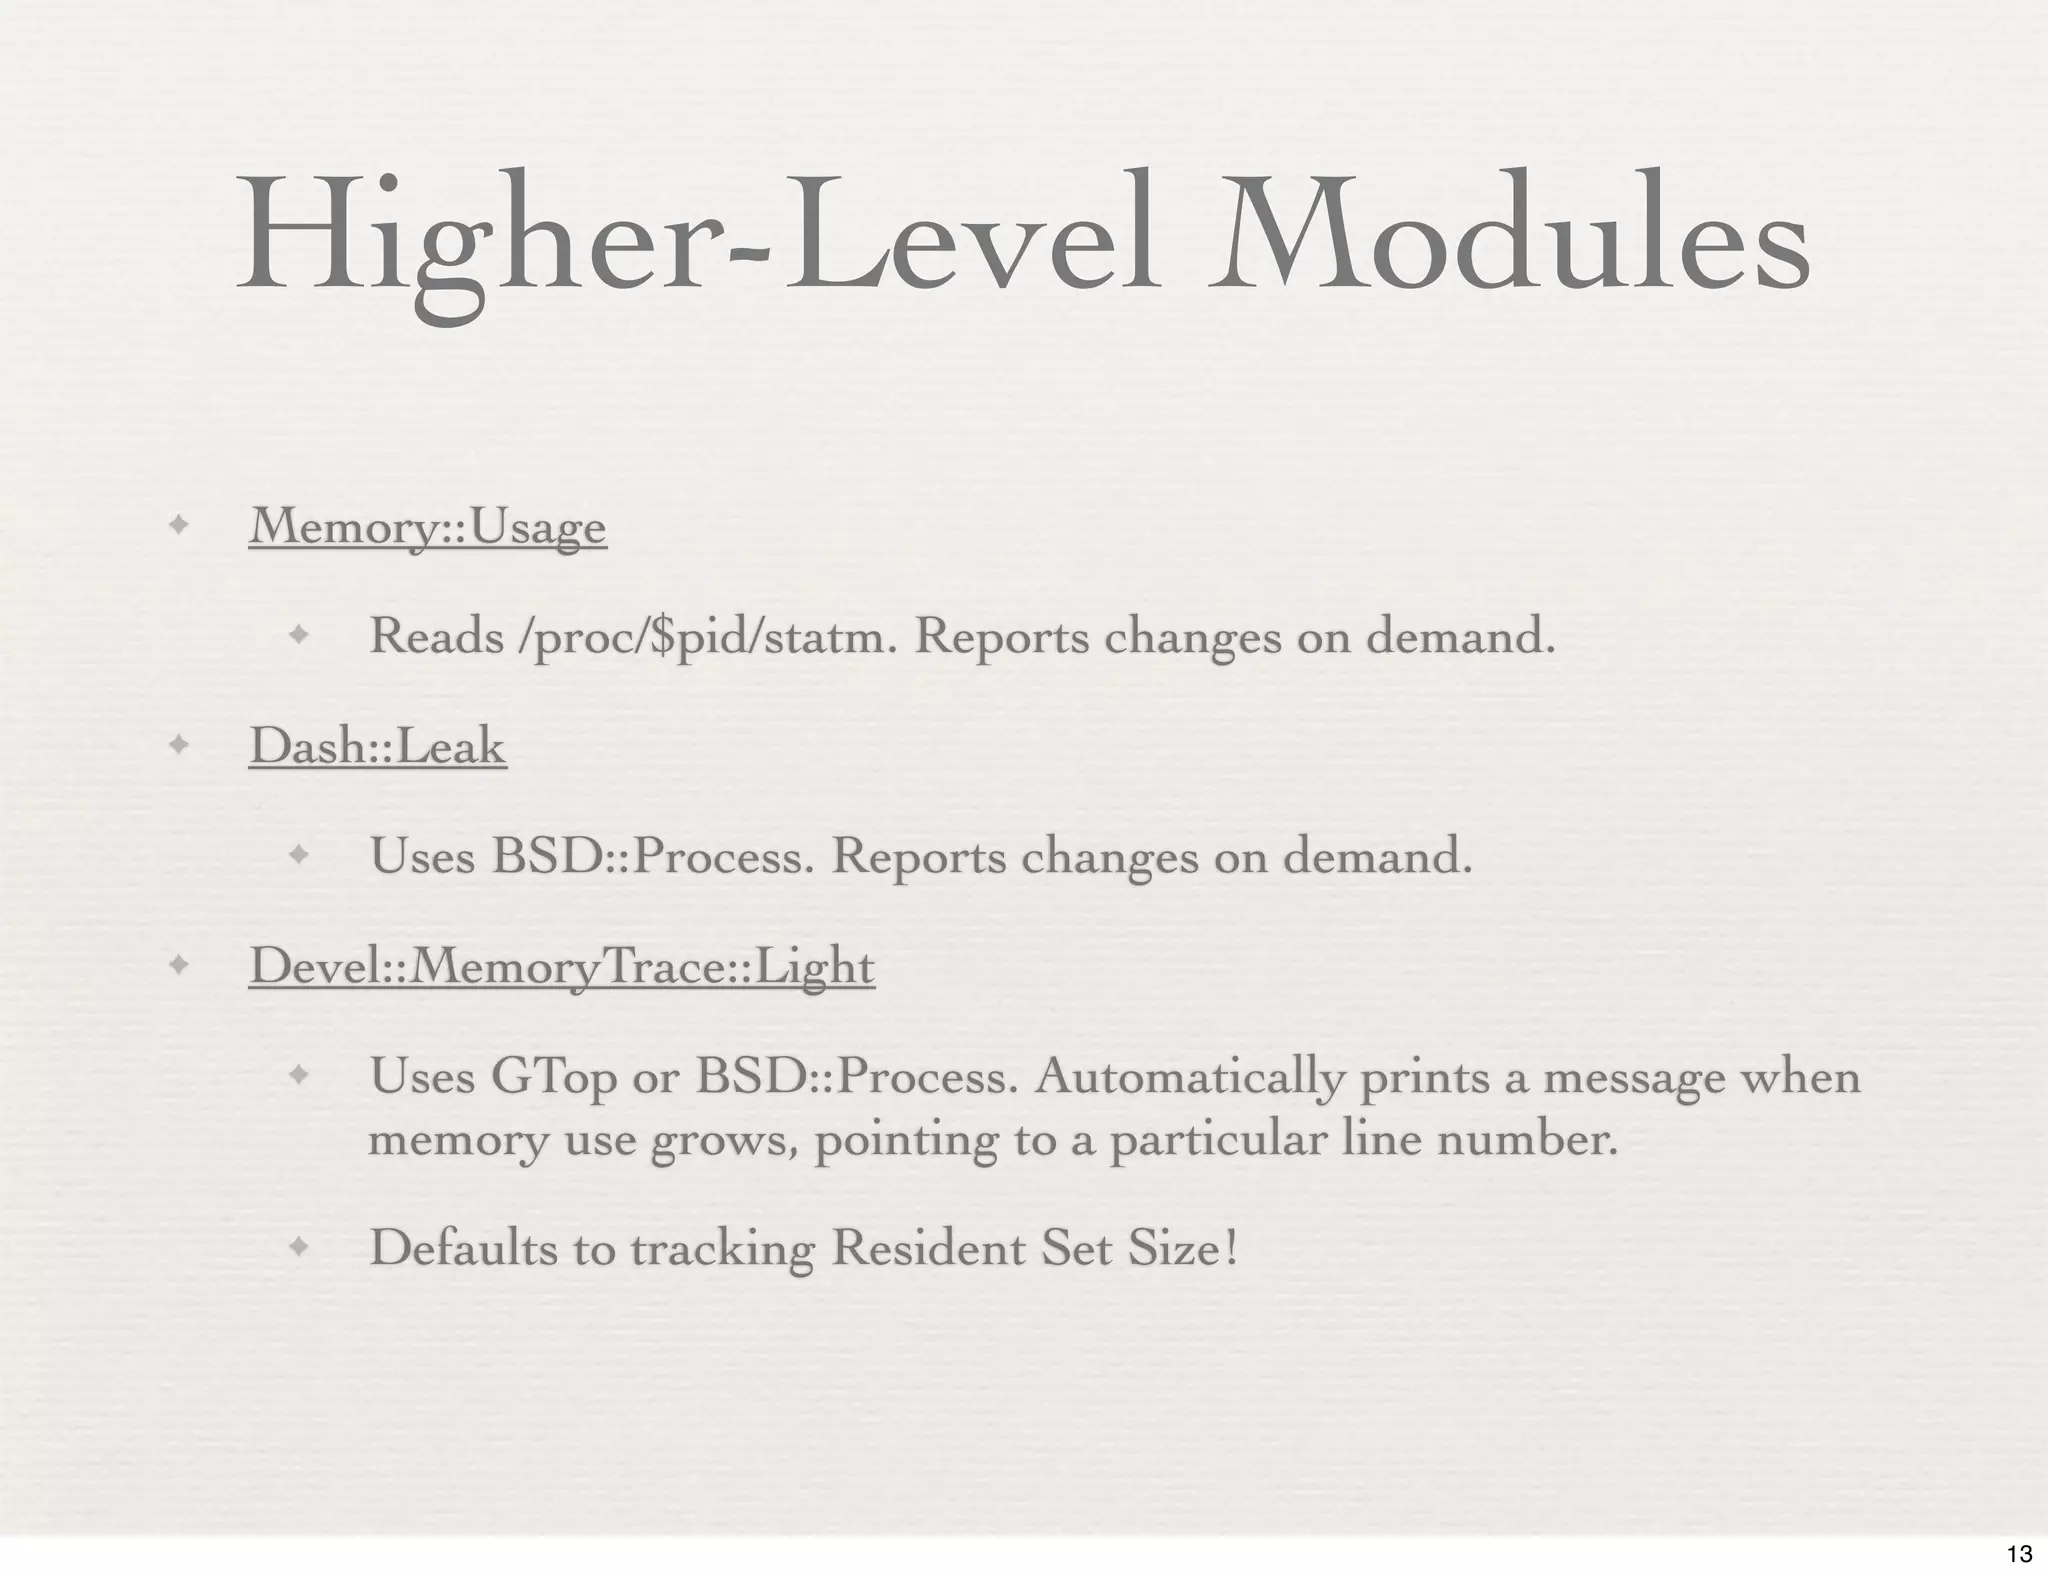
Higher-Level Modules
✦   Memory::Usage
     ✦   Reads /proc/$pid/statm. Reports changes on demand.
✦   Dash::Leak
     ✦   Uses BSD::Process. Reports changes on demand.
✦   Devel::MemoryTrace::Light
     ✦   Uses GTop or BSD::Process. Automatically prints a message when
         memory use grows, pointing to a particular line number.
     ✦   Defaults to tracking Resident Set Size!


                                                                          13
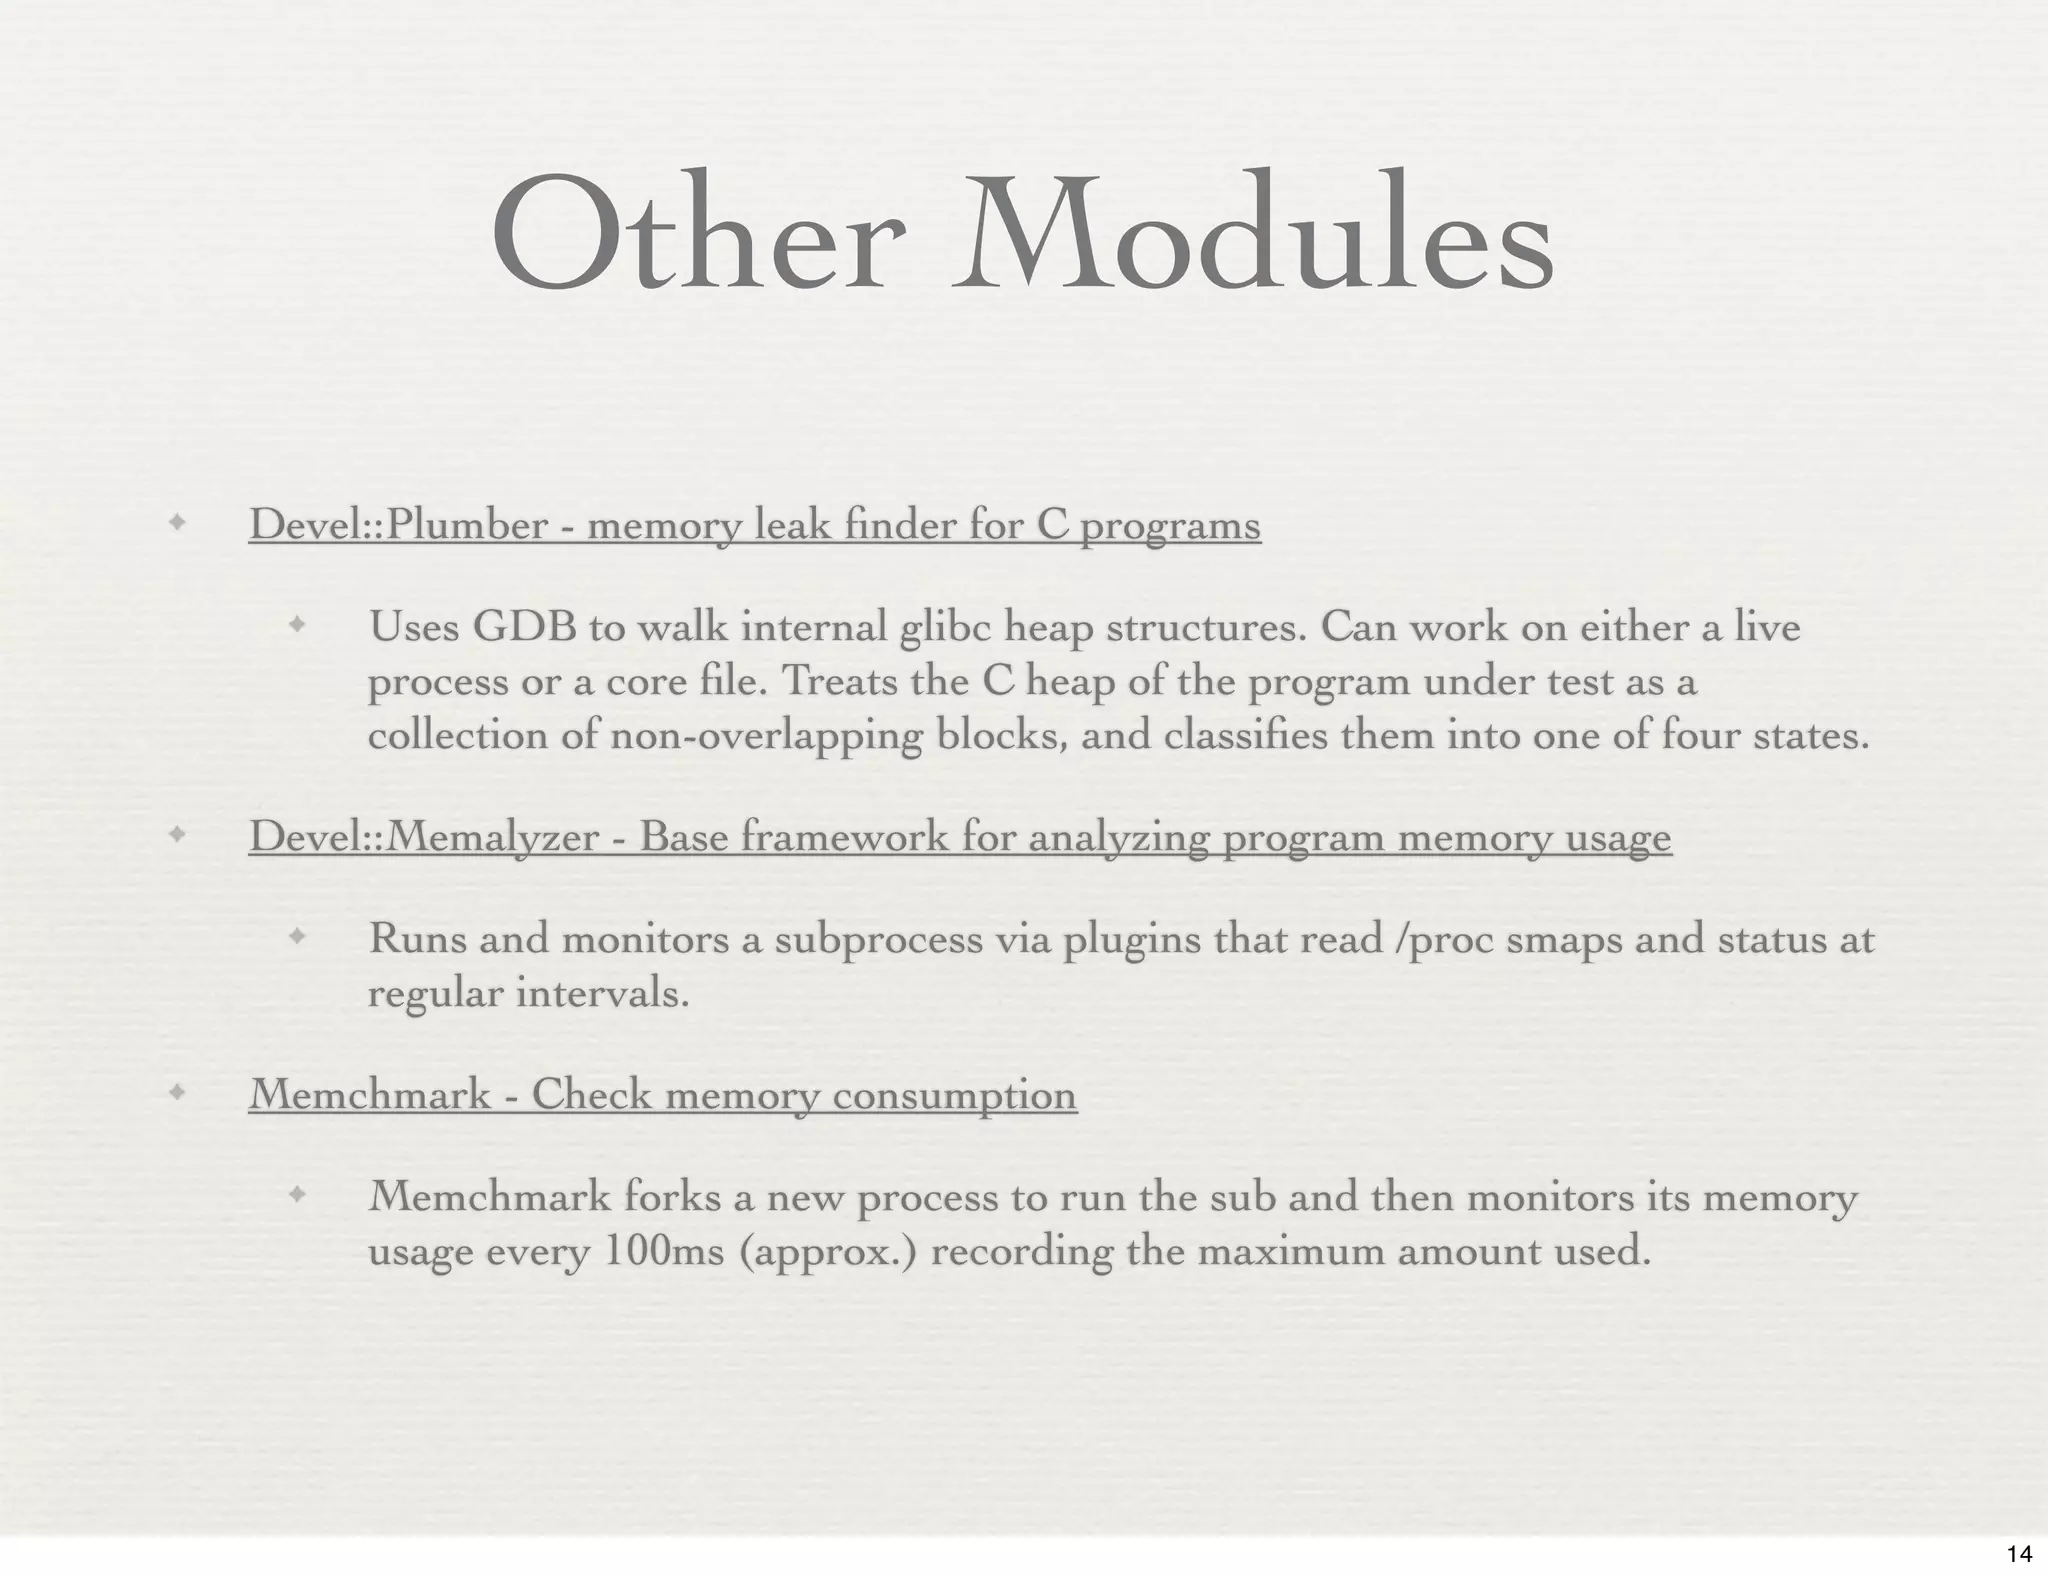
Other Modules
✦   Devel::Plumber - memory leak finder for C programs

     ✦   Uses GDB to walk internal glibc heap structures. Can work on either a live
         process or a core file. Treats the C heap of the program under test as a
         collection of non-overlapping blocks, and classifies them into one of four states.

✦   Devel::Memalyzer - Base framework for analyzing program memory usage

     ✦   Runs and monitors a subprocess via plugins that read /proc smaps and status at
         regular intervals.

✦   Memchmark - Check memory consumption

     ✦   Memchmark forks a new process to run the sub and then monitors its memory
         usage every 100ms (approx.) recording the maximum amount used.


                                                                                             14
A Peak
at The Heap

              15
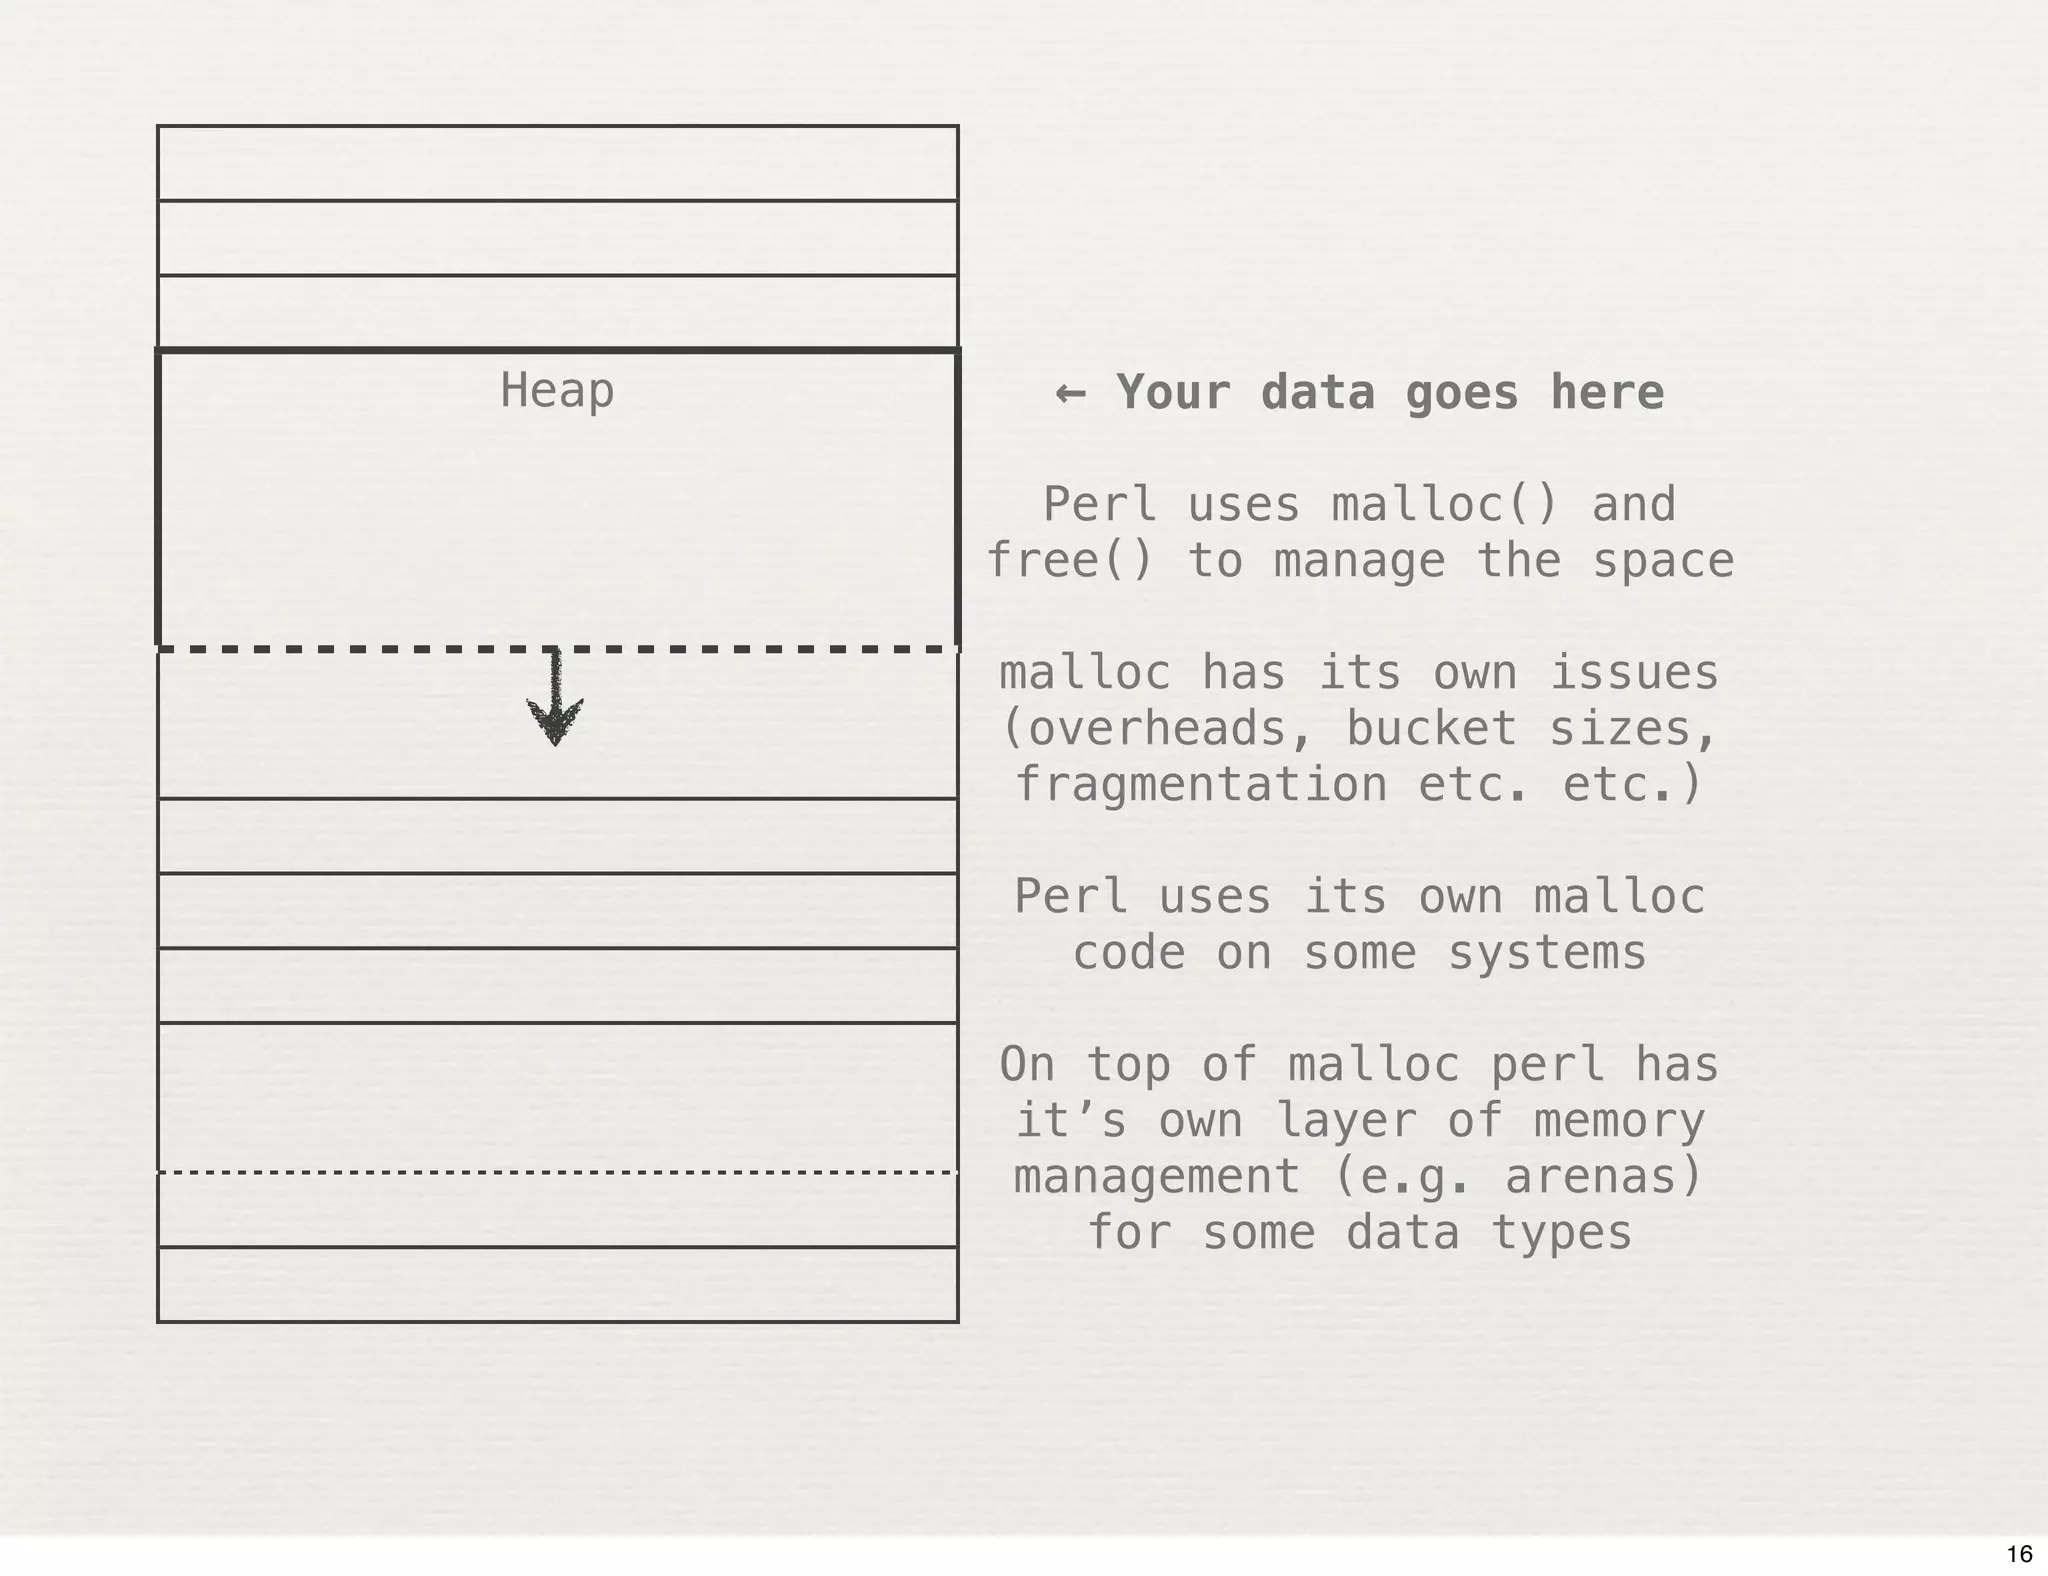
Heap     ← Your data goes here

         Perl uses malloc() and
       free() to manage the space

       malloc has its own issues
       (overheads, bucket sizes,
       fragmentation etc. etc.)

       Perl uses its own malloc
         code on some systems

       On top of malloc perl has
       it’s own layer of memory
       management (e.g. arenas)
          for some data types


                                    16
Perl Data Memory


                   17
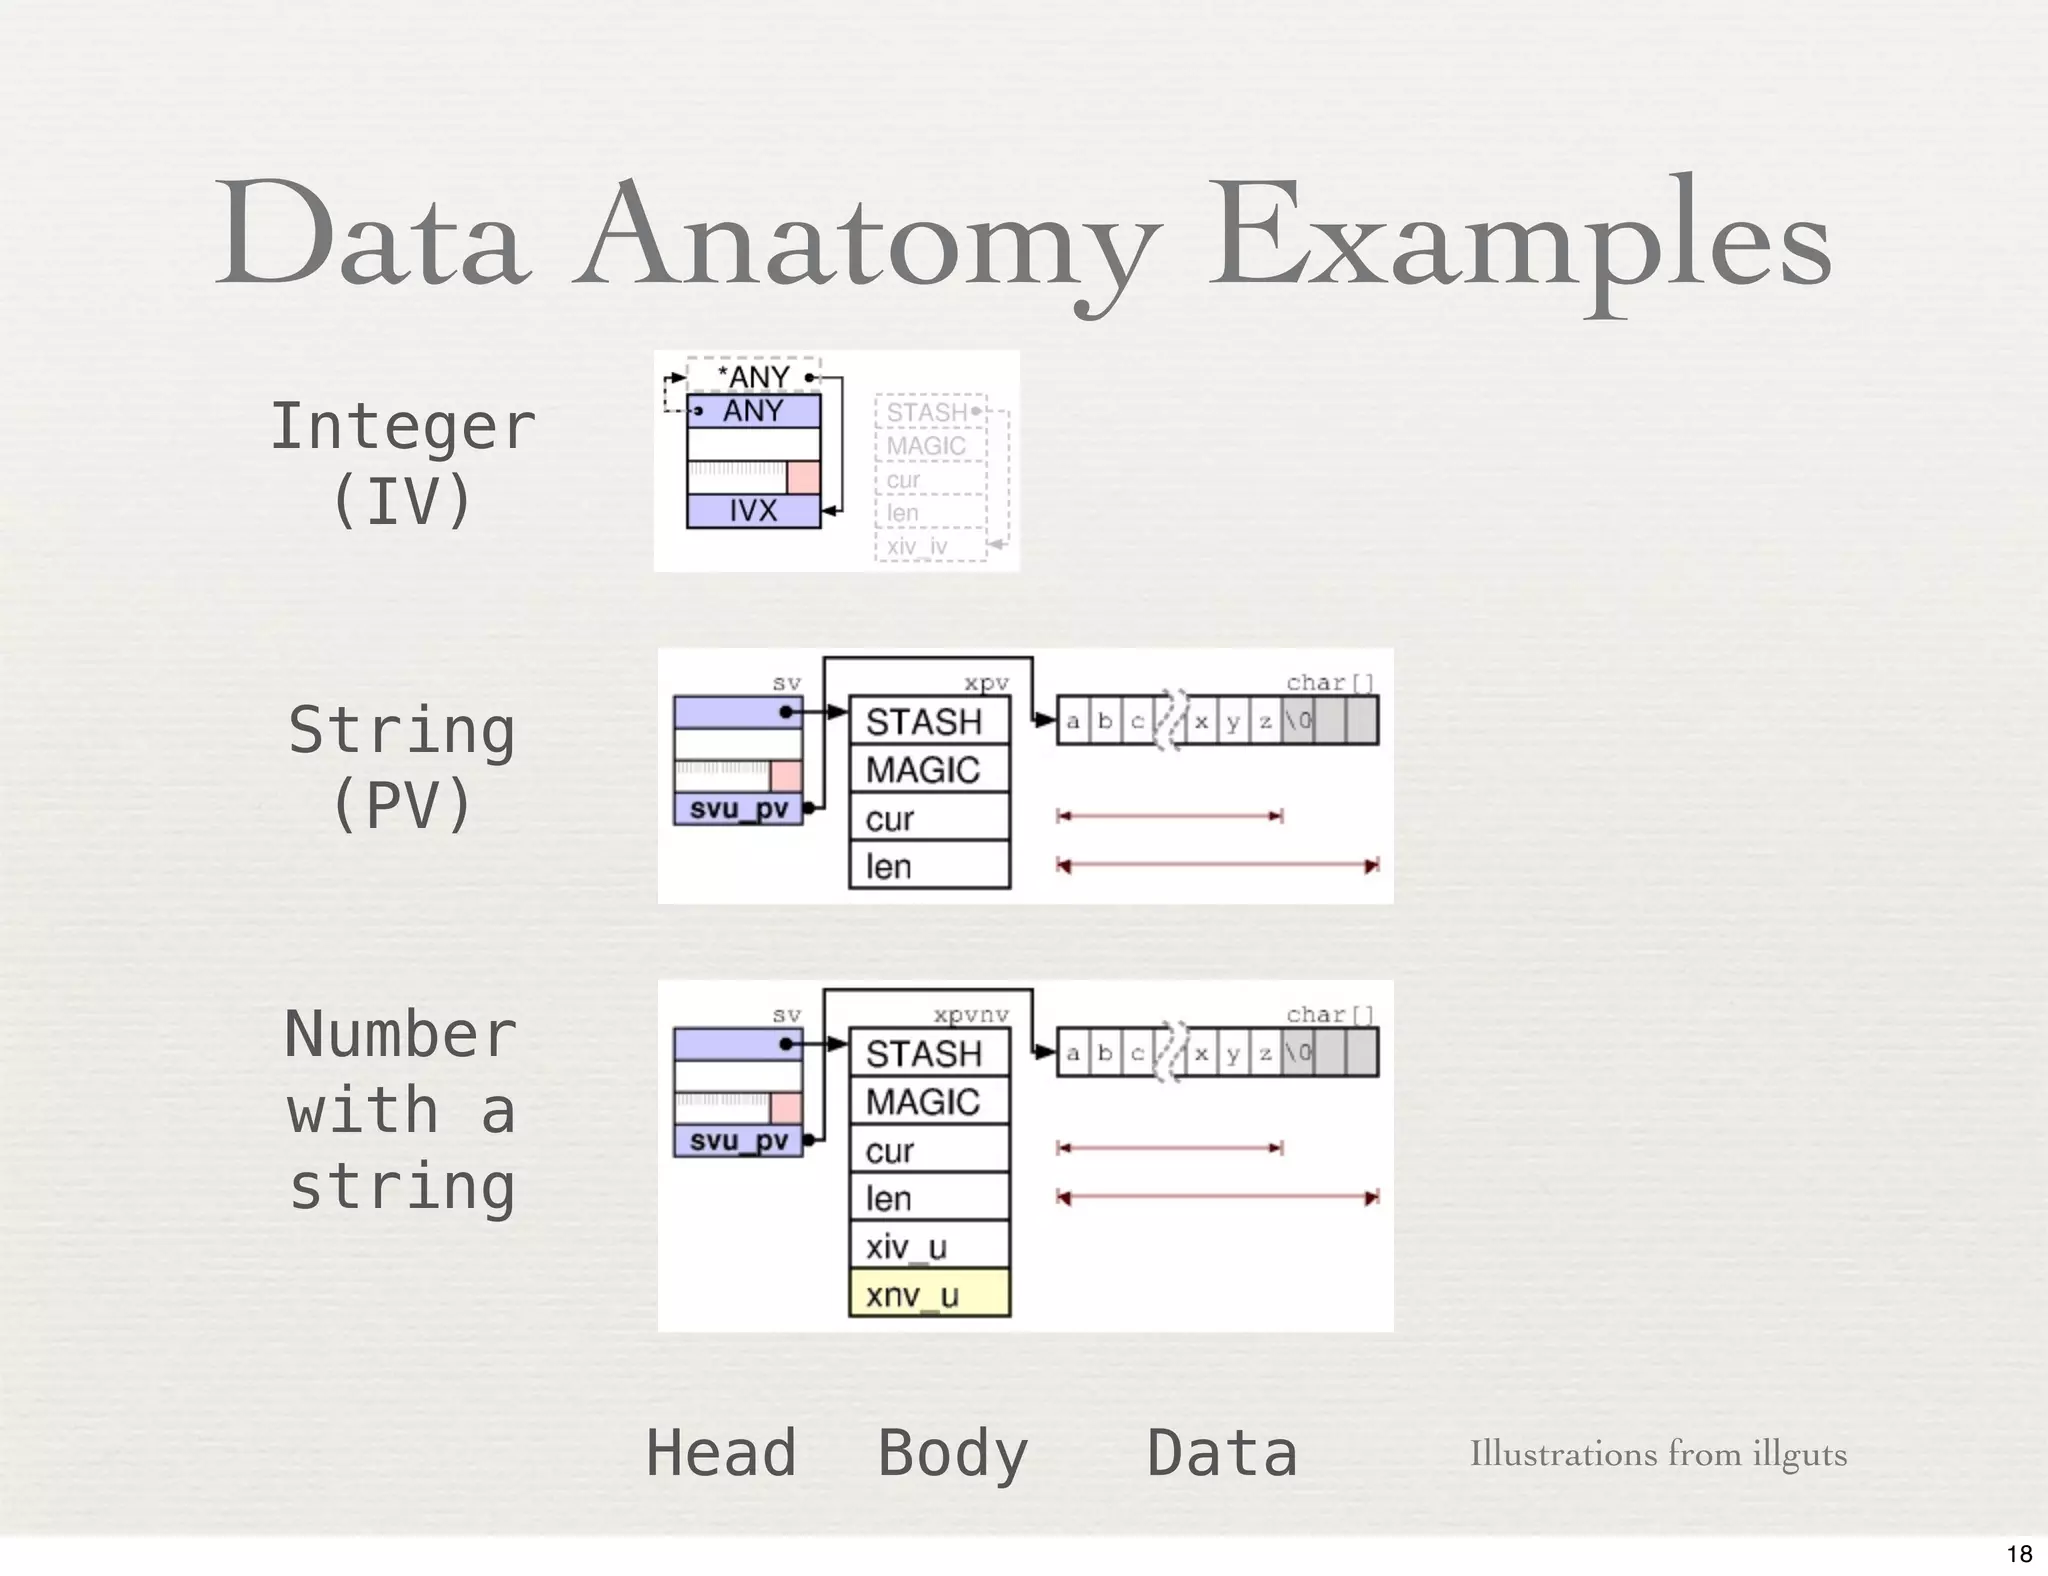
Data Anatomy Examples
Integer
  (IV)


String
 (PV)


Number
with a
string


          Head   Body   Data   Illustrations from illguts

                                                            18
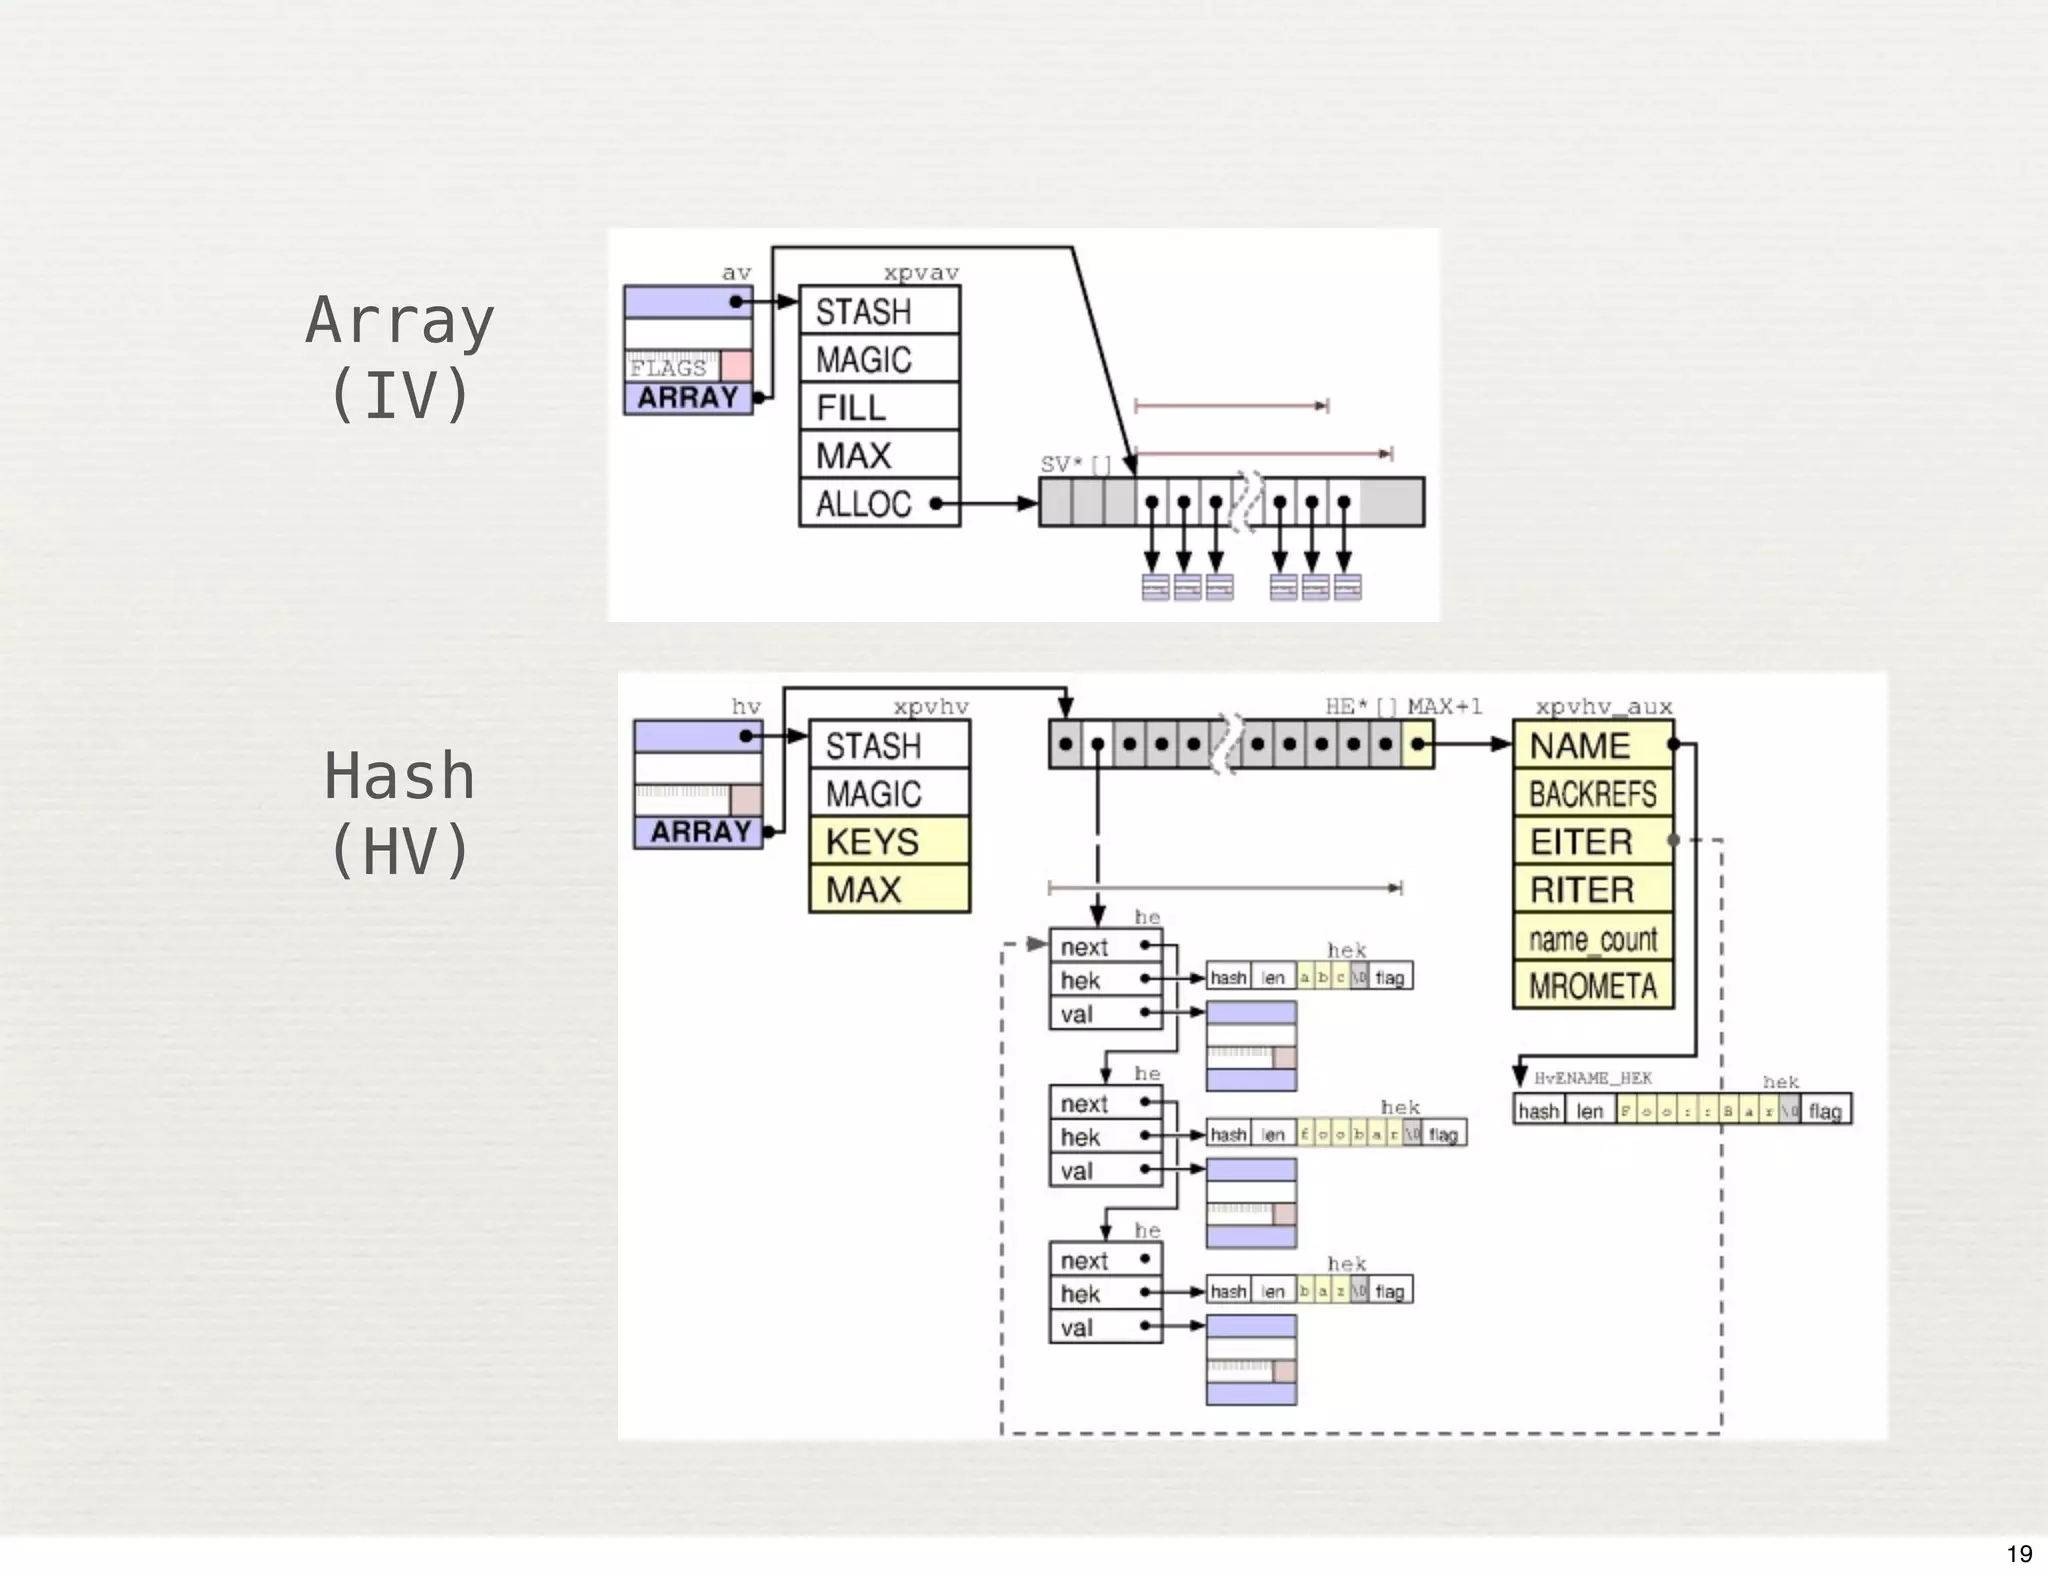
Array
(IV)


Hash
(HV)


        19
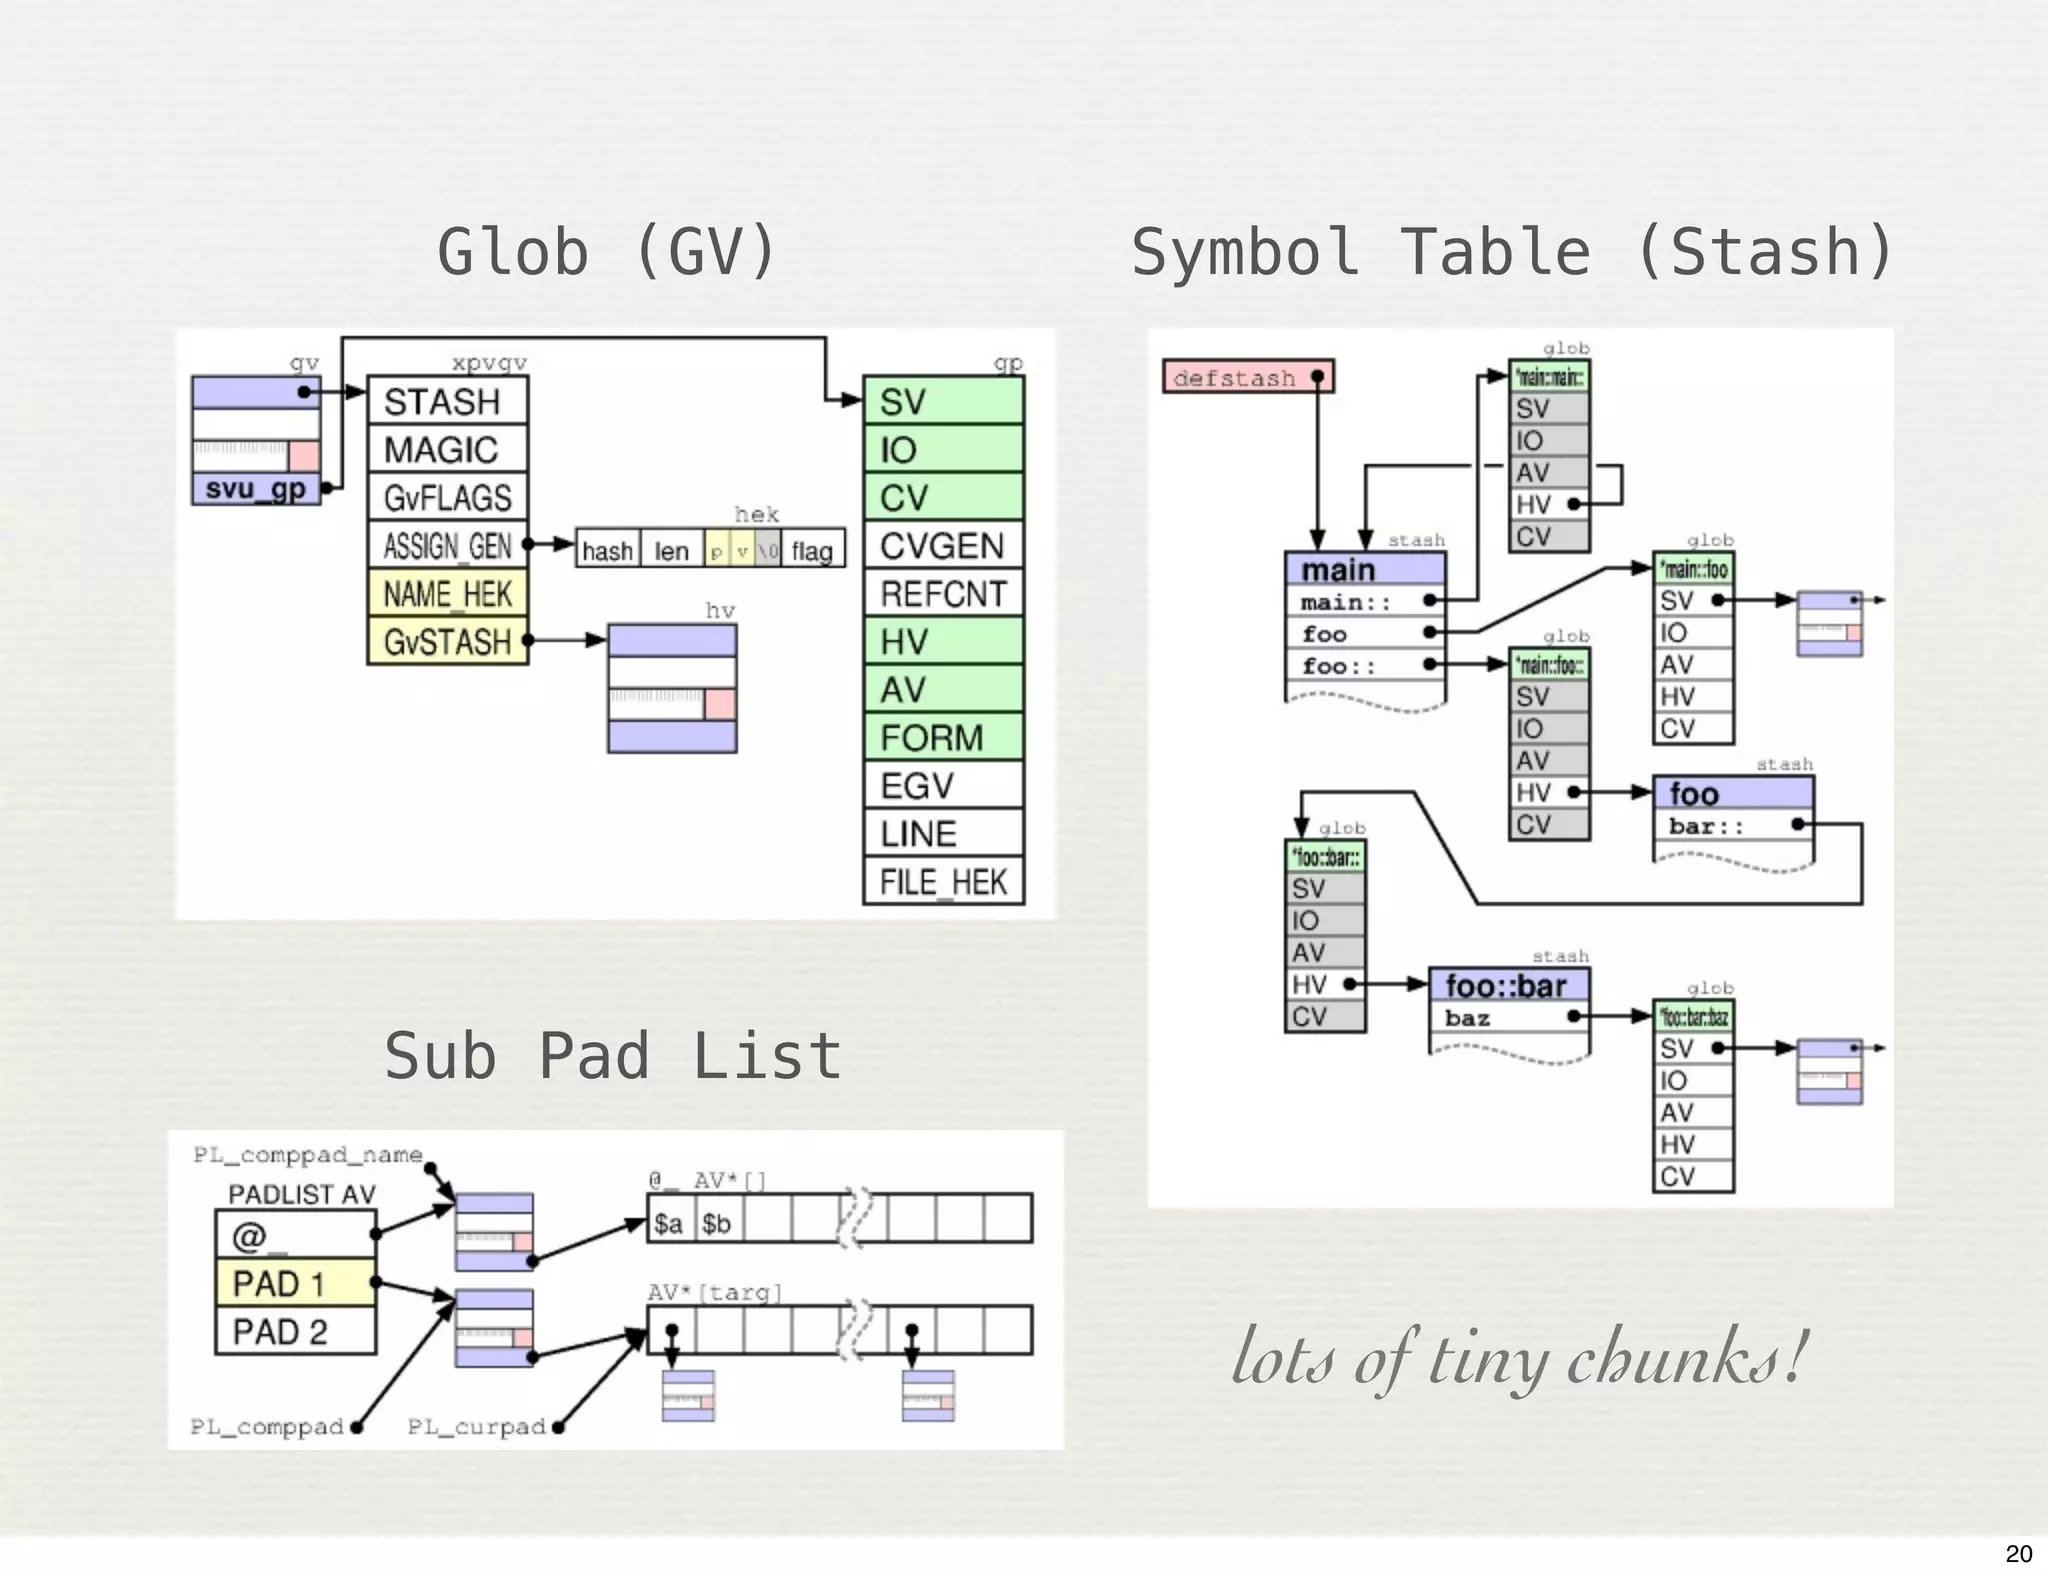
Glob (GV)     Symbol Table (Stash)


Sub Pad List


                 lots of tiny chunks!

                                        20
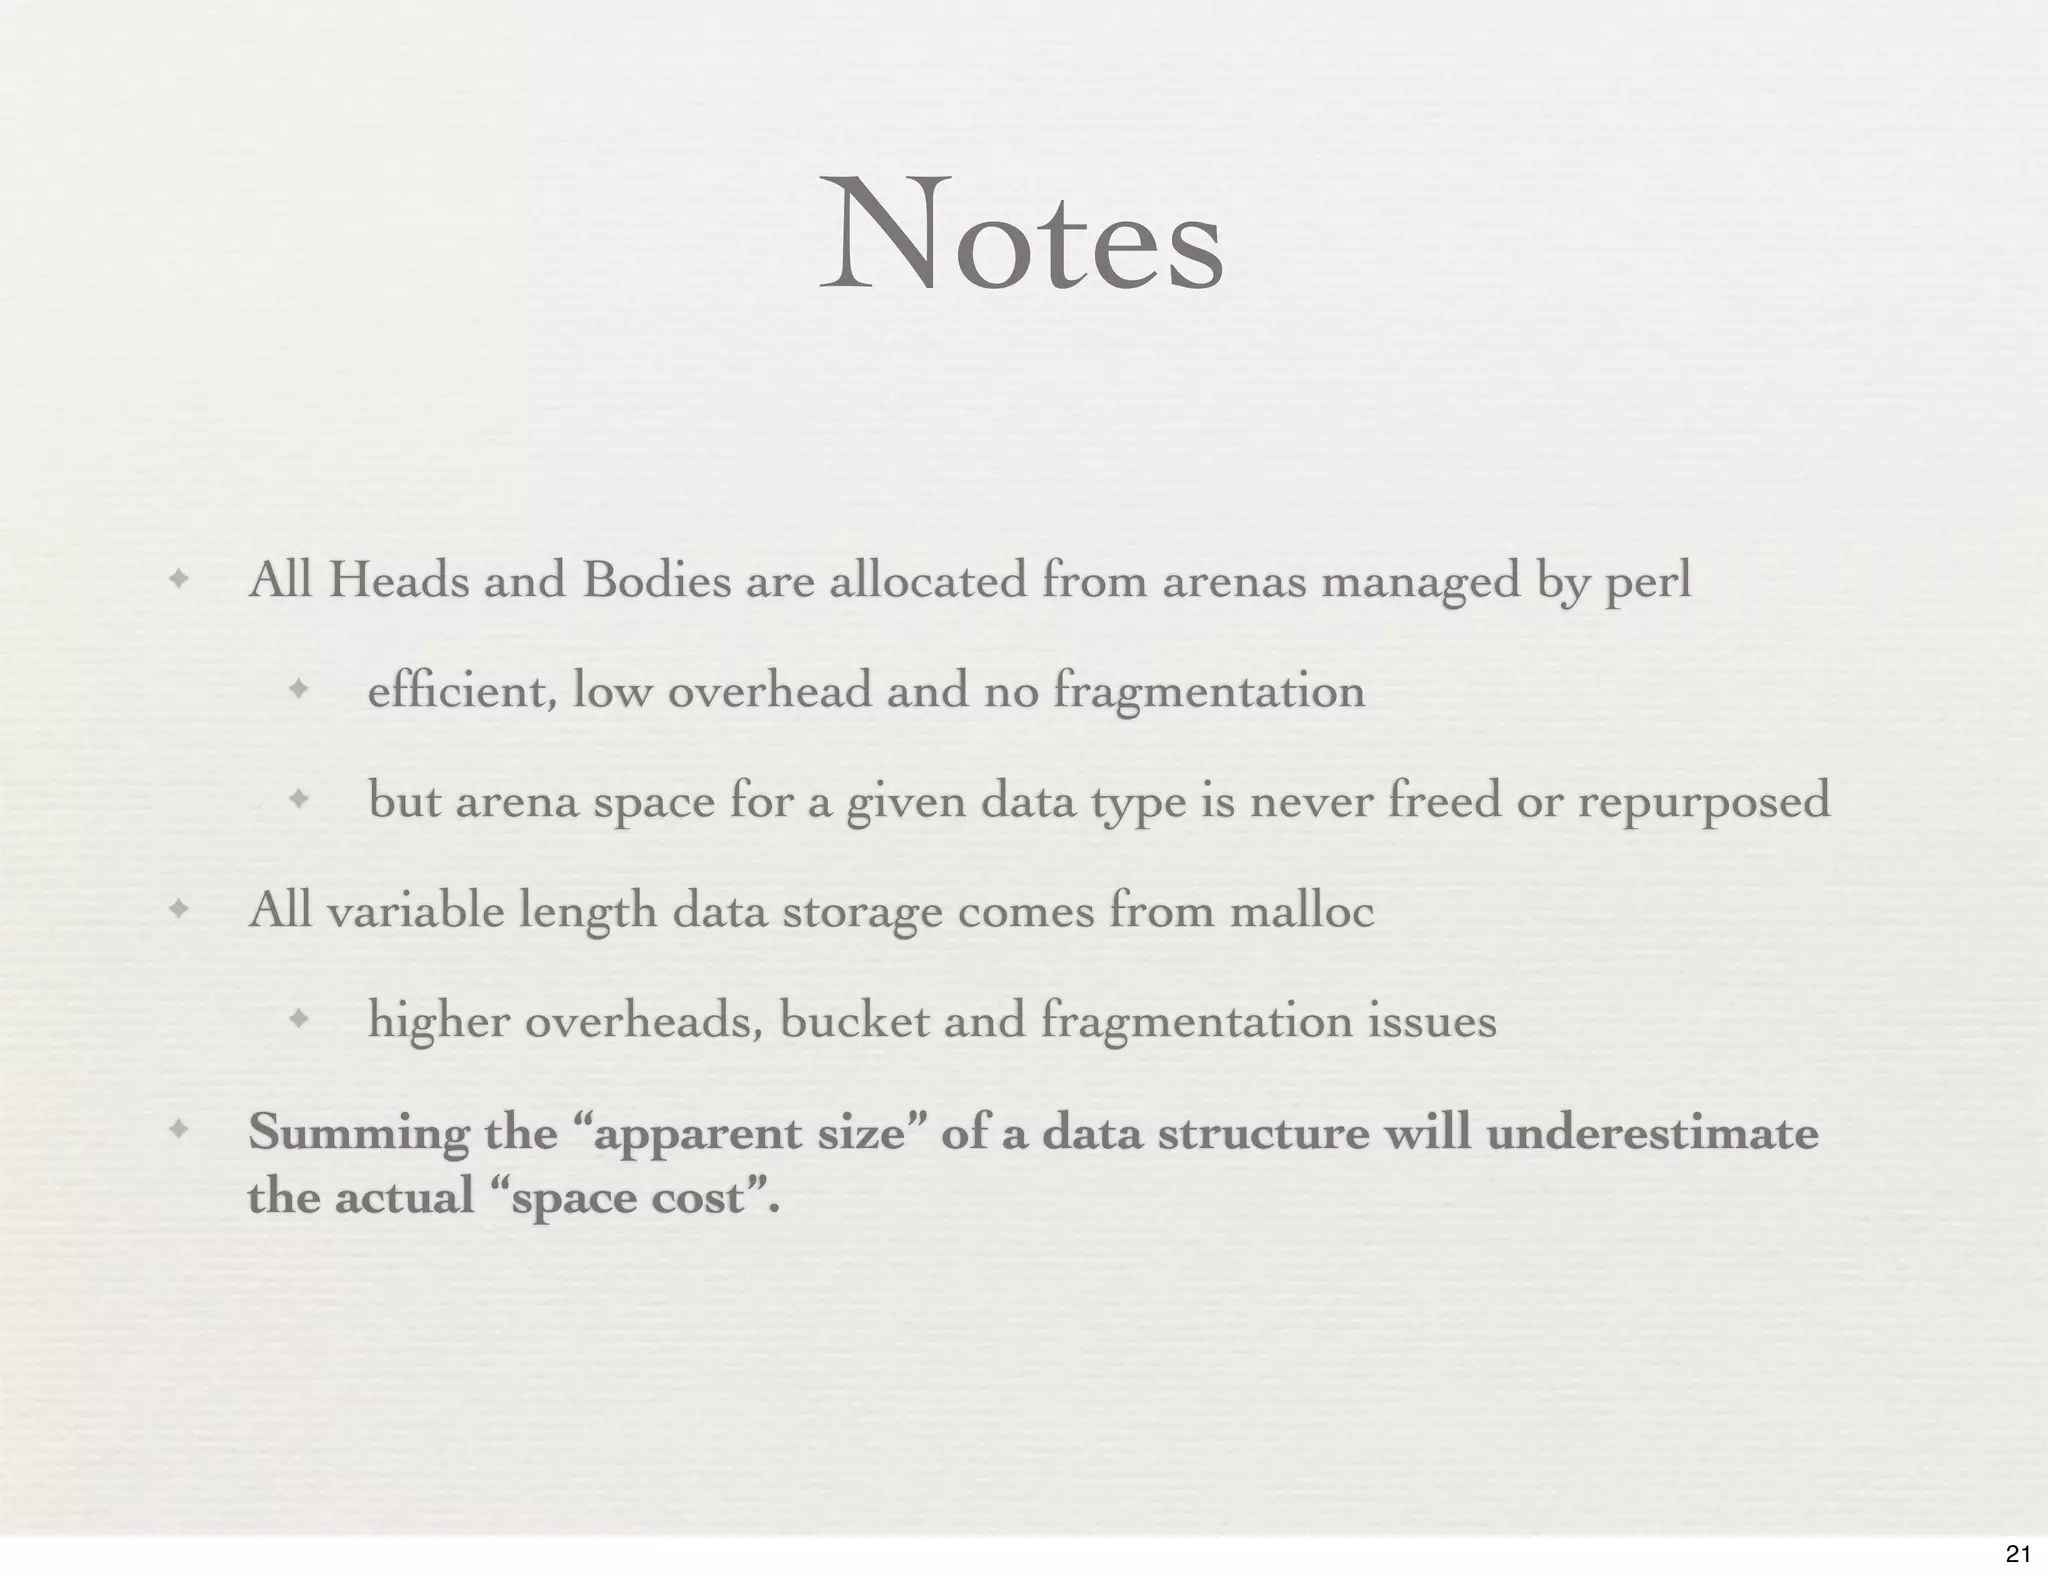
Notes
✦   All Heads and Bodies are allocated from arenas managed by perl
     ✦   efficient, low overhead and no fragmentation
     ✦   but arena space for a given data type is never freed or repurposed
✦   All variable length data storage comes from malloc
     ✦   higher overheads, bucket and fragmentation issues
✦   Summing the “apparent size” of a data structure will underestimate
    the actual “space cost”.


                                                                              21
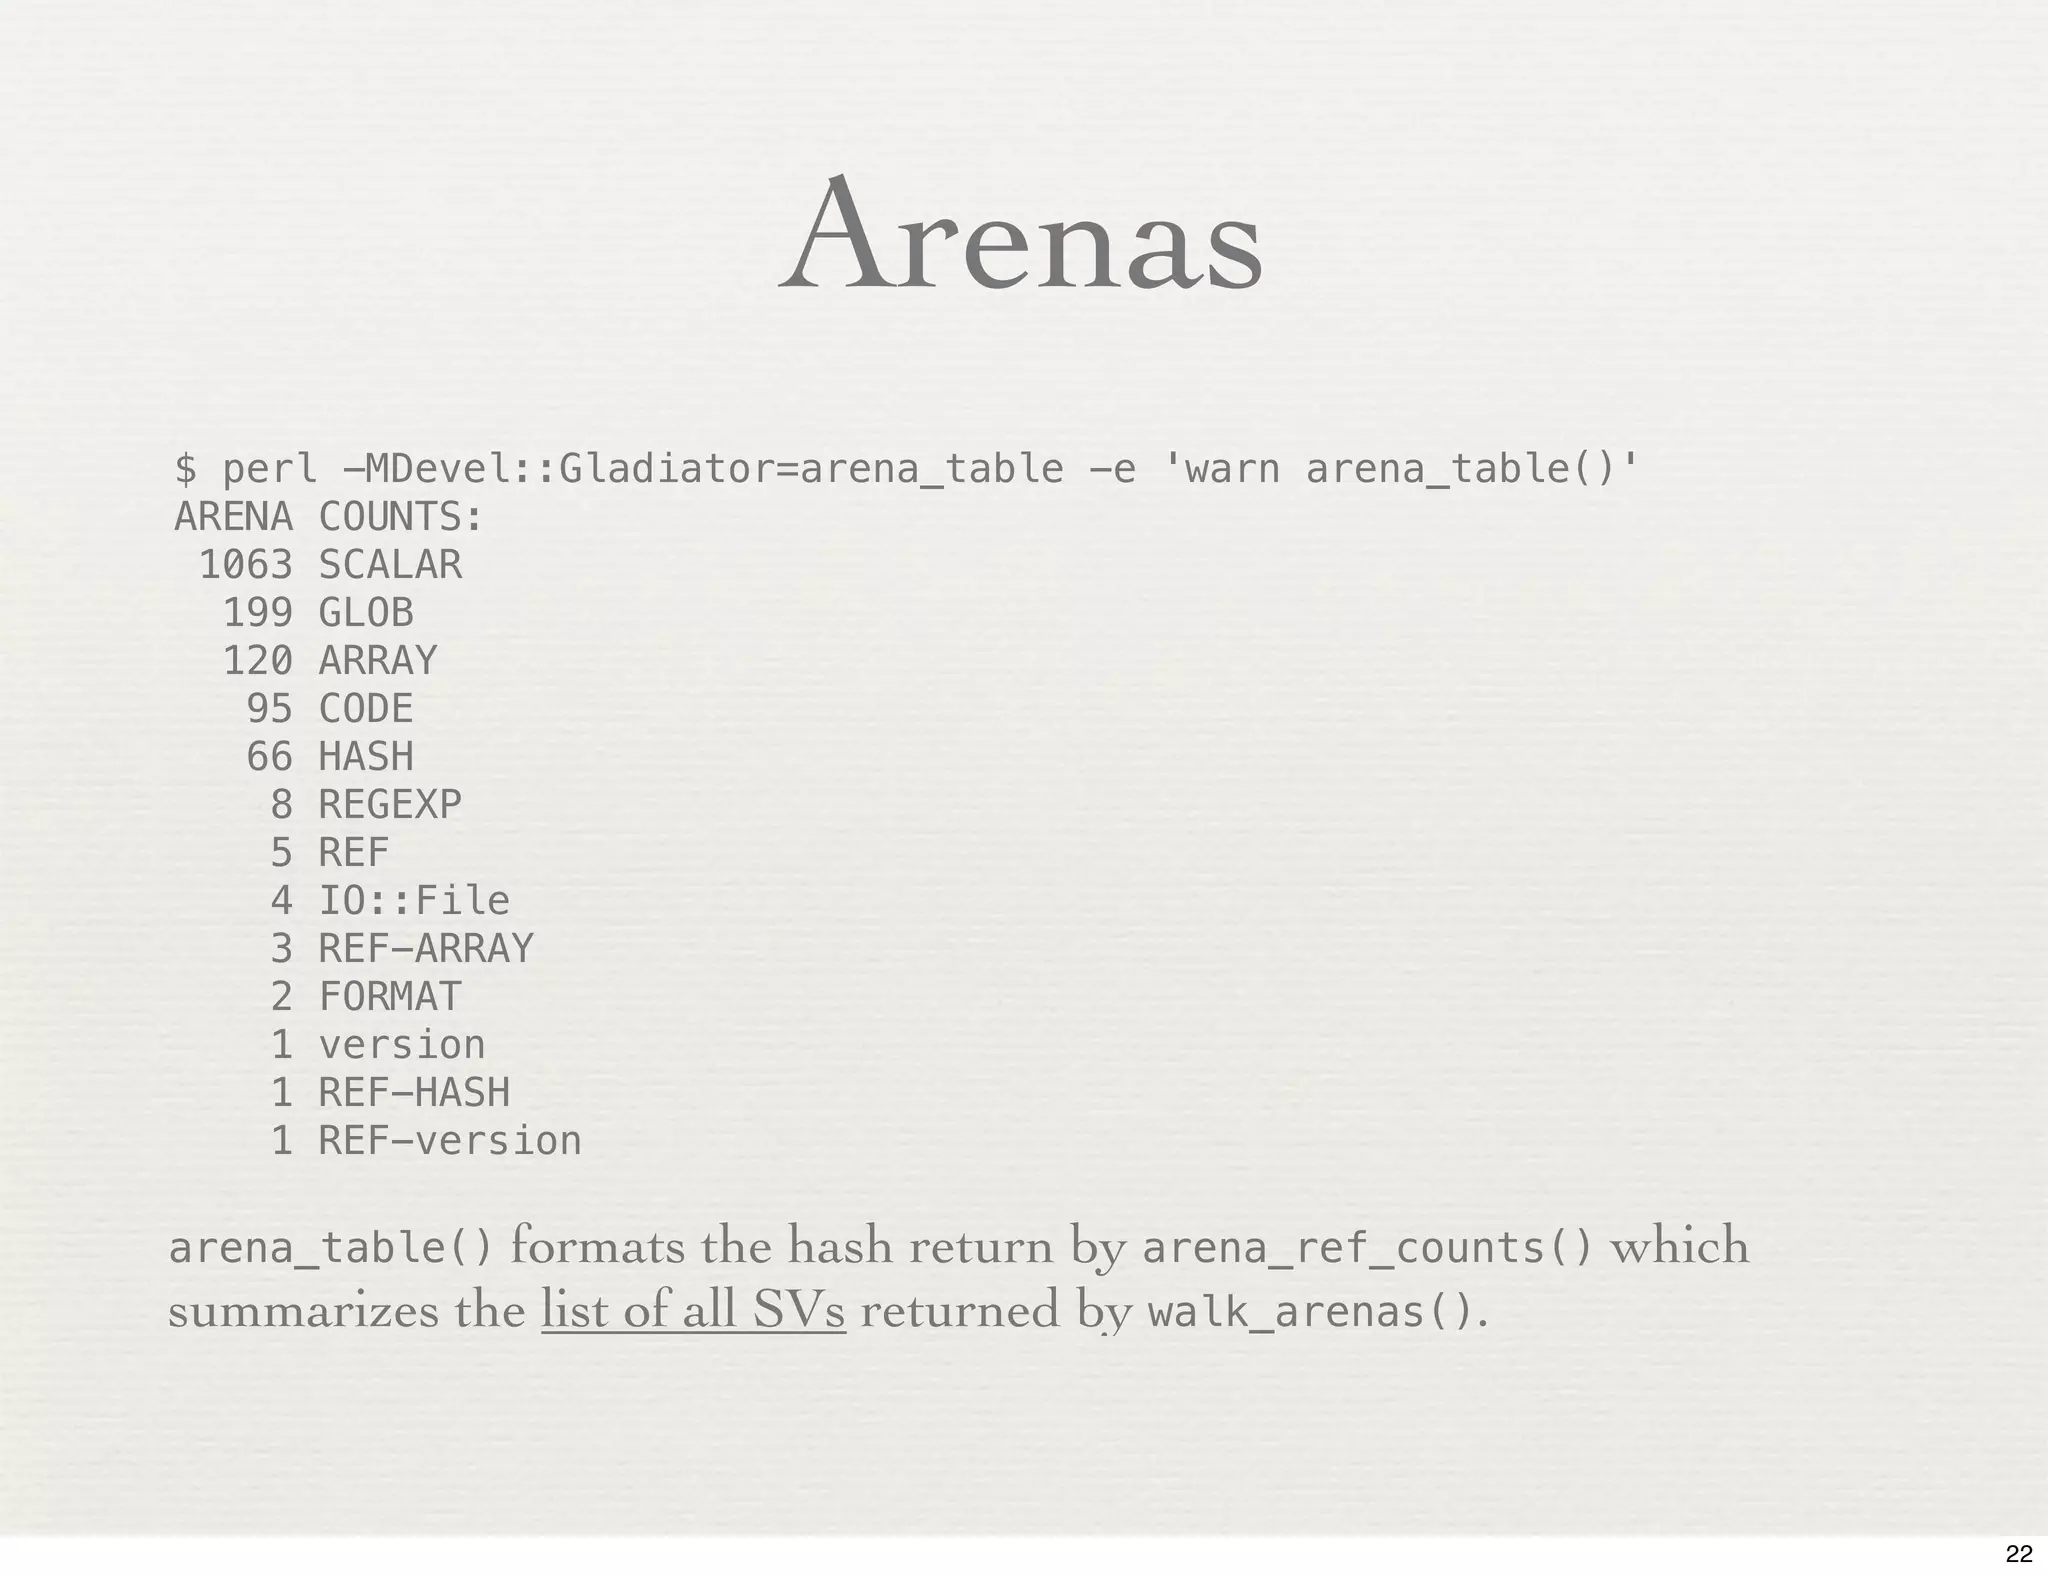
Arenas
$ perl -MDevel::Gladiator=arena_table -e 'warn arena_table()'
ARENA COUNTS:
 1063 SCALAR
  199 GLOB
  120 ARRAY
   95 CODE
   66 HASH
    8 REGEXP
    5 REF
    4 IO::File
    3 REF-ARRAY
    2 FORMAT
    1 version
    1 REF-HASH
    1 REF-version

arena_table()formats the hash return by arena_ref_counts() which
summarizes the list of all SVs returned by walk_arenas().


                                                                   22
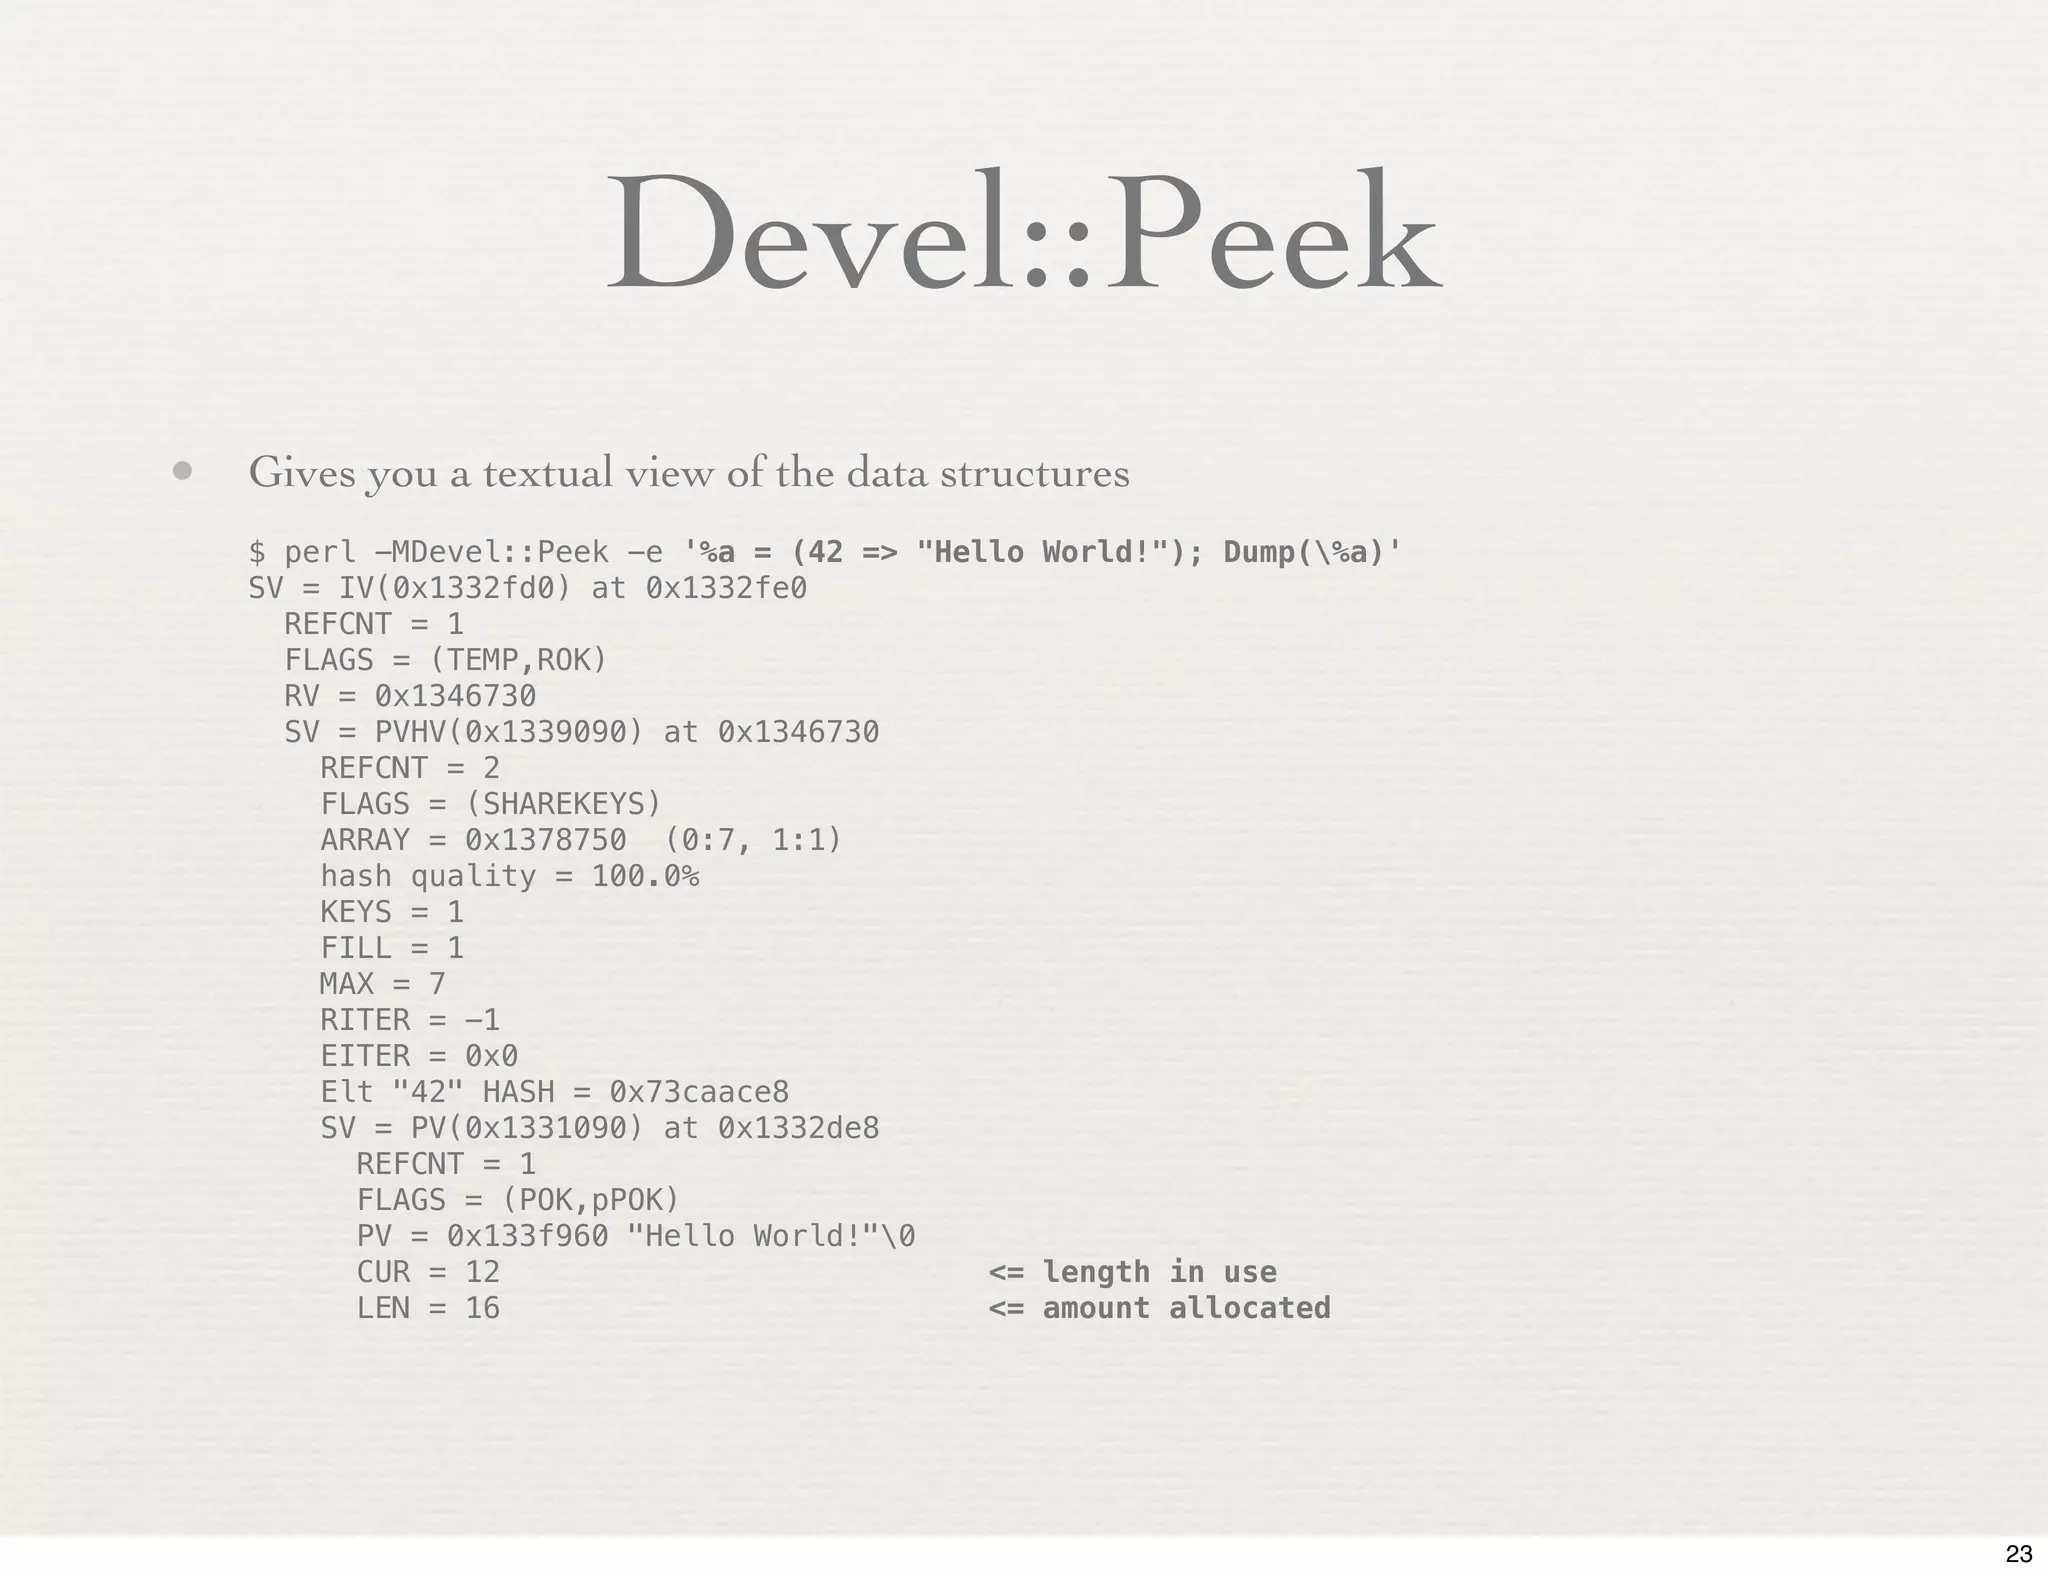
Devel::Peek
• Gives you a textual view of the data structures
    $ perl -MDevel::Peek -e '%a = (42 => "Hello World!"); Dump(%a)'
    SV = IV(0x1332fd0) at 0x1332fe0
      REFCNT = 1
      FLAGS = (TEMP,ROK)
      RV = 0x1346730
      SV = PVHV(0x1339090) at 0x1346730
        REFCNT = 2
        FLAGS = (SHAREKEYS)
        ARRAY = 0x1378750 (0:7, 1:1)
        hash quality = 100.0%
        KEYS = 1
        FILL = 1
        MAX = 7
        RITER = -1
        EITER = 0x0
        Elt "42" HASH = 0x73caace8
        SV = PV(0x1331090) at 0x1332de8
          REFCNT = 1
          FLAGS = (POK,pPOK)
          PV = 0x133f960 "Hello World!"0
          CUR = 12                           <= length in use
          LEN = 16                           <= amount allocated


                                                                       23
Devel::Size
• Gives you a measure of the size of a data structures
    $ perl -MDevel::Size=total_size -Minteger -le 'print total_size( 0 )'
    24

    $ perl -MDevel::Size=total_size -Minteger -le 'print total_size( [] )'
    64

    $ perl -MDevel::Size=total_size -Minteger -le 'print total_size( {} )'
    120

    $ perl -MDevel::Size=total_size -le 'print total_size( [ 1..100 ] )'
    3264

•   Makes somewhat arbitrary decisions about what to include for non-data types
•   Doesn't or can't accurately measure subs, forms, regexes, and IOs.
•   Can't measure 'everything' (total_size(%main::) is the best we can do)
•   But it's generally accurate for typical use and is very fast.


                                                                                  24
Space in Hiding
✦   Perl tends to use memory to save time
✦   This can lead to surprises, for example:
     ✦   sub foo { my $var = "#" x 2**20; }
         foo();     # ~1MB still used after return
     ✦   sub bar{
           my $var = "#" x 2**20;
           bar($_[0]-1) if $_[0]; # recurse
         }
         bar(50); # ~50MB still used after return


                                                     25
Devel::Size 0.77
   perl -MDevel::Size=total_size -we '
     sub foo { my $var = "#" x 2**20; foo($_[0]-1) if $_[0]; 1 }
     system("grep VmData /proc/$$/status");
     printf "%d kBn", total_size(&foo)/1024;
     foo(50);
     system("grep VmData /proc/$$/status");
     printf "%d kBn", total_size(&foo)/1024;
   '

   VmData:!       796 kB
   7 kB
   VmData:!   105652 kB
   8 kB

• VmData grew by ~100MB but we expected ~50MB. Not sure why.
• Devel::Size 0.77 doesn't measure what's in sub pads (lexicals).


                                                                    26
Devel::Size 0.77 + hacks
    perl -MDevel::Size=total_size -we '
      sub foo { my $var = "#" x 2**20; foo($_[0]-1) if $_[0];1 }
      system("grep VmData /proc/$$/status");
      printf "%d kBn", total_size(&foo)/1024;
      foo(50);
      system("grep VmData /proc/$$/status");
      printf "%d kBn", total_size(&foo)/1024;
    '

    VmData:!    796 kB
    293 kB
    VmData:! 105656 kB
    104759 kB

• Now does include the pad variables.
• But note the 293 kB initial value - it's measuring too much. Work in progress.


                                                                                   27
Devel::Size 0.77 + hacks
$ report='printf "total_size %6d kBn", total_size(%main::)/1024;
system("grep VmData /proc/$$/status")'

$ perl          -MDevel::Size=total_size -we “$report”
total_size     290 kB
VmData:        800 kB

$ perl -MMoose -MDevel::Size=total_size -we “$report”
total_size   9474 kB!   [ 9474-290 = + 9184 kB ]
VmData:     11824 kB!   [ 11824-800 = +11024 kB ]

What accounts for the 1840 kB difference in the increases?
    -Arenas and other perl-internals aren't included
    -Limitations of Devel::Size measuring subs and regexs
    -Malloc heap buckets and fragmentation


                                                                     28
Malloc and
The Heap

             29
“Malloc and
 The Heap”

              30
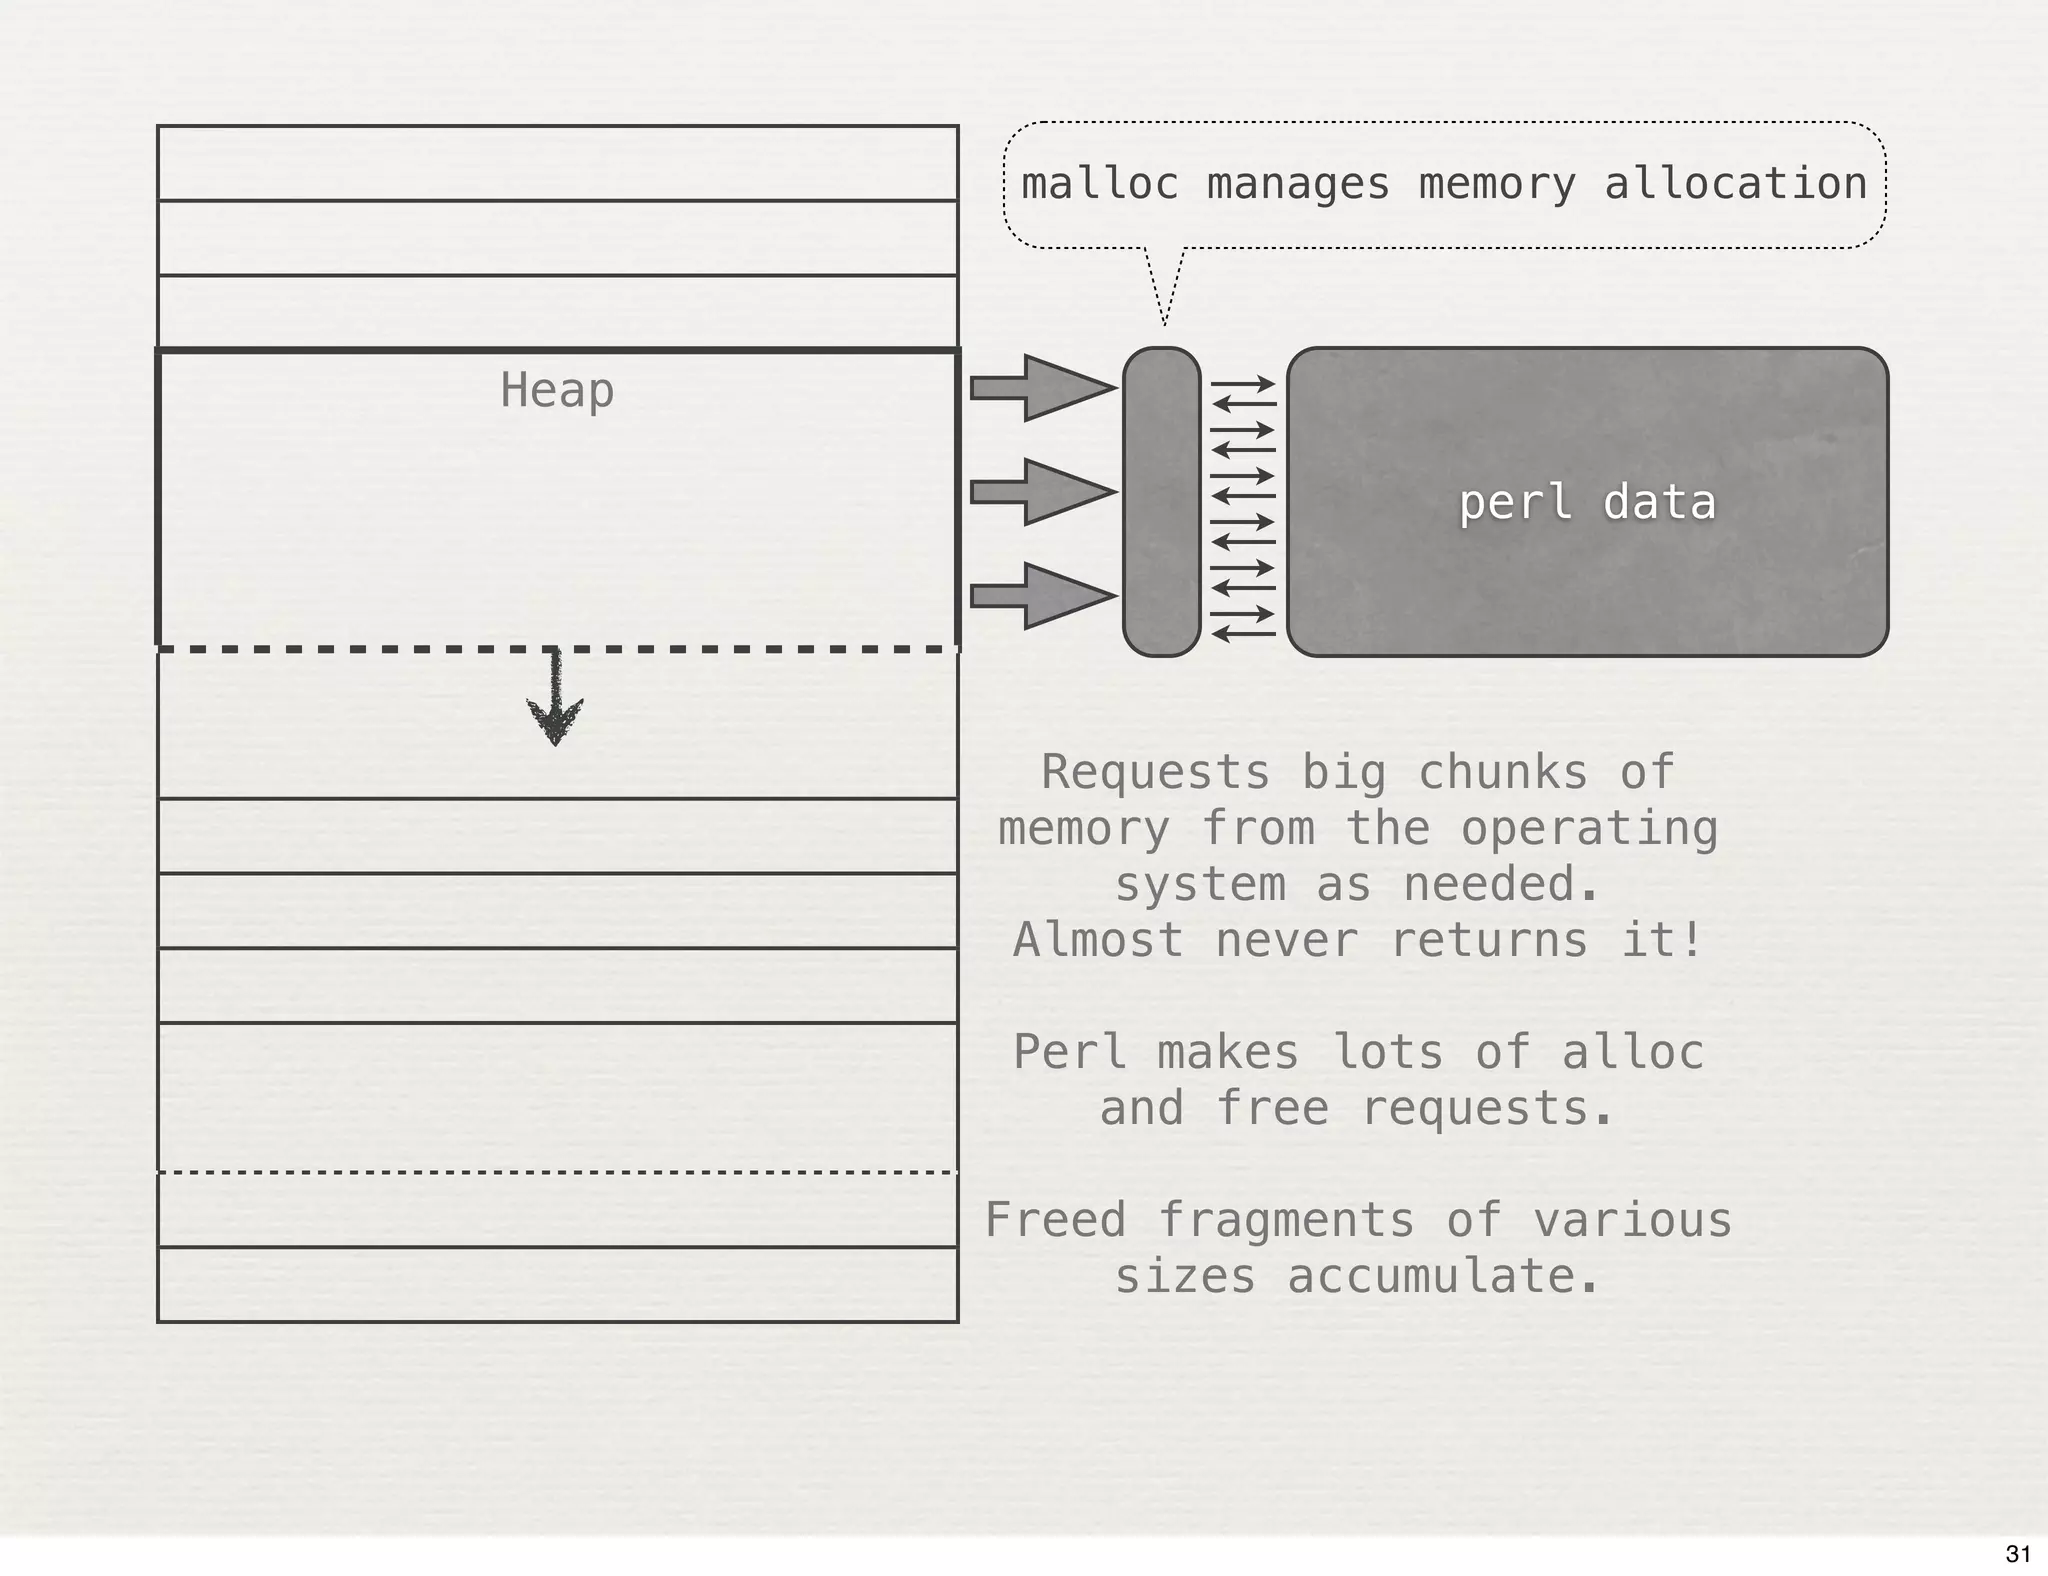
malloc manages memory allocation


Heap

                        perl data


        Requests big chunks of
       memory from the operating
           system as needed.
       Almost never returns it!

       Perl makes lots of alloc
          and free requests.

       Freed fragments of various
           sizes accumulate.


                                           31
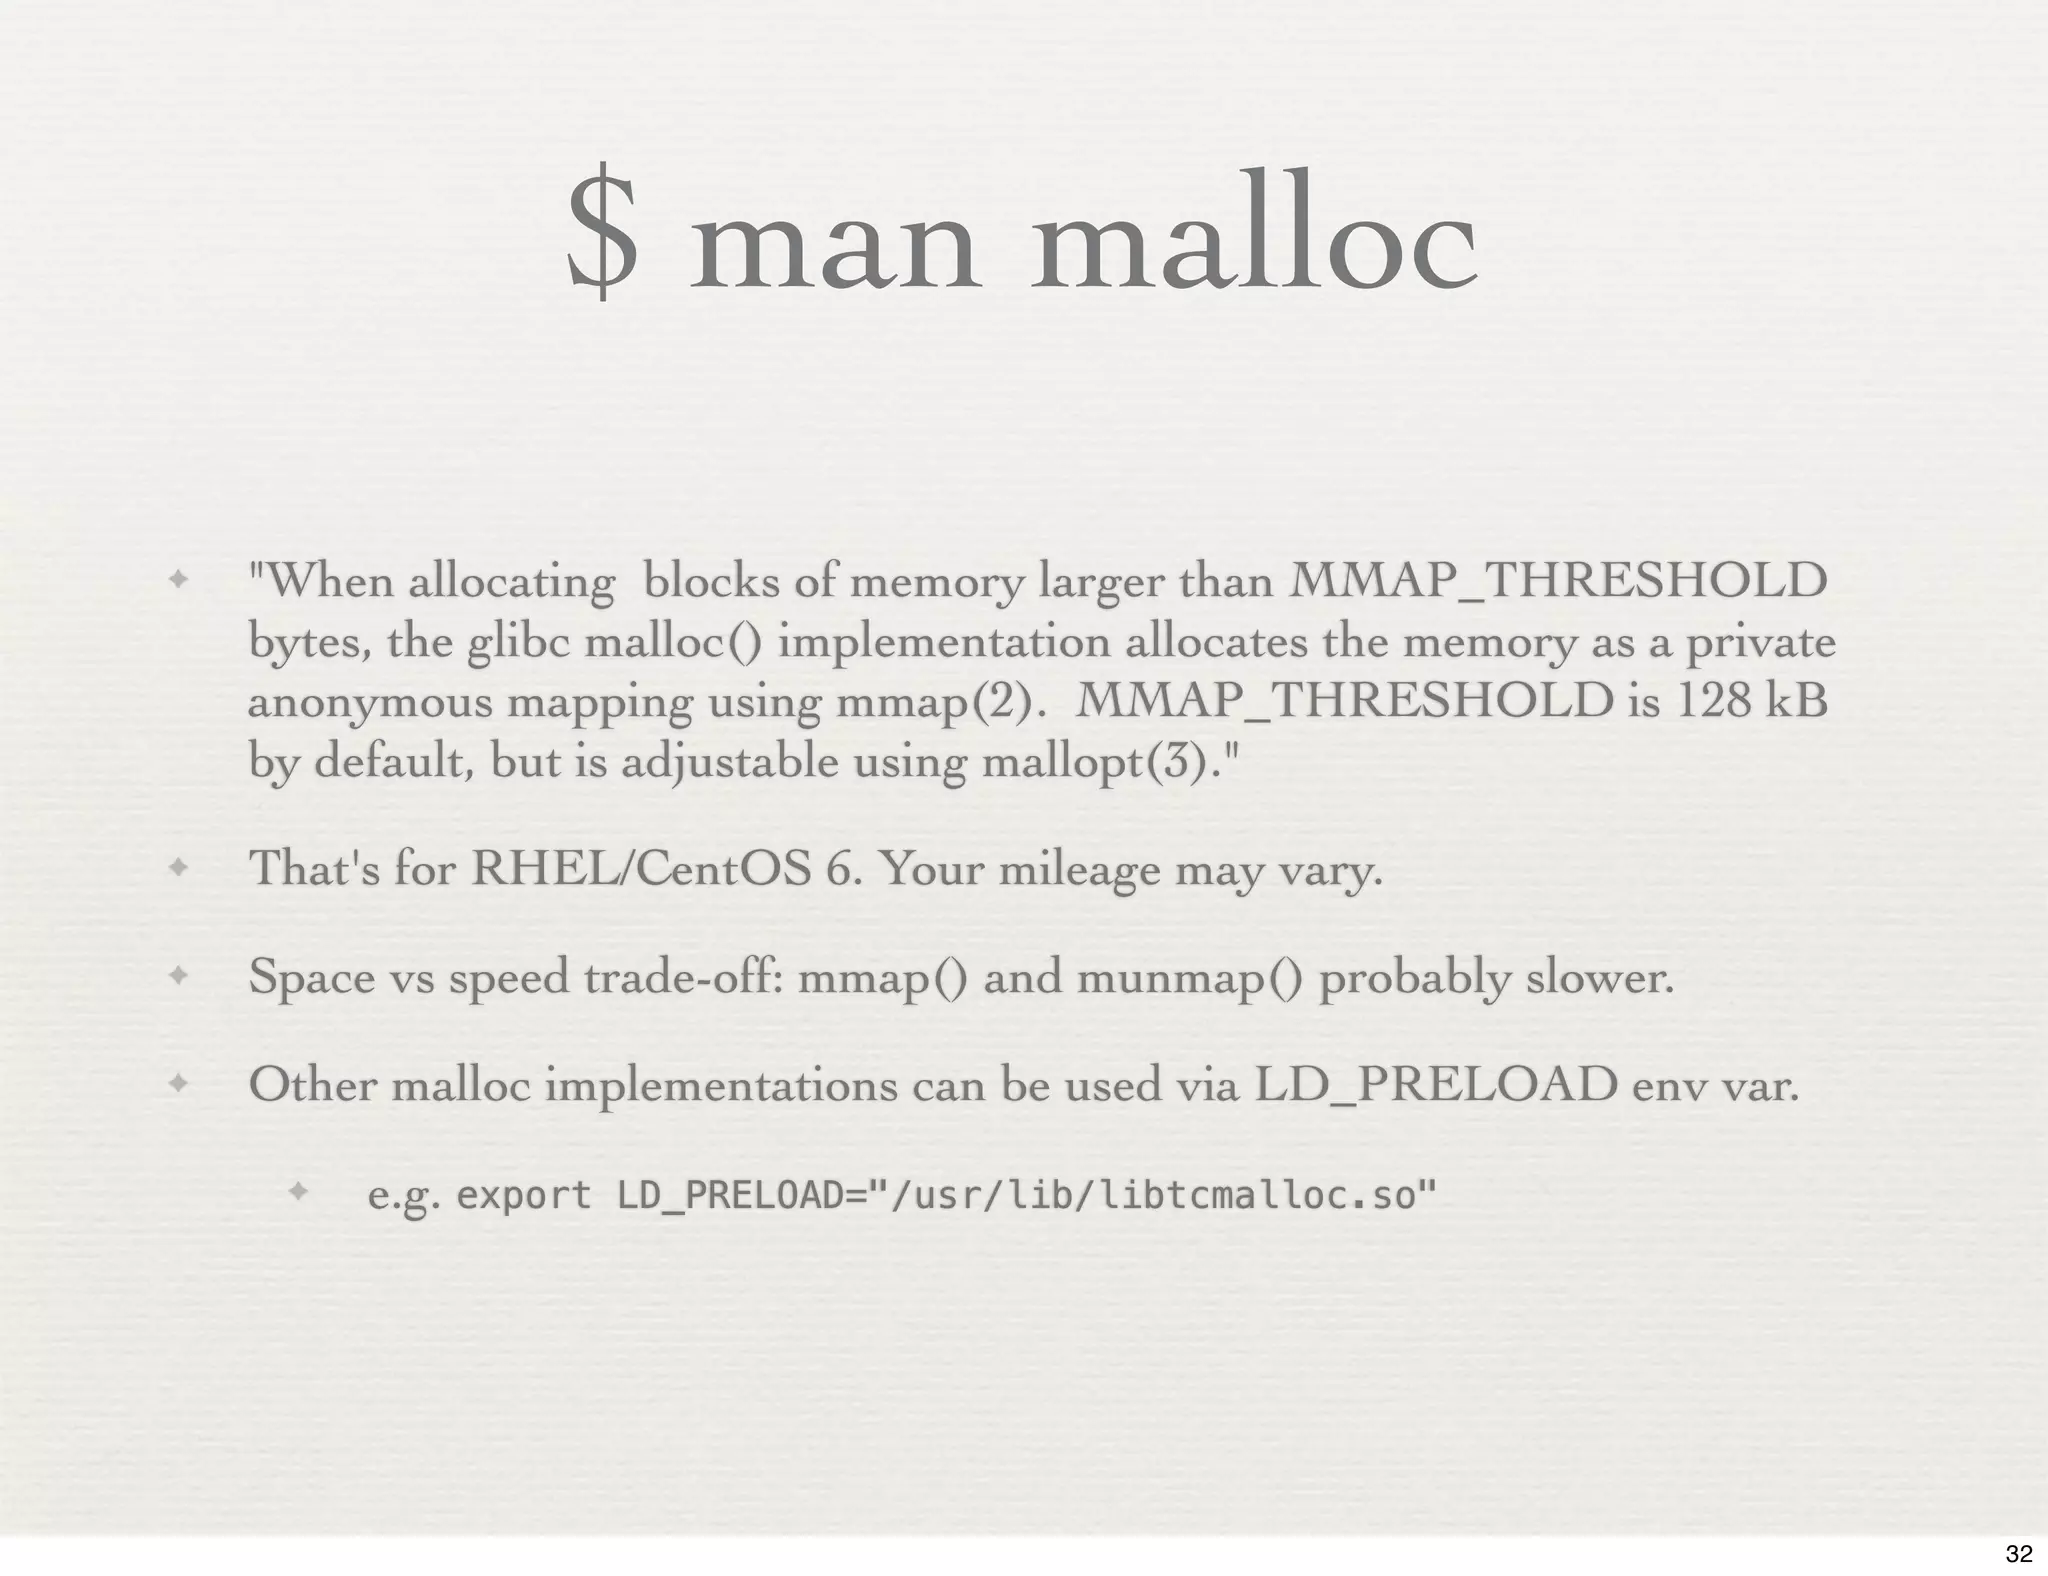
$ man malloc
✦   "When allocating blocks of memory larger than MMAP_THRESHOLD
    bytes, the glibc malloc() implementation allocates the memory as a private
    anonymous mapping using mmap(2). MMAP_THRESHOLD is 128 kB
    by default, but is adjustable using mallopt(3)."
✦   That's for RHEL/CentOS 6. Your mileage may vary.
✦   Space vs speed trade-off: mmap() and munmap() probably slower.
✦   Other malloc implementations can be used via LD_PRELOAD env var.
     ✦   e.g. export   LD_PRELOAD="/usr/lib/libtcmalloc.so"


                                                                                 32
PERL_DEBUG_MSTATS*


* Requires a perl configured to use it's own malloc (-Dusemymalloc)

$ PERL_DEBUG_MSTATS=1 perl -MMoose -MDevel::Size=total_size -we "$report"
total_size    9474 kB!   [ 9474-290 = + 9184 kB ]
VmData:      11824 kB!   [ 11824-800 = +11024 kB ]
Memory allocation statistics after execution:     (buckets 8(8)..69624(65536)
   429248 free:   225   125    69    25    18   1    3     6   0 6 1 23 0 0
!            0     9    26    10
  6302120 used:   795 14226 2955 3230 2190 1759 425       112 30 862 11 2 1 2
!            0 1606 8920 4865
Total sbrk(): 6803456/1487:-13. Odd ends: pad+heads+chain+tail: 2048+70040+0+0

• There's 419 kB ("429248 free") is sitting in unused malloc buckets.
   • See perldebguts and Devel::Peek docs for details. Also Devel::Mallinfo.
• Note Devel::Size total_size() says 9474 kB but malloc says only 6154 kb allocated!


                                                                                       33
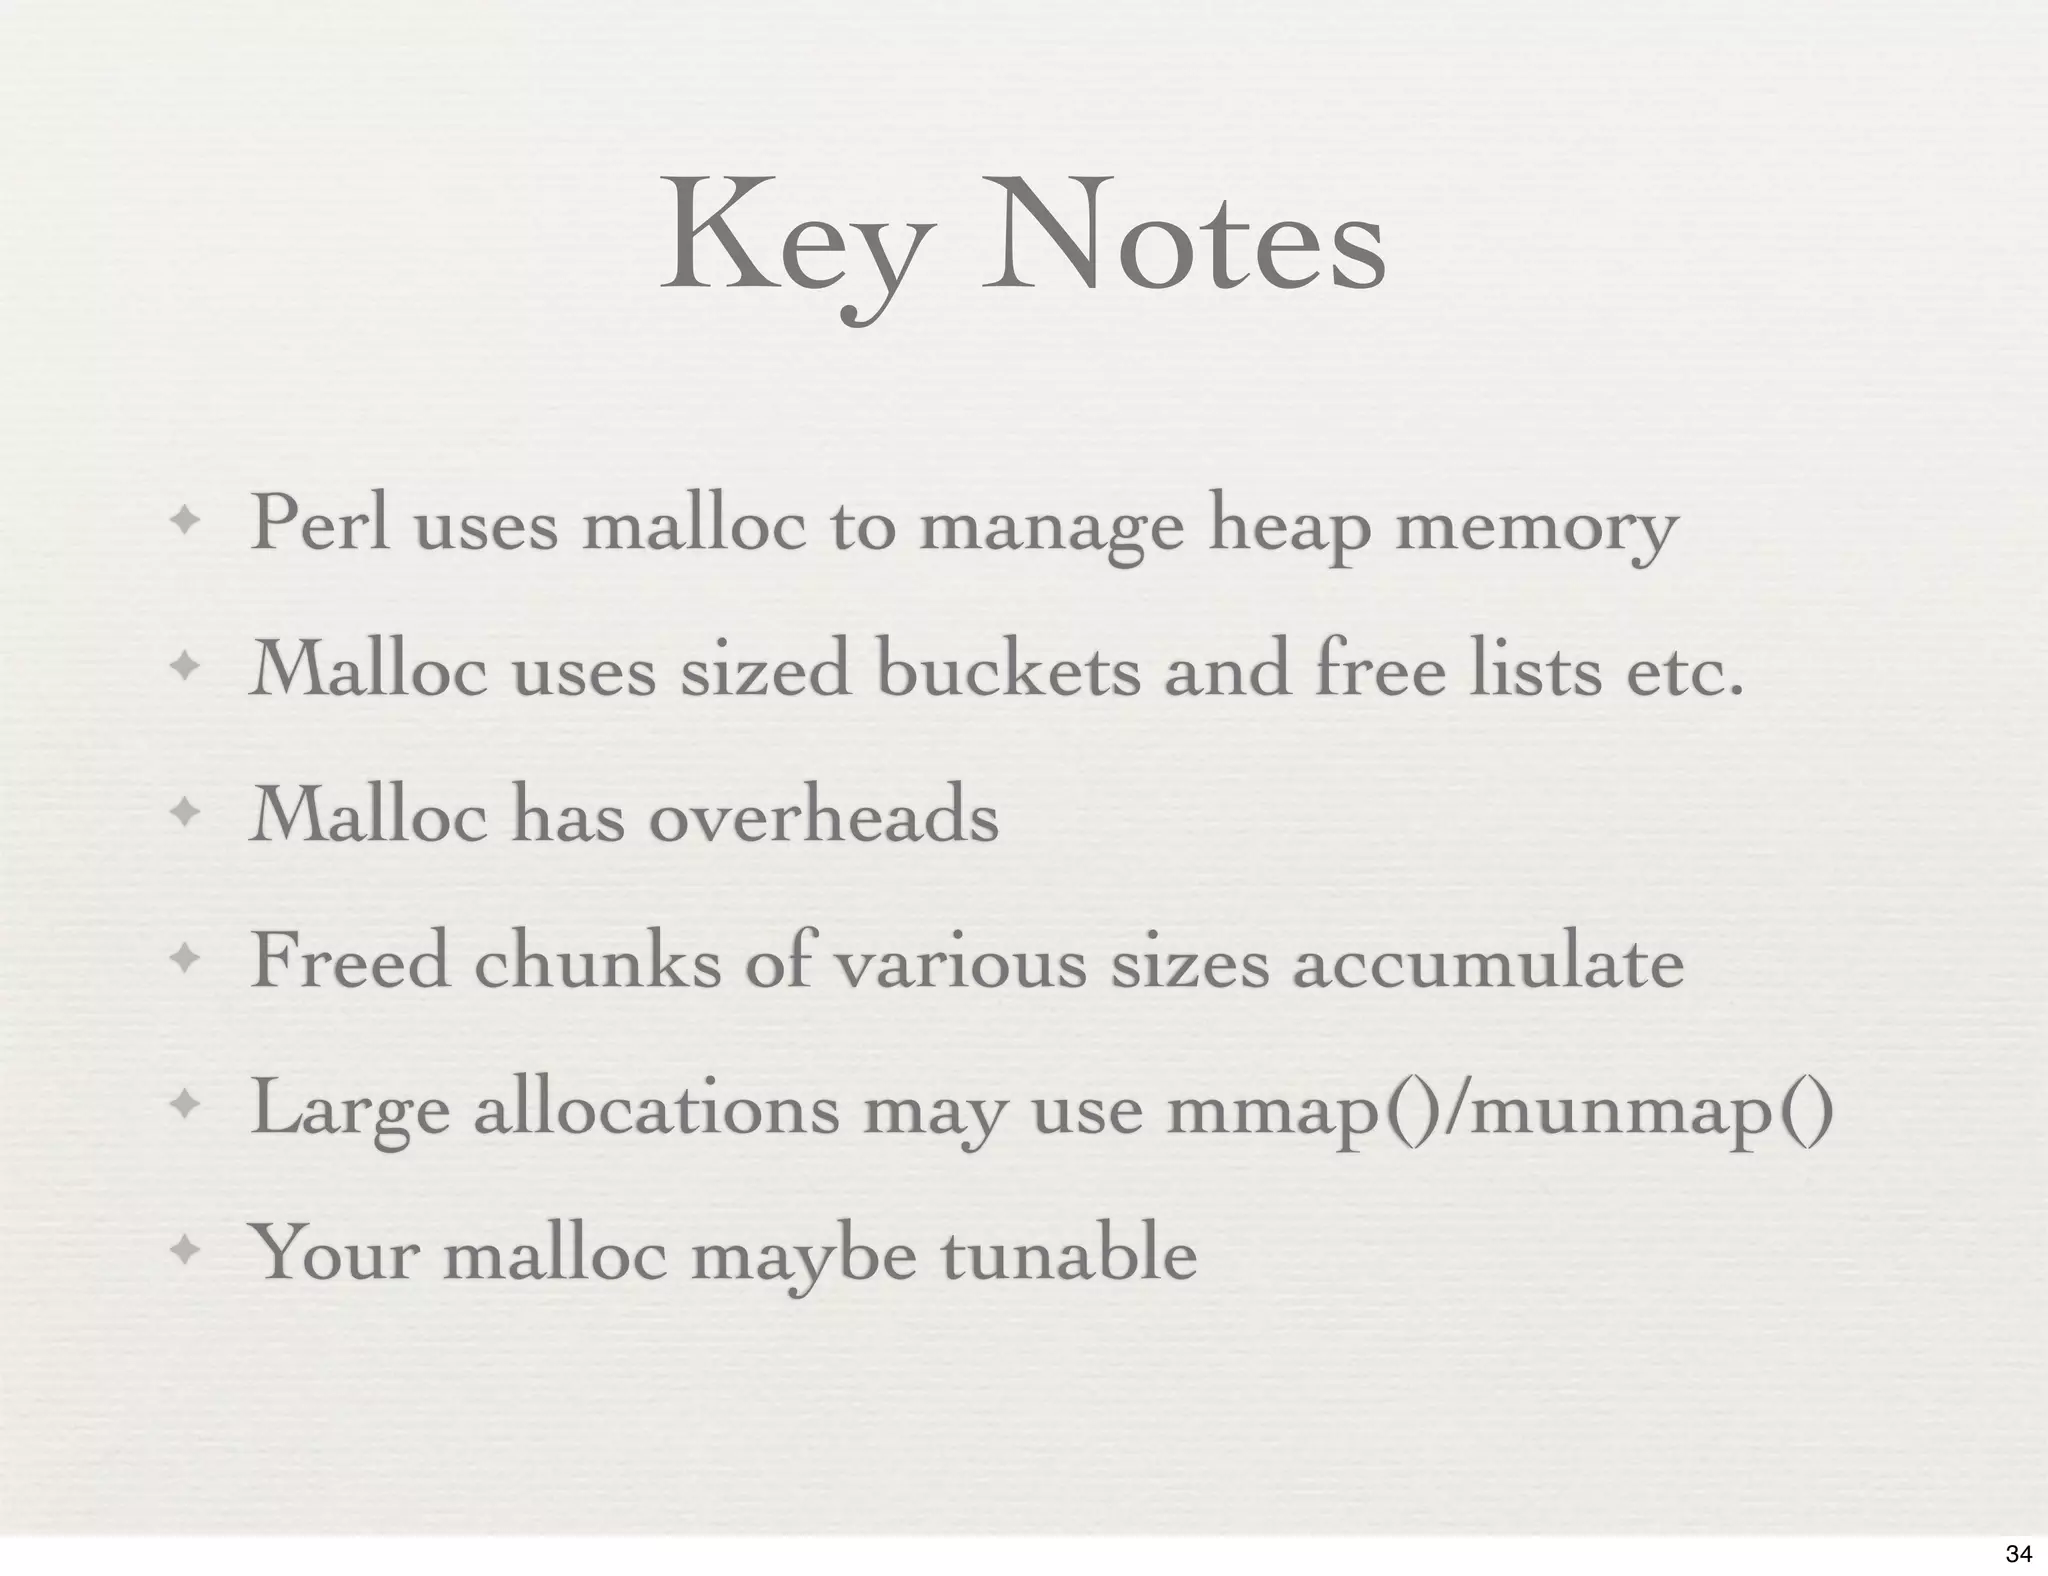
Key Notes
✦   Perl uses malloc to manage heap memory
✦   Malloc uses sized buckets and free lists etc.
✦   Malloc has overheads
✦   Freed chunks of various sizes accumulate
✦   Large allocations may use mmap()/munmap()
✦   Your malloc maybe tunable


                                                    34
Memory Profiling


                  35
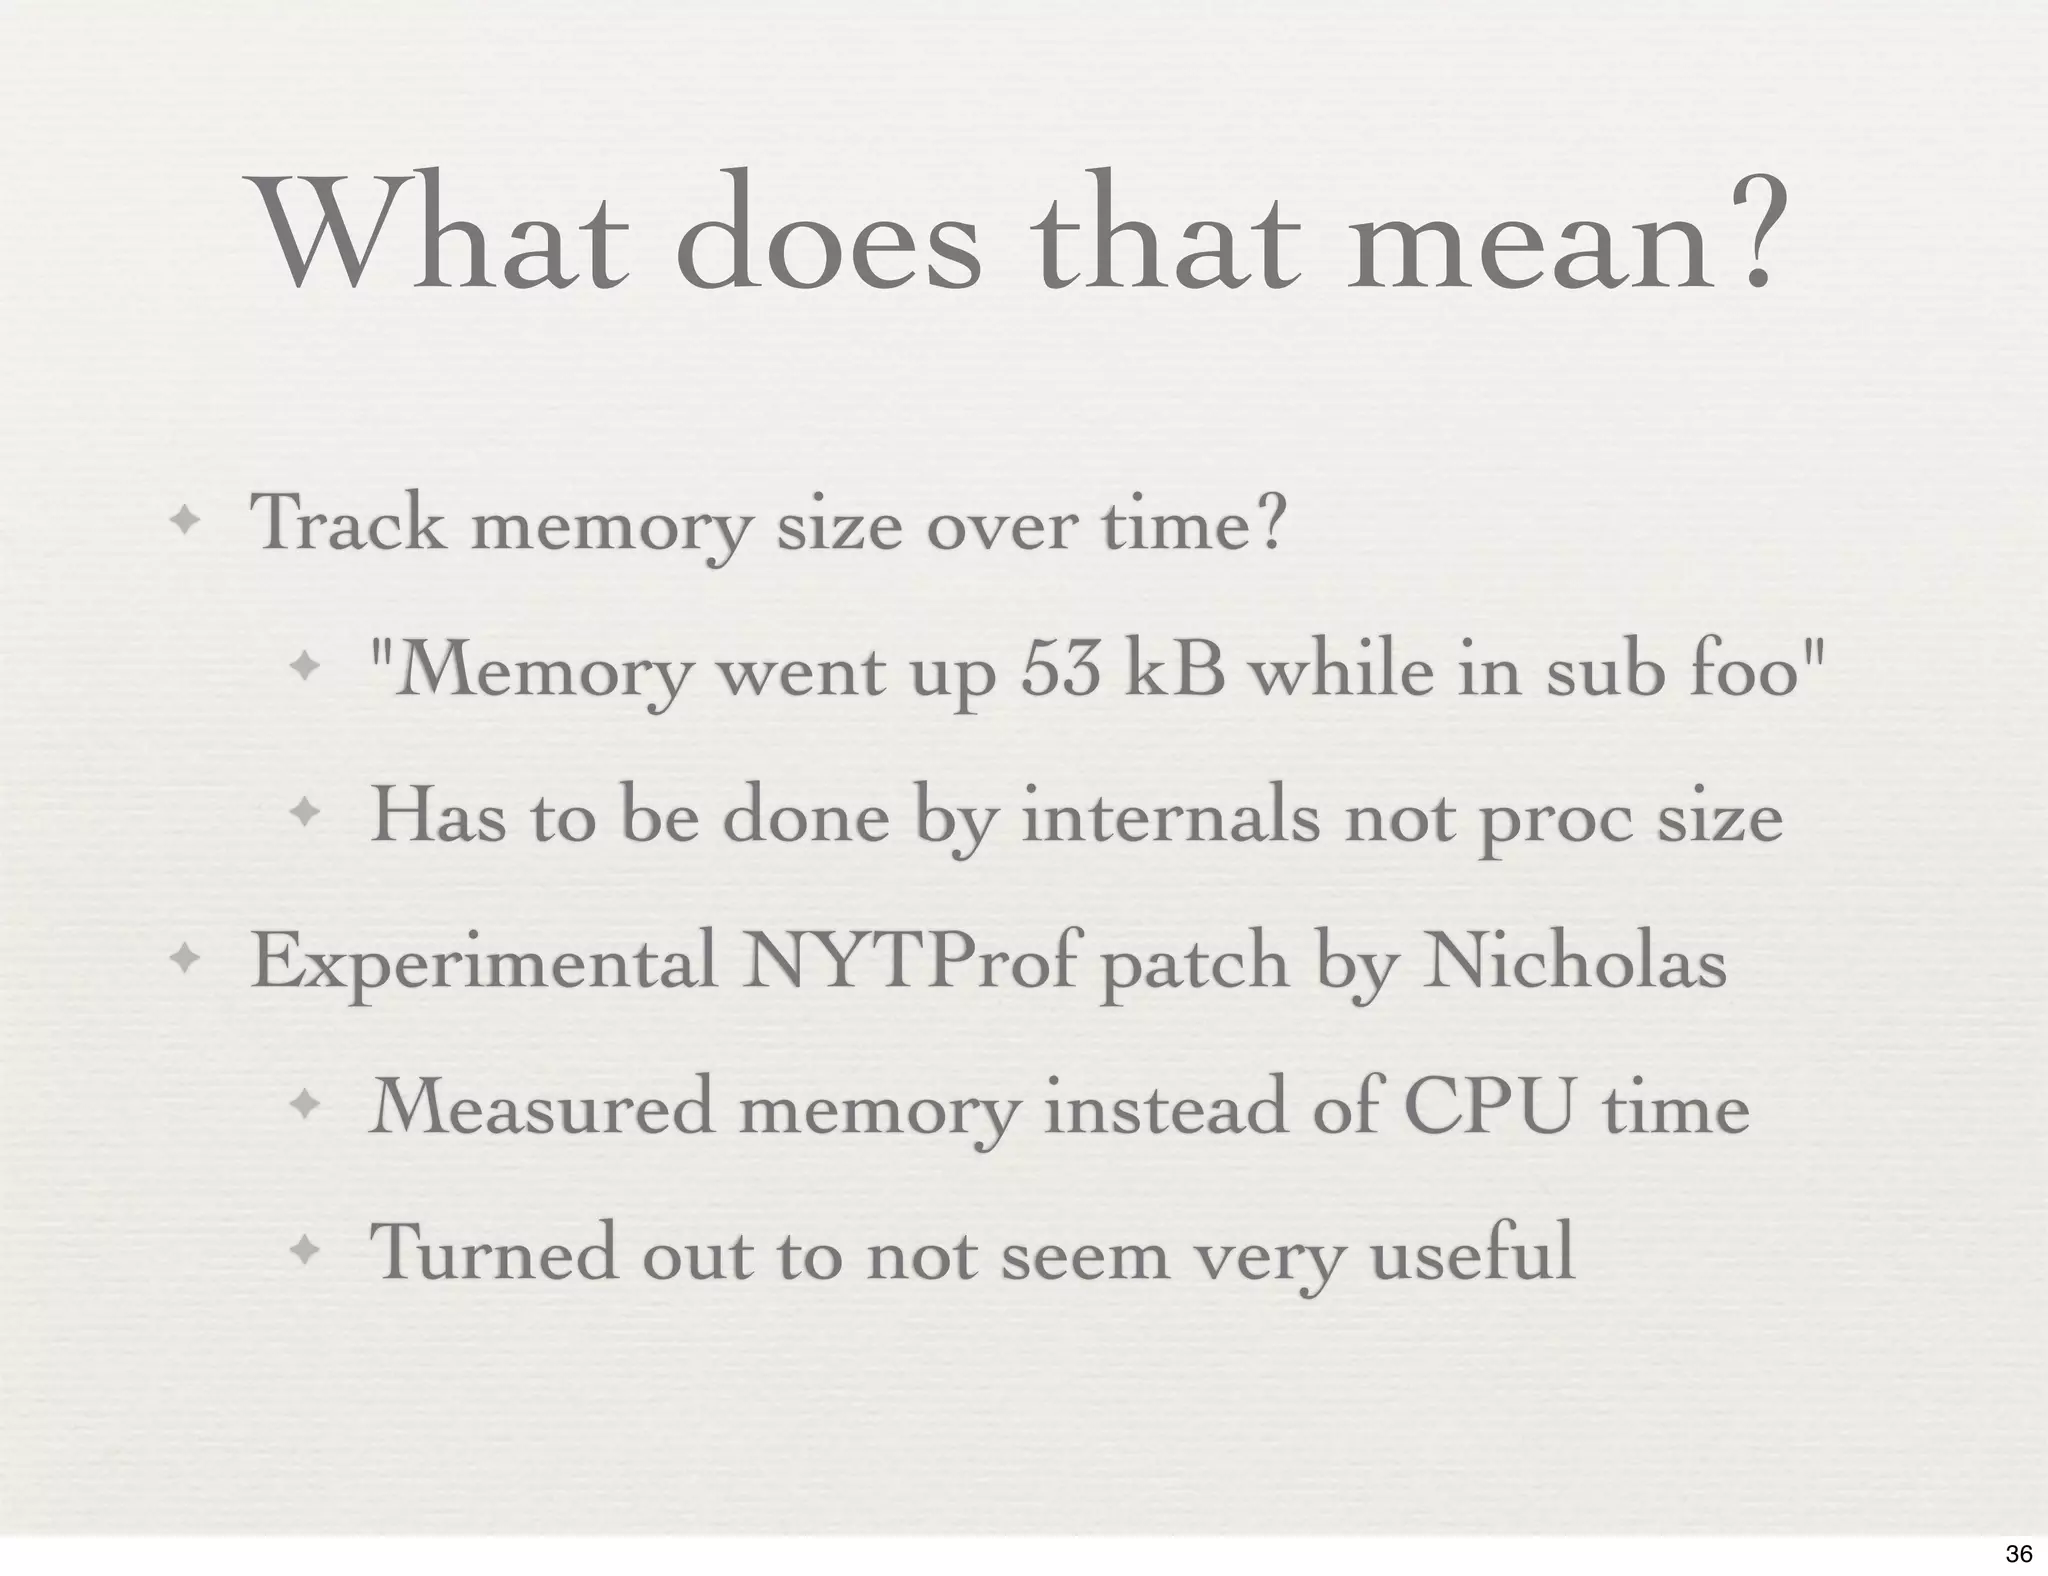
What does that mean?
✦   Track memory size over time?
     ✦   "Memory went up 53 kB while in sub foo"
     ✦   Has to be done by internals not proc size
✦   Experimental NYTProf patch by Nicholas
     ✦   Measured memory instead of CPU time
     ✦   Turned out to not seem very useful


                                                     36
The Plan


           37
The Cunning Plan


                   38
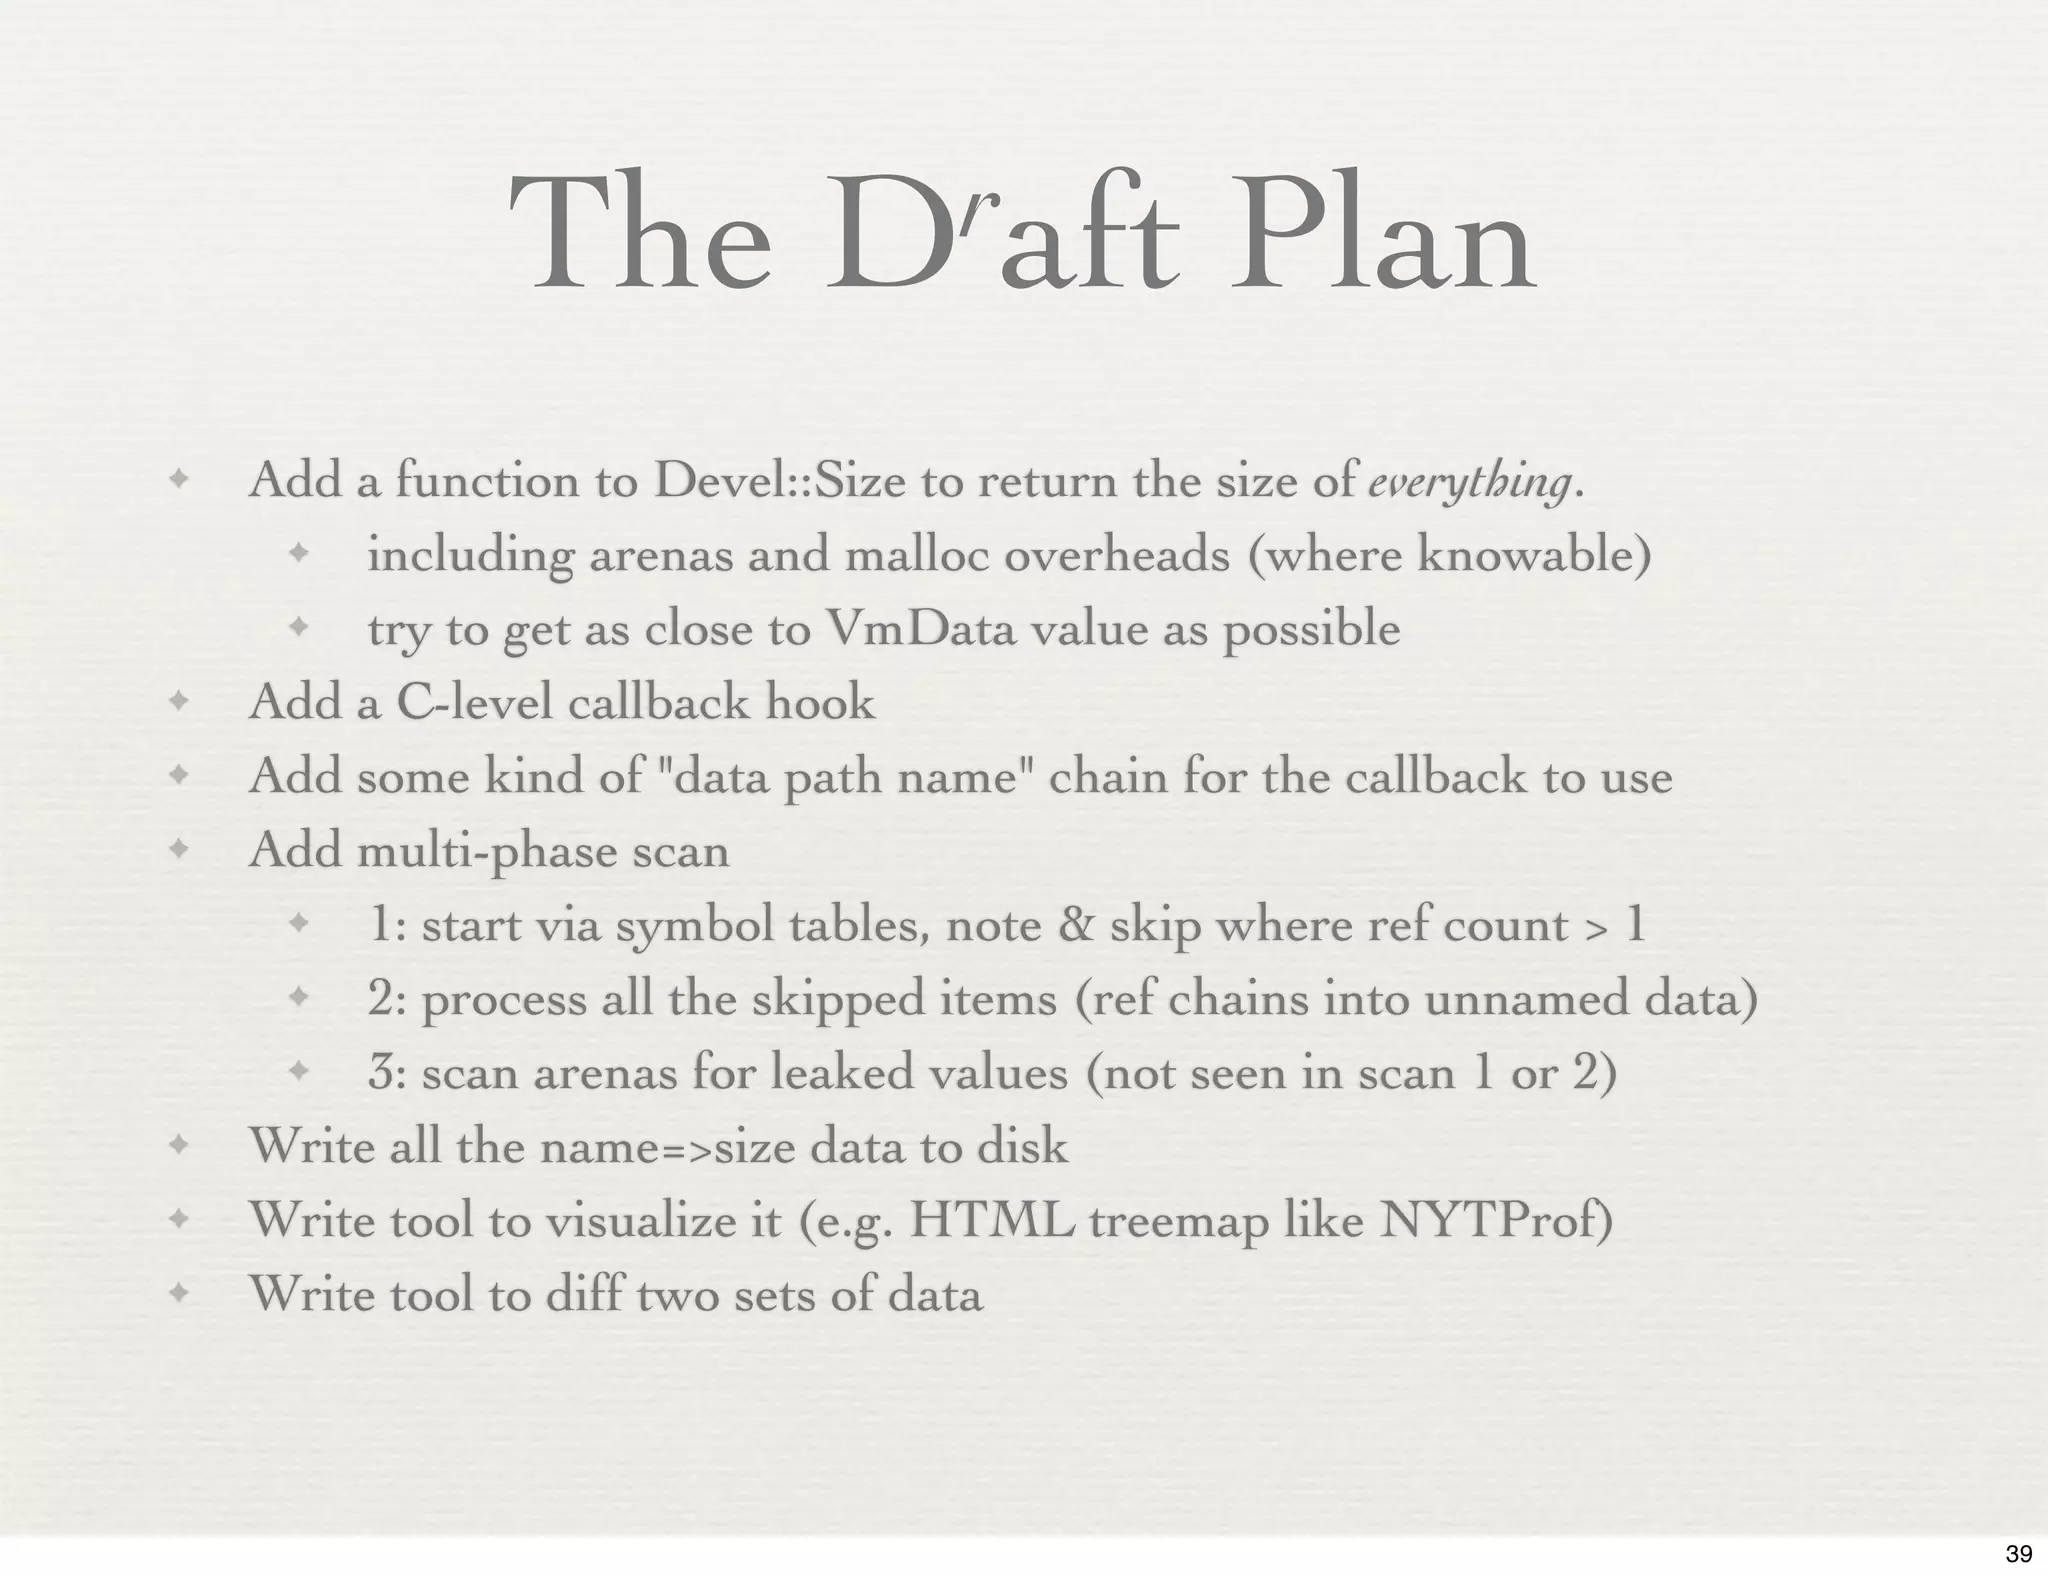
The           Draft             Plan
✦   Add a function to Devel::Size to return the size of everything.
     ✦   including arenas and malloc overheads (where knowable)
     ✦   try to get as close to VmData value as possible
✦   Add a C-level callback hook
✦   Add some kind of "data path name" chain for the callback to use
✦   Add multi-phase scan
     ✦   1: start via symbol tables, note & skip where ref count > 1
     ✦   2: process all the skipped items (ref chains into unnamed data)
     ✦   3: scan arenas for leaked values (not seen in scan 1 or 2)
✦   Write all the name=>size data to disk
✦   Write tool to visualize it (e.g. HTML treemap like NYTProf)
✦   Write tool to diff two sets of data


                                                                           39
Questions?
 Tim.Bunce@pobox.com
 http://blog.timbunce.org
  @timbunce on twitter


                            40

Perl Memory Use 201207 (OUTDATED, see 201209 )

  • 1.
    Perl Memory Use Tim Bunce @ OSCON July 2012 1
  • 2.
    Scope of thetalk... ✦ Not really "profiling" ✦ No leak detection ✦ No VM, page mapping, MMU, TLB, threads etc ✦ Linux focus ✦ Almost no copy-on-write ✦ No cats 2
  • 3.
    Goals ✦ Give you a top-to-bottom overview ✦ Identify the key issues and complications ✦ Show you useful tools along the way ✦ Future plans 3
  • 4.
    Ouch! $ perl some_script.pl Outof memory! $ $ perl some_script.pl Killed. $ $ perl some_script.pl $ Someone shouts: "Hey! My process has been killed!" $ perl some_script.pl [later] "Umm, what's taking so long?" 4
  • 5.
  • 6.
    C Program Code int main(...) { ... } Read-only Data eg “String constants” Read-write Data un/initialized variables Heap (not to scale!) Shared Lib Code Shared Lib R/O Data repeated for each lib Shared Lib R/W Data // C Stack (not the perl stack) System 6
  • 7.
    $ perl -e'system("cat /proc/$$/stat")' 4752 (perl) S 4686 4752 4686 34816 4752 4202496 536 0 0 0 0 0 0 0 20 0 1 0 62673440 123121664 440 18446744073709551615 4194304 4198212 140735314078128 140735314077056 140645336670206 0 0 134 0 18446744071579305831 0 0 17 10 0 0 0 0 0 0 0 0 0 0 4752 111 111 111 $ perl -e 'system("cat /proc/$$/statm")' 30059 441 346 1 0 160 0 $ perl -e 'system("ps -p $$ -o vsz,rsz,sz,size")' VSZ RSZ SZ SZ 120236 1764 30059 640 $ perl -e 'system("top -b -n1 -p $$")' ... PID USER PR NI VIRT RES SHR S %CPU %MEM TIME+ COMMAND 13063 tim 20 0 117m 1764 1384 S 0.0 0.1 0:00.00 perl $ perl -e 'system("cat /proc/$$/status")' ... VmPeak:! 120236 kB VmSize:! 120236 kB <- total (code, libs, stack, heap etc.) VmHWM:! 1760 kB VmRSS:! 1760 kB <- how much of the total is resident in physical memory VmData:! 548 kB <- data (heap) VmStk:! 92 kB <- stack VmExe:! 4 kB <- code VmLib:! 4220 kB <- libs, including libperl.so VmPTE:! 84 kB VmPTD:! 28 kB VmSwap:! 0 kB ... Further info on unix.stackexchange.com 7
  • 8.
    $ perl -e'system("cat /proc/$$/maps")' address perms ... pathname 00400000-00401000 r-xp ... /.../perl-5.NN.N/bin/perl 00601000-00602000 rw-p ... /.../perl-5.NN.N/bin/perl 0087f000-008c1000 rw-p ... [heap] 7f858cba1000-7f8592a32000 r--p ... /usr/lib/locale/locale-archive-rpm 7f8592c94000-7f8592e1a000 r-xp ... /lib64/libc-2.12.so 7f8592e1a000-7f859301a000 ---p ... /lib64/libc-2.12.so 7f859301a000-7f859301e000 r--p ... /lib64/libc-2.12.so 7f859301e000-7f859301f000 rw-p ... /lib64/libc-2.12.so 7f859301f000-7f8593024000 rw-p ... ...other libs... 7f8593d1b000-7f8593e7c000 r-xp ... /.../lib/5.NN.N/x86_64-linux/CORE/libperl.so 7f8593e7c000-7f859407c000 ---p ... /.../lib/5.NN.N/x86_64-linux/CORE/libperl.so 7f859407c000-7f8594085000 rw-p ... /.../lib/5.NN.N/x86_64-linux/CORE/libperl.so 7f85942a6000-7f85942a7000 rw-p ... 7fff61284000-7fff6129a000 rw-p ... [stack] 7fff613fe000-7fff61400000 r-xp ... [vdso] ffffffffff600000-ffffffffff601000 r-xp ... [vsyscall] 8
  • 9.
    $ perl -e'system("cat /proc/$$/smaps")' # note ‘smaps’ not ‘maps’ address perms ... pathname ... 7fb00fbc1000-7fb00fd22000 r-xp ... /.../5.10.1/x86_64-linux/CORE/libperl.so Size: 1412 kB <- size of executable code in libperl.so Rss: 720 kB <- amount that's in physical memory Pss: 364 kB Shared_Clean: 712 kB Shared_Dirty: 0 kB Private_Clean: 8 kB Private_Dirty: 0 kB Referenced: 720 kB Anonymous: 0 kB AnonHugePages: 0 kB Swap: 0 kB KernelPageSize: 4 kB MMUPageSize: 4 kB ... repeated detail for every mapped item ... Process view: everything exists in sequential contiguous physical memory. Simple. System view: chunks of physical memory are mapped into place and loaded on demand, then taken away again when the process isn't looking. 9
  • 10.
    C Program Code To the program everything appears to be in physical memory. Read-only Data In reality that’s rarely the case. Read-write Data Memory is divided into pages Heap Page size is typically 4KB ← Page ‘resident’ in physical memory ← Page not resident Pages: • are loaded when first used • may be ‘paged out’ when the system Shared Lib Code needs the physical memory Shared Lib R/O Data • may be shared with other processes • may be copy-on-write, where are Shared Lib R/W Data shared page becomes private when first written to C Stack System 10
  • 11.
    Key Points ✦ Pages of a process can be paged out if the system wants the physical memory. So Resident Set Size (RSS) can shrink even while the overall process size grows. ✦ Re private/shared/copy-on-write: If a page is currently paged out its attributes are paged out as well. In this case a page is neither reported as private nor as shared. It is only included in the process size. ✦ So be careful to understand what you’re actually measuring! ✦ Generally total memory size is a good indicator. 11
  • 12.
    Low-Level Modules ✦ BSD::Resource - getrusage() system call (limited on Linux) ✦ BSD::Process - Only works on BSD, not Linux ✦ Proc::ProcessTable - Interesting but buggy ✦ Linux::Smaps - very detailed, but only works on Linux ✦ GTop - Perl interface to libgtop, better but external dependency 12
  • 13.
    Higher-Level Modules ✦ Memory::Usage ✦ Reads /proc/$pid/statm. Reports changes on demand. ✦ Dash::Leak ✦ Uses BSD::Process. Reports changes on demand. ✦ Devel::MemoryTrace::Light ✦ Uses GTop or BSD::Process. Automatically prints a message when memory use grows, pointing to a particular line number. ✦ Defaults to tracking Resident Set Size! 13
  • 14.
    Other Modules ✦ Devel::Plumber - memory leak finder for C programs ✦ Uses GDB to walk internal glibc heap structures. Can work on either a live process or a core file. Treats the C heap of the program under test as a collection of non-overlapping blocks, and classifies them into one of four states. ✦ Devel::Memalyzer - Base framework for analyzing program memory usage ✦ Runs and monitors a subprocess via plugins that read /proc smaps and status at regular intervals. ✦ Memchmark - Check memory consumption ✦ Memchmark forks a new process to run the sub and then monitors its memory usage every 100ms (approx.) recording the maximum amount used. 14
  • 15.
  • 16.
    Heap ← Your data goes here Perl uses malloc() and free() to manage the space malloc has its own issues (overheads, bucket sizes, fragmentation etc. etc.) Perl uses its own malloc code on some systems On top of malloc perl has it’s own layer of memory management (e.g. arenas) for some data types 16
  • 17.
  • 18.
    Data Anatomy Examples Integer (IV) String (PV) Number with a string Head Body Data Illustrations from illguts 18
  • 19.
  • 20.
    Glob (GV) Symbol Table (Stash) Sub Pad List lots of tiny chunks! 20
  • 21.
    Notes ✦ All Heads and Bodies are allocated from arenas managed by perl ✦ efficient, low overhead and no fragmentation ✦ but arena space for a given data type is never freed or repurposed ✦ All variable length data storage comes from malloc ✦ higher overheads, bucket and fragmentation issues ✦ Summing the “apparent size” of a data structure will underestimate the actual “space cost”. 21
  • 22.
    Arenas $ perl -MDevel::Gladiator=arena_table-e 'warn arena_table()' ARENA COUNTS: 1063 SCALAR 199 GLOB 120 ARRAY 95 CODE 66 HASH 8 REGEXP 5 REF 4 IO::File 3 REF-ARRAY 2 FORMAT 1 version 1 REF-HASH 1 REF-version arena_table()formats the hash return by arena_ref_counts() which summarizes the list of all SVs returned by walk_arenas(). 22
  • 23.
    Devel::Peek • Gives youa textual view of the data structures $ perl -MDevel::Peek -e '%a = (42 => "Hello World!"); Dump(%a)' SV = IV(0x1332fd0) at 0x1332fe0 REFCNT = 1 FLAGS = (TEMP,ROK) RV = 0x1346730 SV = PVHV(0x1339090) at 0x1346730 REFCNT = 2 FLAGS = (SHAREKEYS) ARRAY = 0x1378750 (0:7, 1:1) hash quality = 100.0% KEYS = 1 FILL = 1 MAX = 7 RITER = -1 EITER = 0x0 Elt "42" HASH = 0x73caace8 SV = PV(0x1331090) at 0x1332de8 REFCNT = 1 FLAGS = (POK,pPOK) PV = 0x133f960 "Hello World!"0 CUR = 12 <= length in use LEN = 16 <= amount allocated 23
  • 24.
    Devel::Size • Gives youa measure of the size of a data structures $ perl -MDevel::Size=total_size -Minteger -le 'print total_size( 0 )' 24 $ perl -MDevel::Size=total_size -Minteger -le 'print total_size( [] )' 64 $ perl -MDevel::Size=total_size -Minteger -le 'print total_size( {} )' 120 $ perl -MDevel::Size=total_size -le 'print total_size( [ 1..100 ] )' 3264 • Makes somewhat arbitrary decisions about what to include for non-data types • Doesn't or can't accurately measure subs, forms, regexes, and IOs. • Can't measure 'everything' (total_size(%main::) is the best we can do) • But it's generally accurate for typical use and is very fast. 24
  • 25.
    Space in Hiding ✦ Perl tends to use memory to save time ✦ This can lead to surprises, for example: ✦ sub foo { my $var = "#" x 2**20; } foo(); # ~1MB still used after return ✦ sub bar{ my $var = "#" x 2**20; bar($_[0]-1) if $_[0]; # recurse } bar(50); # ~50MB still used after return 25
  • 26.
    Devel::Size 0.77 perl -MDevel::Size=total_size -we ' sub foo { my $var = "#" x 2**20; foo($_[0]-1) if $_[0]; 1 } system("grep VmData /proc/$$/status"); printf "%d kBn", total_size(&foo)/1024; foo(50); system("grep VmData /proc/$$/status"); printf "%d kBn", total_size(&foo)/1024; ' VmData:! 796 kB 7 kB VmData:! 105652 kB 8 kB • VmData grew by ~100MB but we expected ~50MB. Not sure why. • Devel::Size 0.77 doesn't measure what's in sub pads (lexicals). 26
  • 27.
    Devel::Size 0.77 +hacks perl -MDevel::Size=total_size -we ' sub foo { my $var = "#" x 2**20; foo($_[0]-1) if $_[0];1 } system("grep VmData /proc/$$/status"); printf "%d kBn", total_size(&foo)/1024; foo(50); system("grep VmData /proc/$$/status"); printf "%d kBn", total_size(&foo)/1024; ' VmData:! 796 kB 293 kB VmData:! 105656 kB 104759 kB • Now does include the pad variables. • But note the 293 kB initial value - it's measuring too much. Work in progress. 27
  • 28.
    Devel::Size 0.77 +hacks $ report='printf "total_size %6d kBn", total_size(%main::)/1024; system("grep VmData /proc/$$/status")' $ perl -MDevel::Size=total_size -we “$report” total_size 290 kB VmData: 800 kB $ perl -MMoose -MDevel::Size=total_size -we “$report” total_size 9474 kB! [ 9474-290 = + 9184 kB ] VmData: 11824 kB! [ 11824-800 = +11024 kB ] What accounts for the 1840 kB difference in the increases? -Arenas and other perl-internals aren't included -Limitations of Devel::Size measuring subs and regexs -Malloc heap buckets and fragmentation 28
  • 29.
  • 30.
  • 31.
    malloc manages memoryallocation Heap perl data Requests big chunks of memory from the operating system as needed. Almost never returns it! Perl makes lots of alloc and free requests. Freed fragments of various sizes accumulate. 31
  • 32.
    $ man malloc ✦ "When allocating blocks of memory larger than MMAP_THRESHOLD bytes, the glibc malloc() implementation allocates the memory as a private anonymous mapping using mmap(2). MMAP_THRESHOLD is 128 kB by default, but is adjustable using mallopt(3)." ✦ That's for RHEL/CentOS 6. Your mileage may vary. ✦ Space vs speed trade-off: mmap() and munmap() probably slower. ✦ Other malloc implementations can be used via LD_PRELOAD env var. ✦ e.g. export LD_PRELOAD="/usr/lib/libtcmalloc.so" 32
  • 33.
    PERL_DEBUG_MSTATS* * Requires aperl configured to use it's own malloc (-Dusemymalloc) $ PERL_DEBUG_MSTATS=1 perl -MMoose -MDevel::Size=total_size -we "$report" total_size 9474 kB! [ 9474-290 = + 9184 kB ] VmData: 11824 kB! [ 11824-800 = +11024 kB ] Memory allocation statistics after execution: (buckets 8(8)..69624(65536) 429248 free: 225 125 69 25 18 1 3 6 0 6 1 23 0 0 ! 0 9 26 10 6302120 used: 795 14226 2955 3230 2190 1759 425 112 30 862 11 2 1 2 ! 0 1606 8920 4865 Total sbrk(): 6803456/1487:-13. Odd ends: pad+heads+chain+tail: 2048+70040+0+0 • There's 419 kB ("429248 free") is sitting in unused malloc buckets. • See perldebguts and Devel::Peek docs for details. Also Devel::Mallinfo. • Note Devel::Size total_size() says 9474 kB but malloc says only 6154 kb allocated! 33
  • 34.
    Key Notes ✦ Perl uses malloc to manage heap memory ✦ Malloc uses sized buckets and free lists etc. ✦ Malloc has overheads ✦ Freed chunks of various sizes accumulate ✦ Large allocations may use mmap()/munmap() ✦ Your malloc maybe tunable 34
  • 35.
  • 36.
    What does thatmean? ✦ Track memory size over time? ✦ "Memory went up 53 kB while in sub foo" ✦ Has to be done by internals not proc size ✦ Experimental NYTProf patch by Nicholas ✦ Measured memory instead of CPU time ✦ Turned out to not seem very useful 36
  • 37.
  • 38.
  • 39.
    The Draft Plan ✦ Add a function to Devel::Size to return the size of everything. ✦ including arenas and malloc overheads (where knowable) ✦ try to get as close to VmData value as possible ✦ Add a C-level callback hook ✦ Add some kind of "data path name" chain for the callback to use ✦ Add multi-phase scan ✦ 1: start via symbol tables, note & skip where ref count > 1 ✦ 2: process all the skipped items (ref chains into unnamed data) ✦ 3: scan arenas for leaked values (not seen in scan 1 or 2) ✦ Write all the name=>size data to disk ✦ Write tool to visualize it (e.g. HTML treemap like NYTProf) ✦ Write tool to diff two sets of data 39
  • 40.