Download as PDF, PPTX
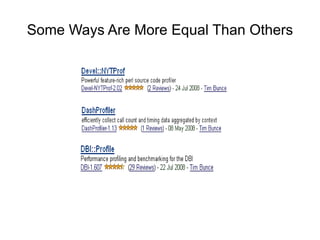
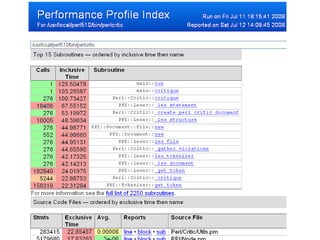
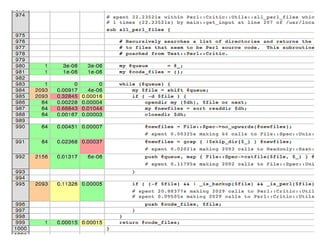
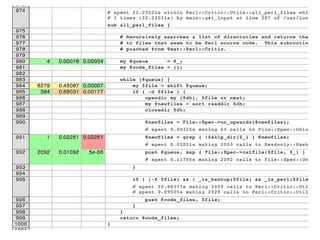
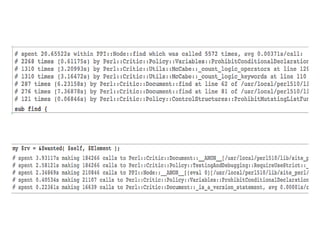
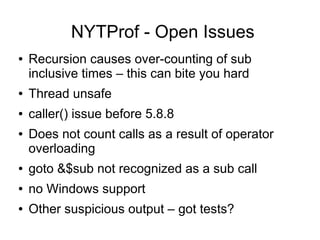
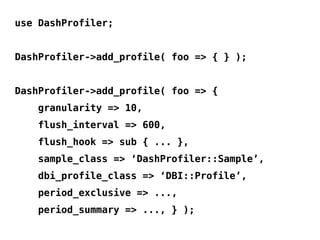
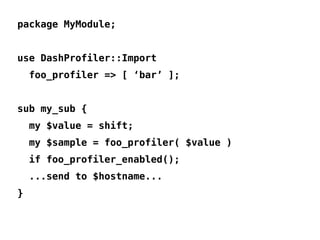
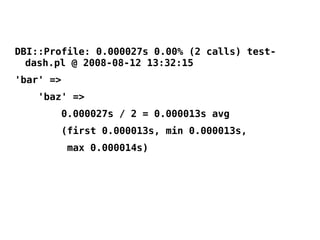


This document discusses different methods for profiling Perl code, including general code profilers that record timing data by line, subroutine, or source file, as well as domain-specific profilers. It highlights Devel::NYTProf as the new preferred option, noting its improved accuracy over Devel::DProf due to fixing a timing issue, its ability to perform block-level profiling which was a Perl first, and its convenient and useful output format. However, it also mentions that Devel::NYTProf still has issues with recursion calls that need to be addressed.