Download as PDF, PPTX

![6
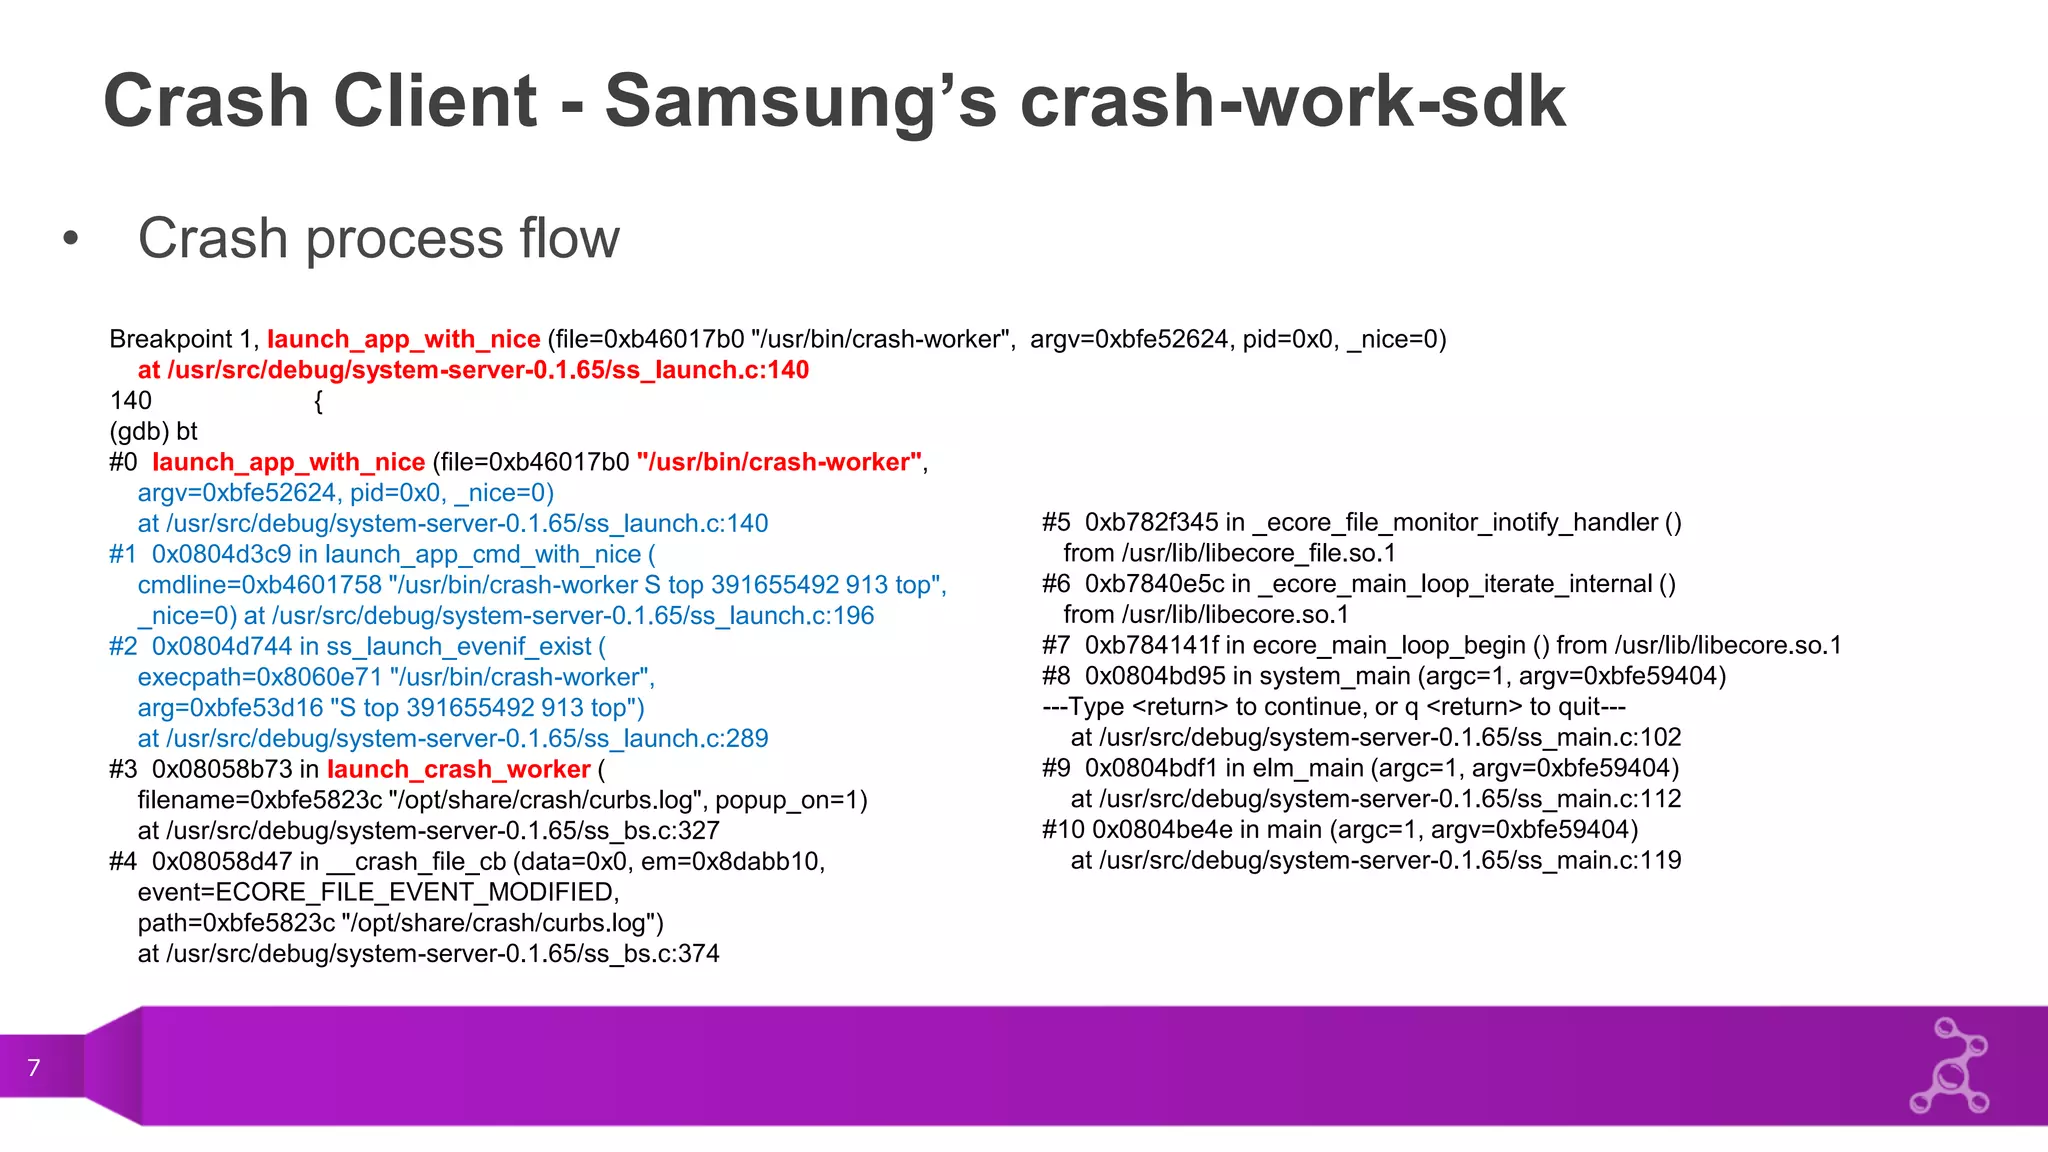
Crash Client - Samsung’s crash-work-sdk
• Crash process flow
Stage 1: in sys-assert.c (libsys-assert.so)
-> int sig_to_handle[] = { SIGILL, SIGABRT, SIGBUS, SIGFPE, SIGSEGV, };
-> sighandler notify system_server via /opt/share/crash/curbs.log pipeline.
Stage 2: in ss_bs.c (system-server)
-> ecore_file_monitor_add(CRASH_NOTI_PATH,(void *) __crash_file_cb, NULL);
-> __crash_file_cb:
-> launch_crash_worker()
......
launch /usr/bin/crash-worker to generate cs file
launch /usr/apps/org.tizen.crash-popup/bin/crash-popup to popup crash (only 1st)](https://image.slidesharecdn.com/8f61bcb2-8460-4a6f-8ae6-25a469f23554-151129154151-lva1-app6892/75/Crash_Report_Mechanism_In_Tizen-6-2048.jpg)
![10
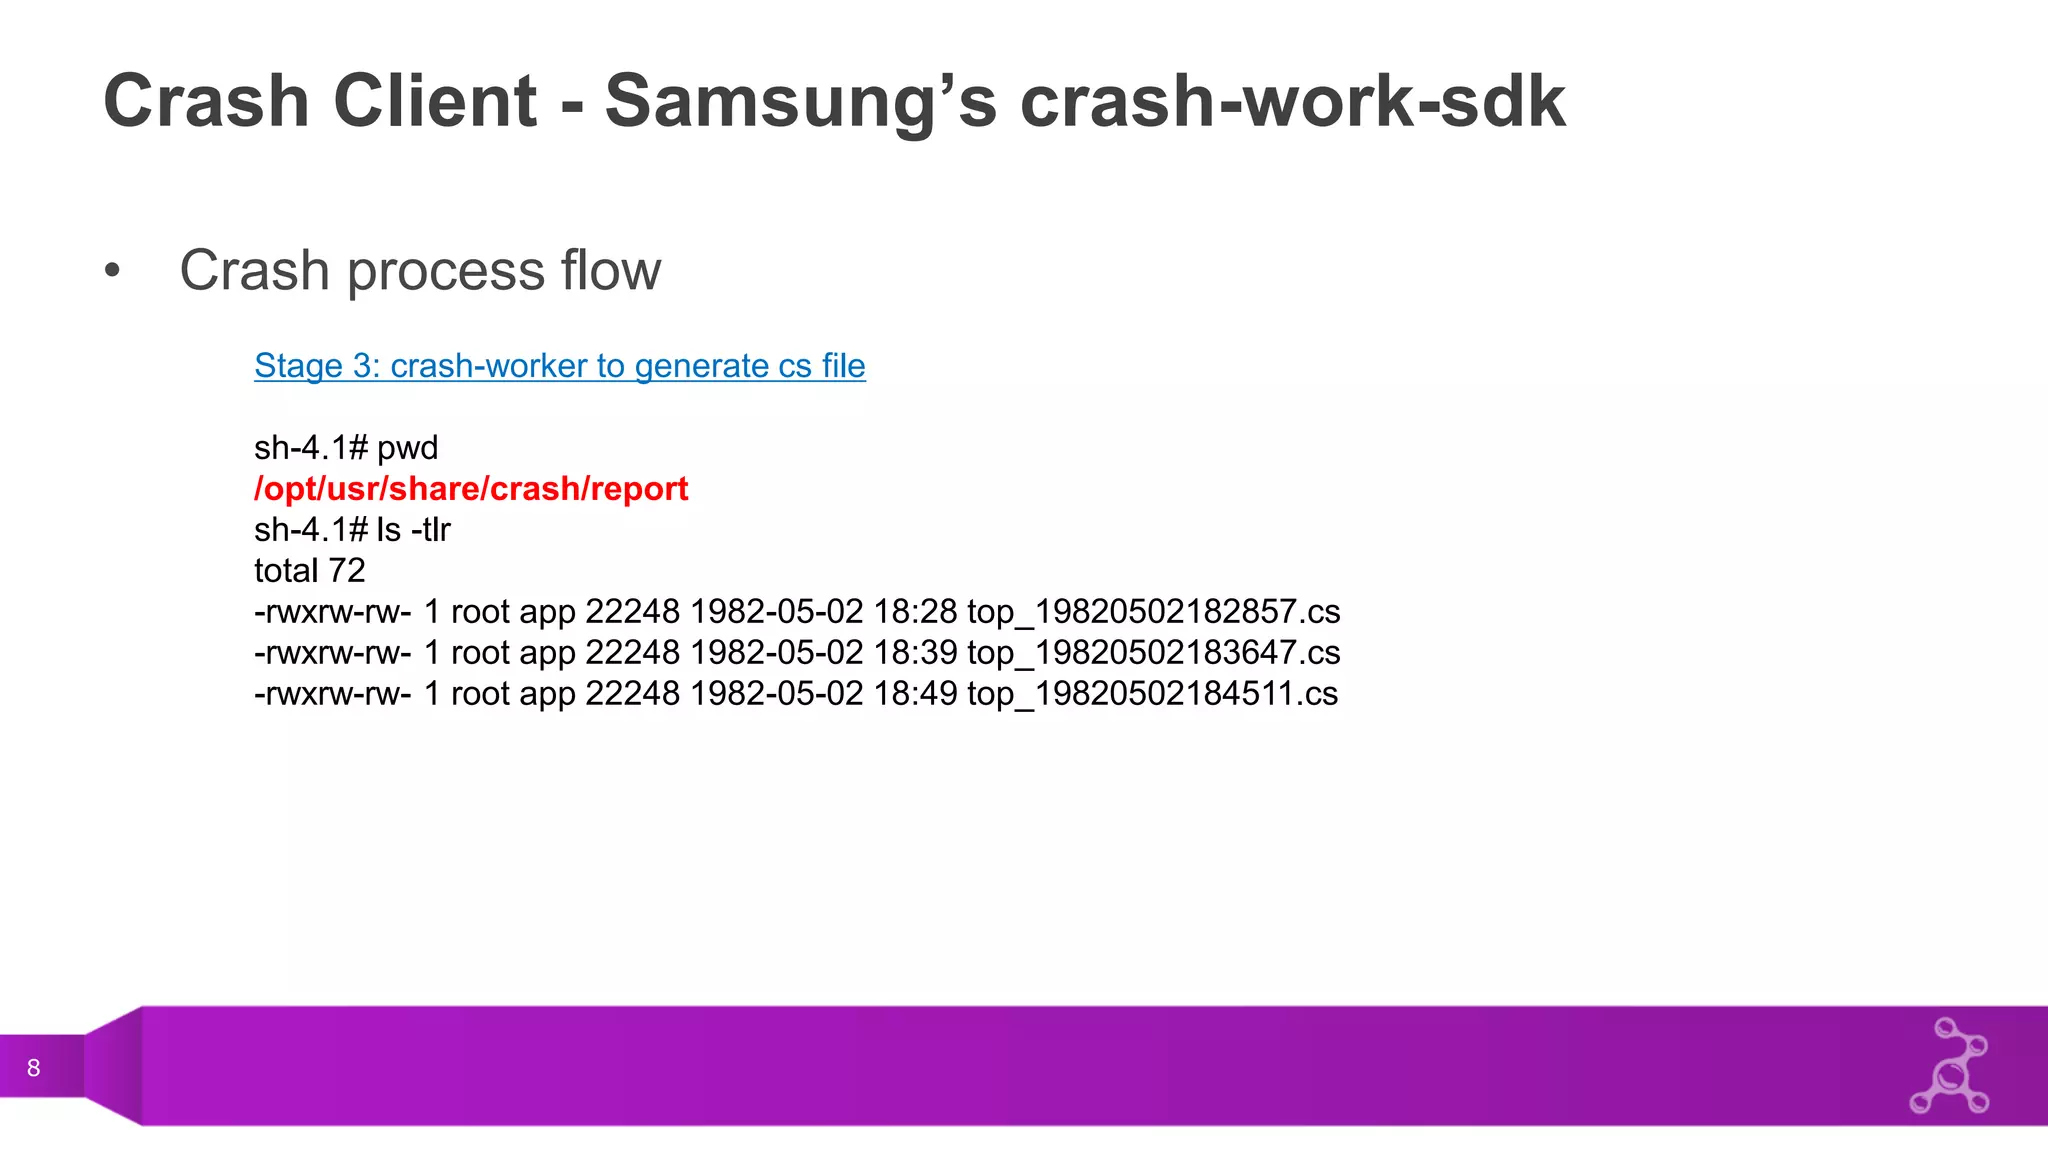
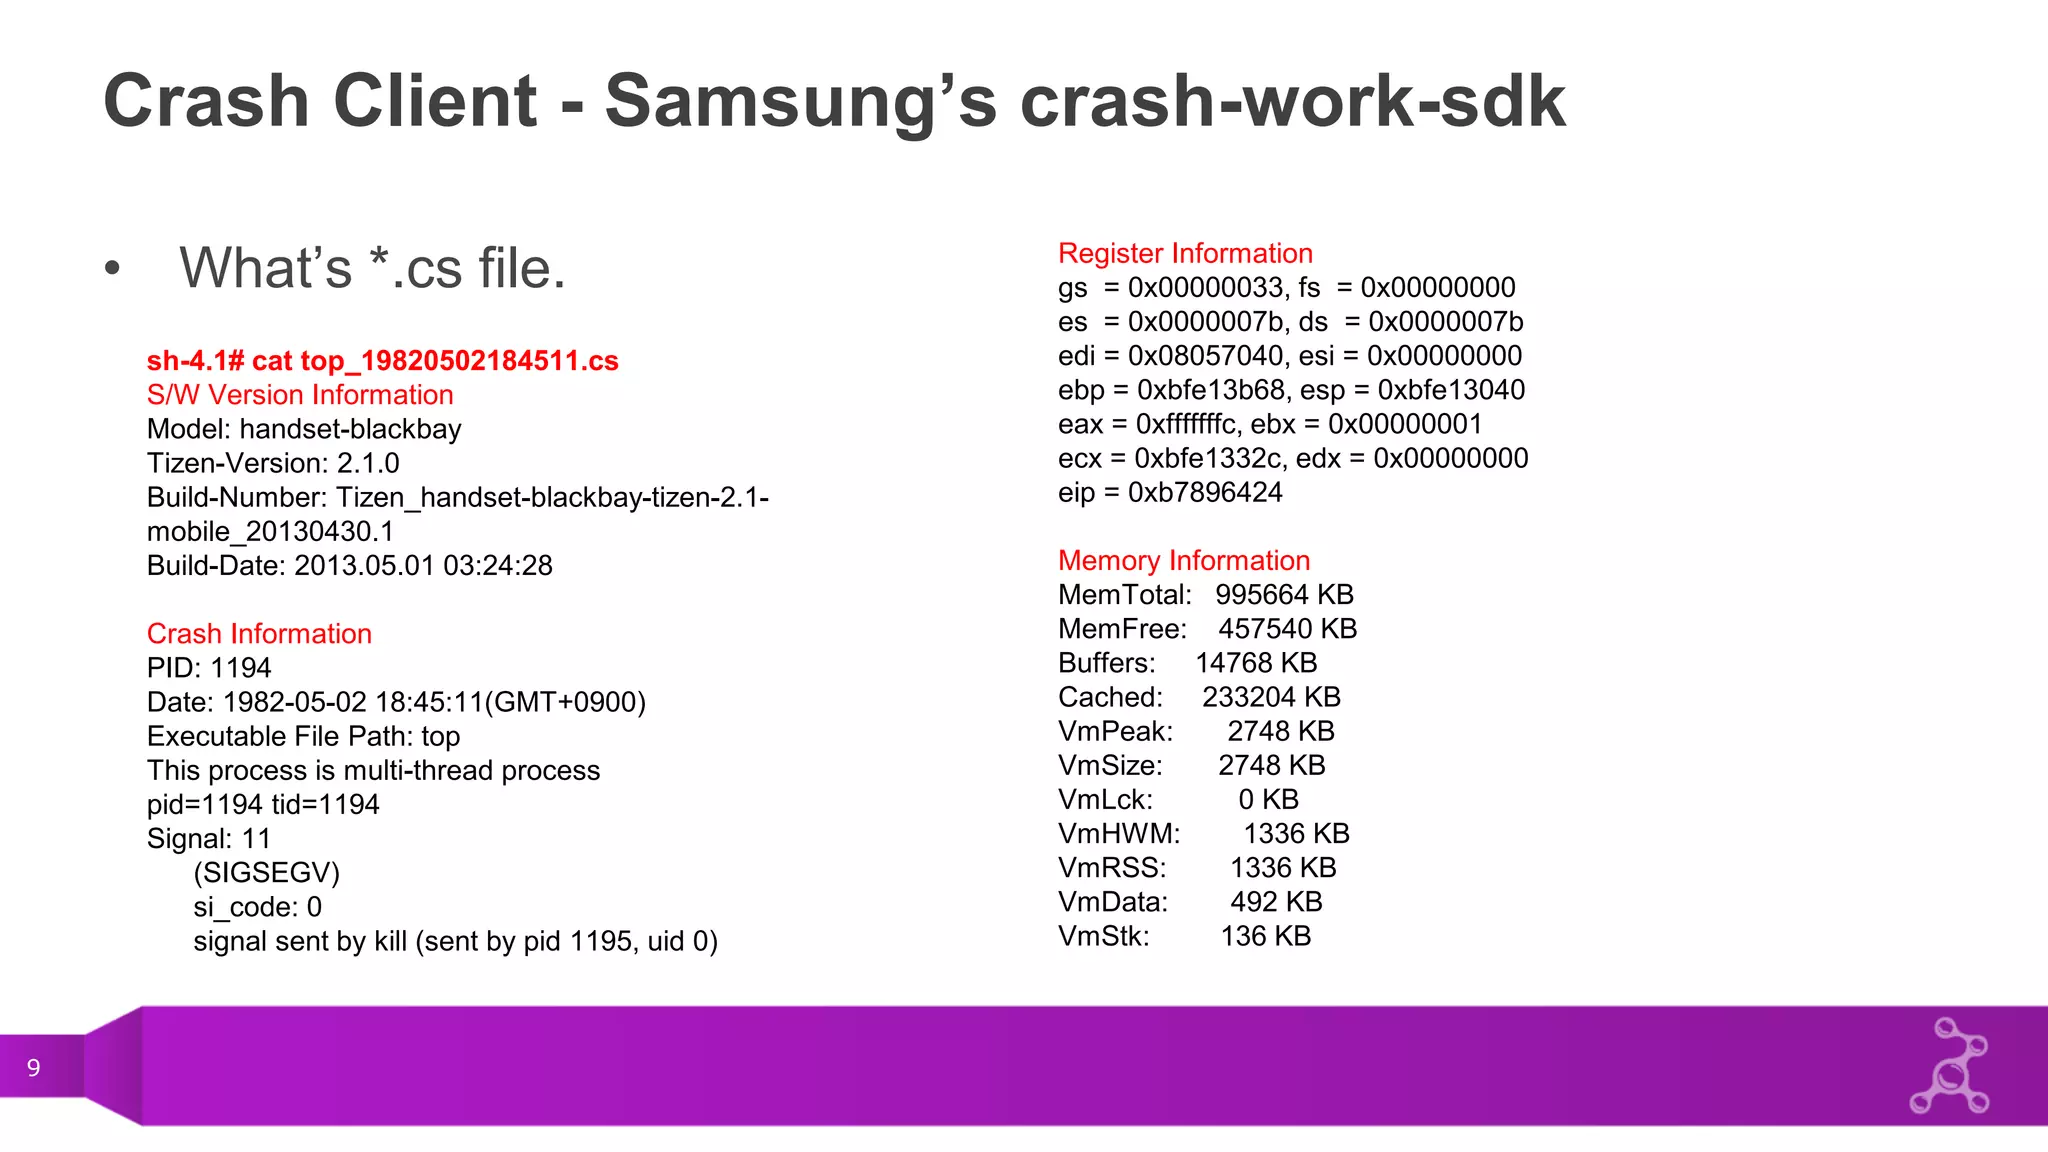
Crash Client - Samsung’s crash-work-sdk
• What’s *.cs file.
Maps Information
08048000 08056000 r-xp /usr/bin/top
b7683000 b768d000 r-xp /lib/libnss_files-2.13.so
b768f000 b7698000 r-xp /lib/libnss_nis-2.13.so
b769a000 b76ad000 r-xp /lib/libnsl-2.13.so
b76b1000 b76b7000 r-xp /lib/libnss_compat-2.13.so
b76ba000 b76bc000 r-xp /lib/libdl-2.13.so
b76be000 b7814000 r-xp /lib/libc-2.13.so
b781a000 b7857000 r-xp /usr/lib/libncurses.so.5.7
b785a000 b7868000 r-xp /lib/libproc-3.2.8.so
b788e000 b7892000 r-xp /usr/lib/libsys-assert.so
b7896000 b7897000 r-xp [vdso]
b7897000 b78b3000 r-xp /lib/ld-2.13.so
End of Maps Information
Callstack Information (PID:1194)
Call Stack Count: 1
can't open 0: (0x8049a81) [top] + 0x1a81
End of Call Stack
Latest Debug Message Information
--------- beginning of /dev/log_main
05-02 16:31:42.769 E/Tizen::App( 616): void
Tizen::App::_ConditionManagerStub::OnInstallComplete(const
Tizen::App::AppId&)(133) > failed to
GetAppLaunchConditionListN(org.tizen.taskmgr)
…
omPackageManager(const Tizen::Base::String&, const
Tizen::Base::String&, const Tizen::Base::String&)(493) > Cannot
acquire feature list.
05-02 16:31:43.819 E/Tizen::App( 616): void Tizen::App::_
End of latest debug message](https://image.slidesharecdn.com/8f61bcb2-8460-4a6f-8ae6-25a469f23554-151129154151-lva1-app6892/75/Crash_Report_Mechanism_In_Tizen-10-2048.jpg)
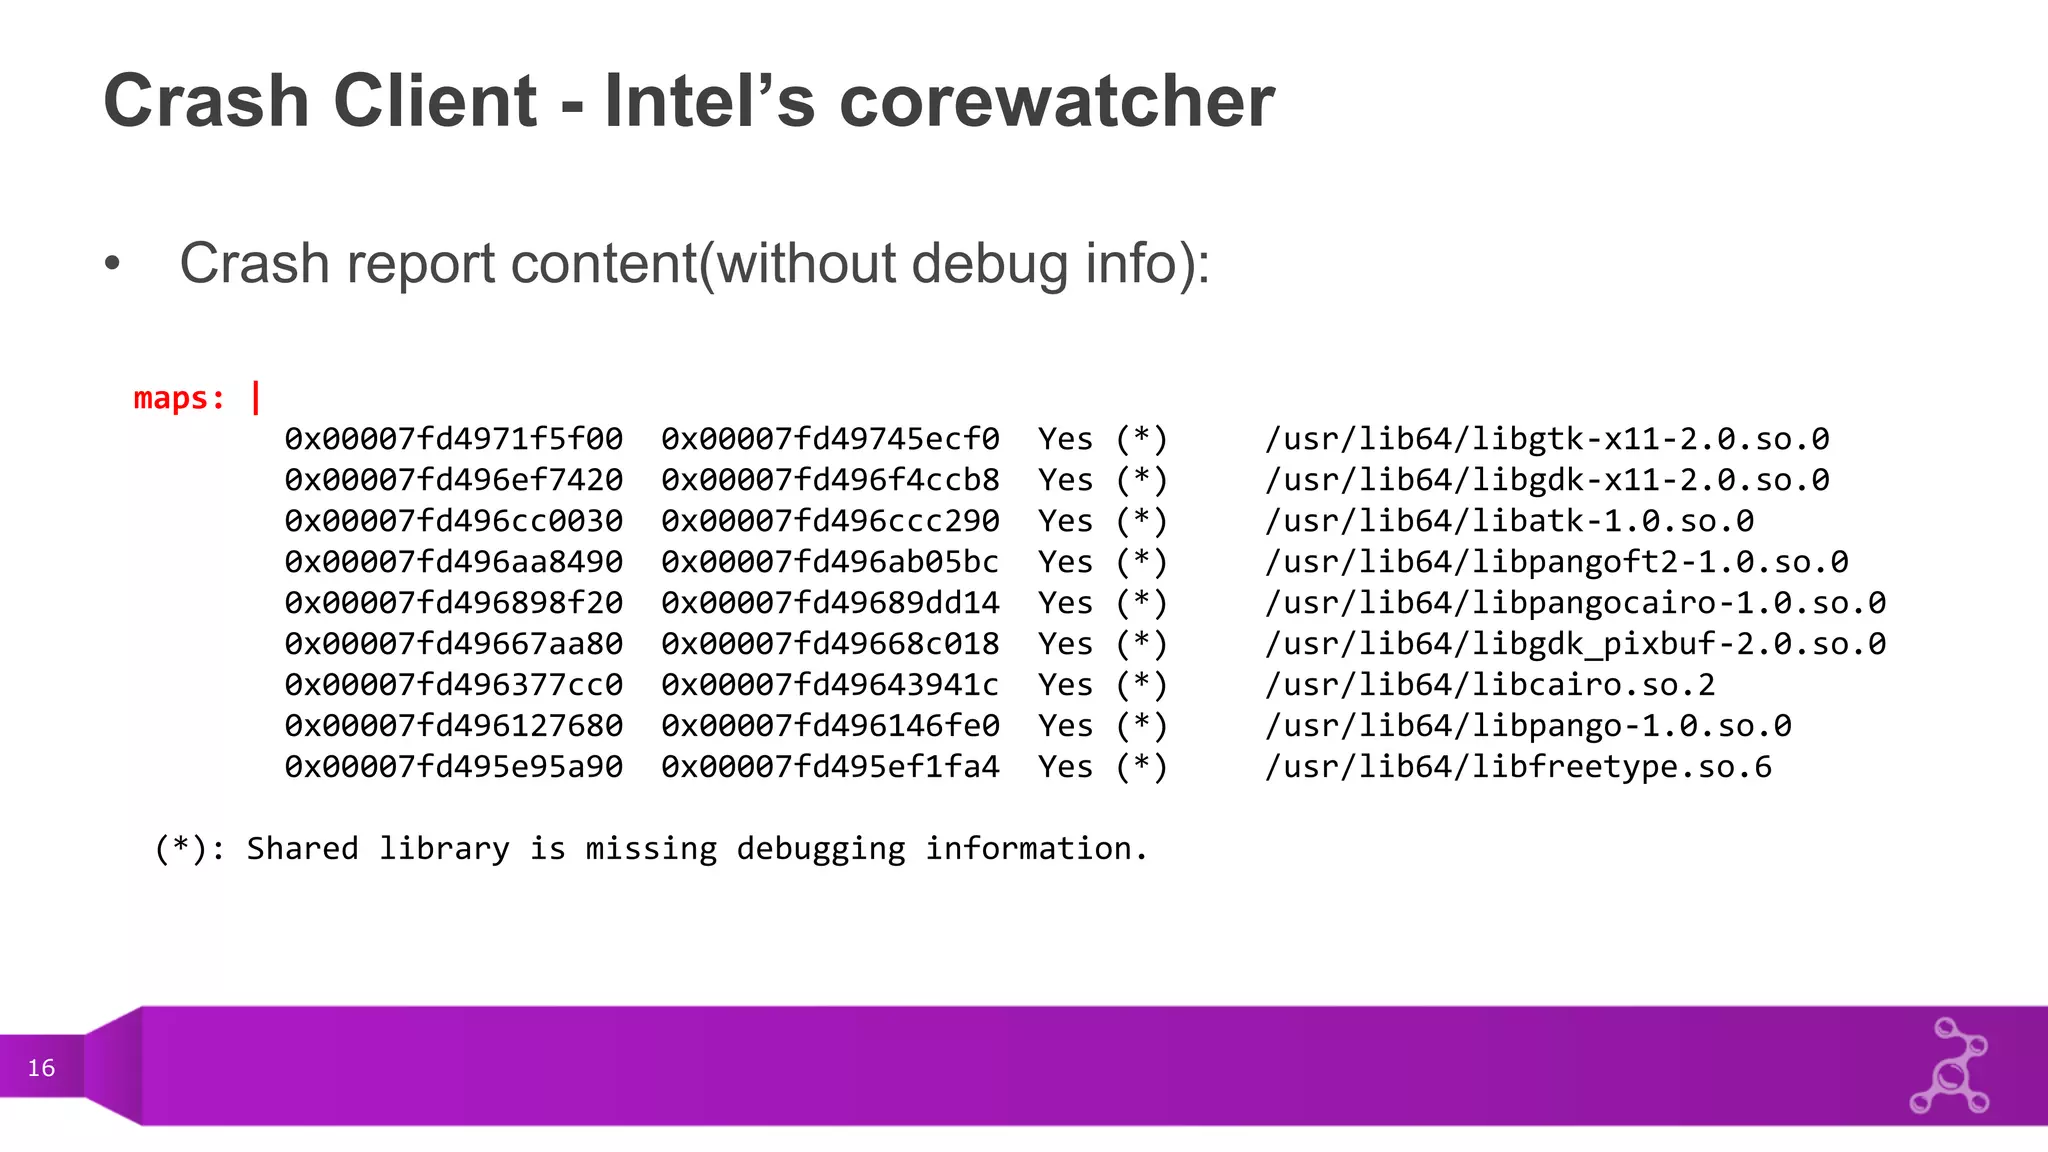
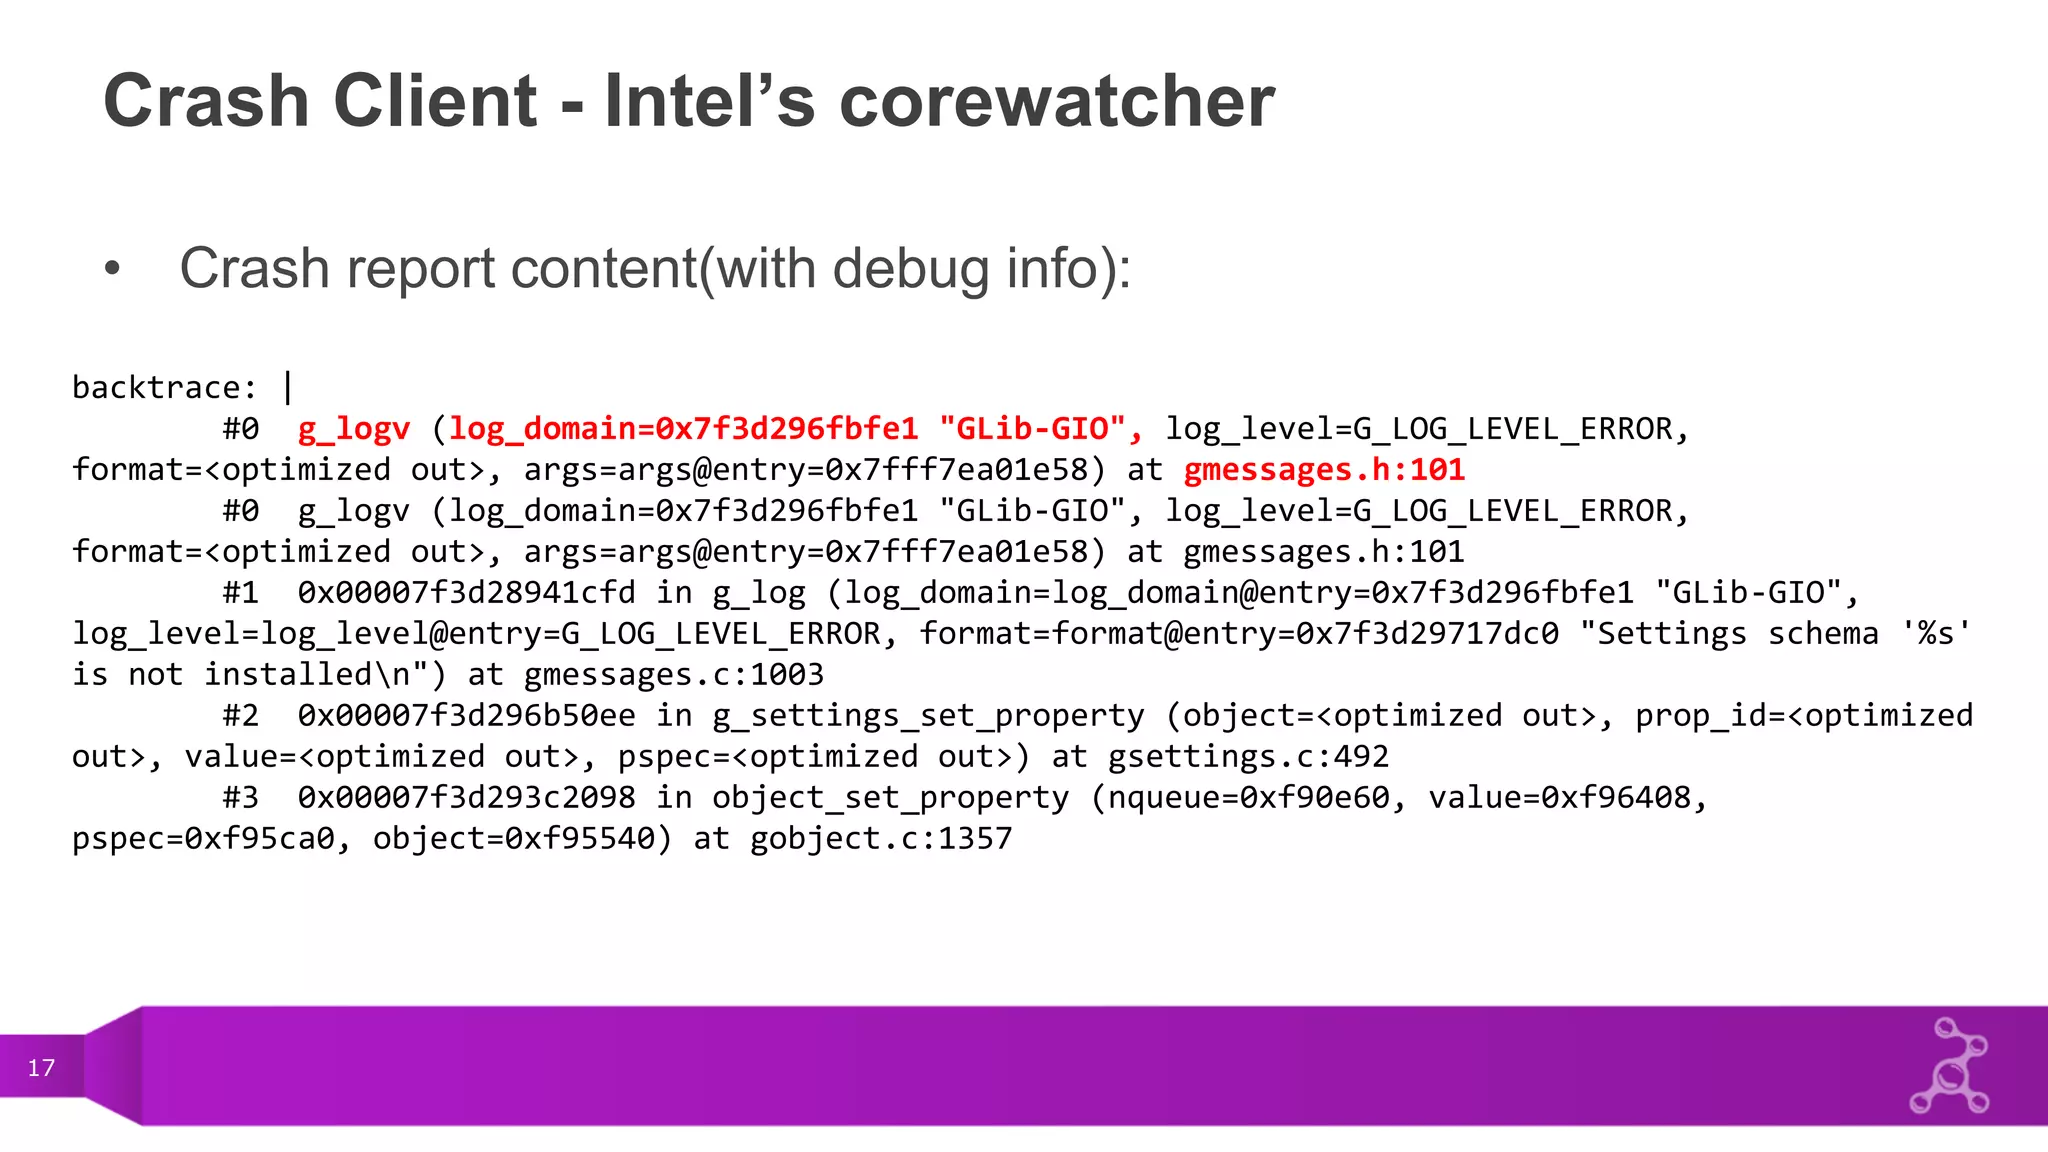
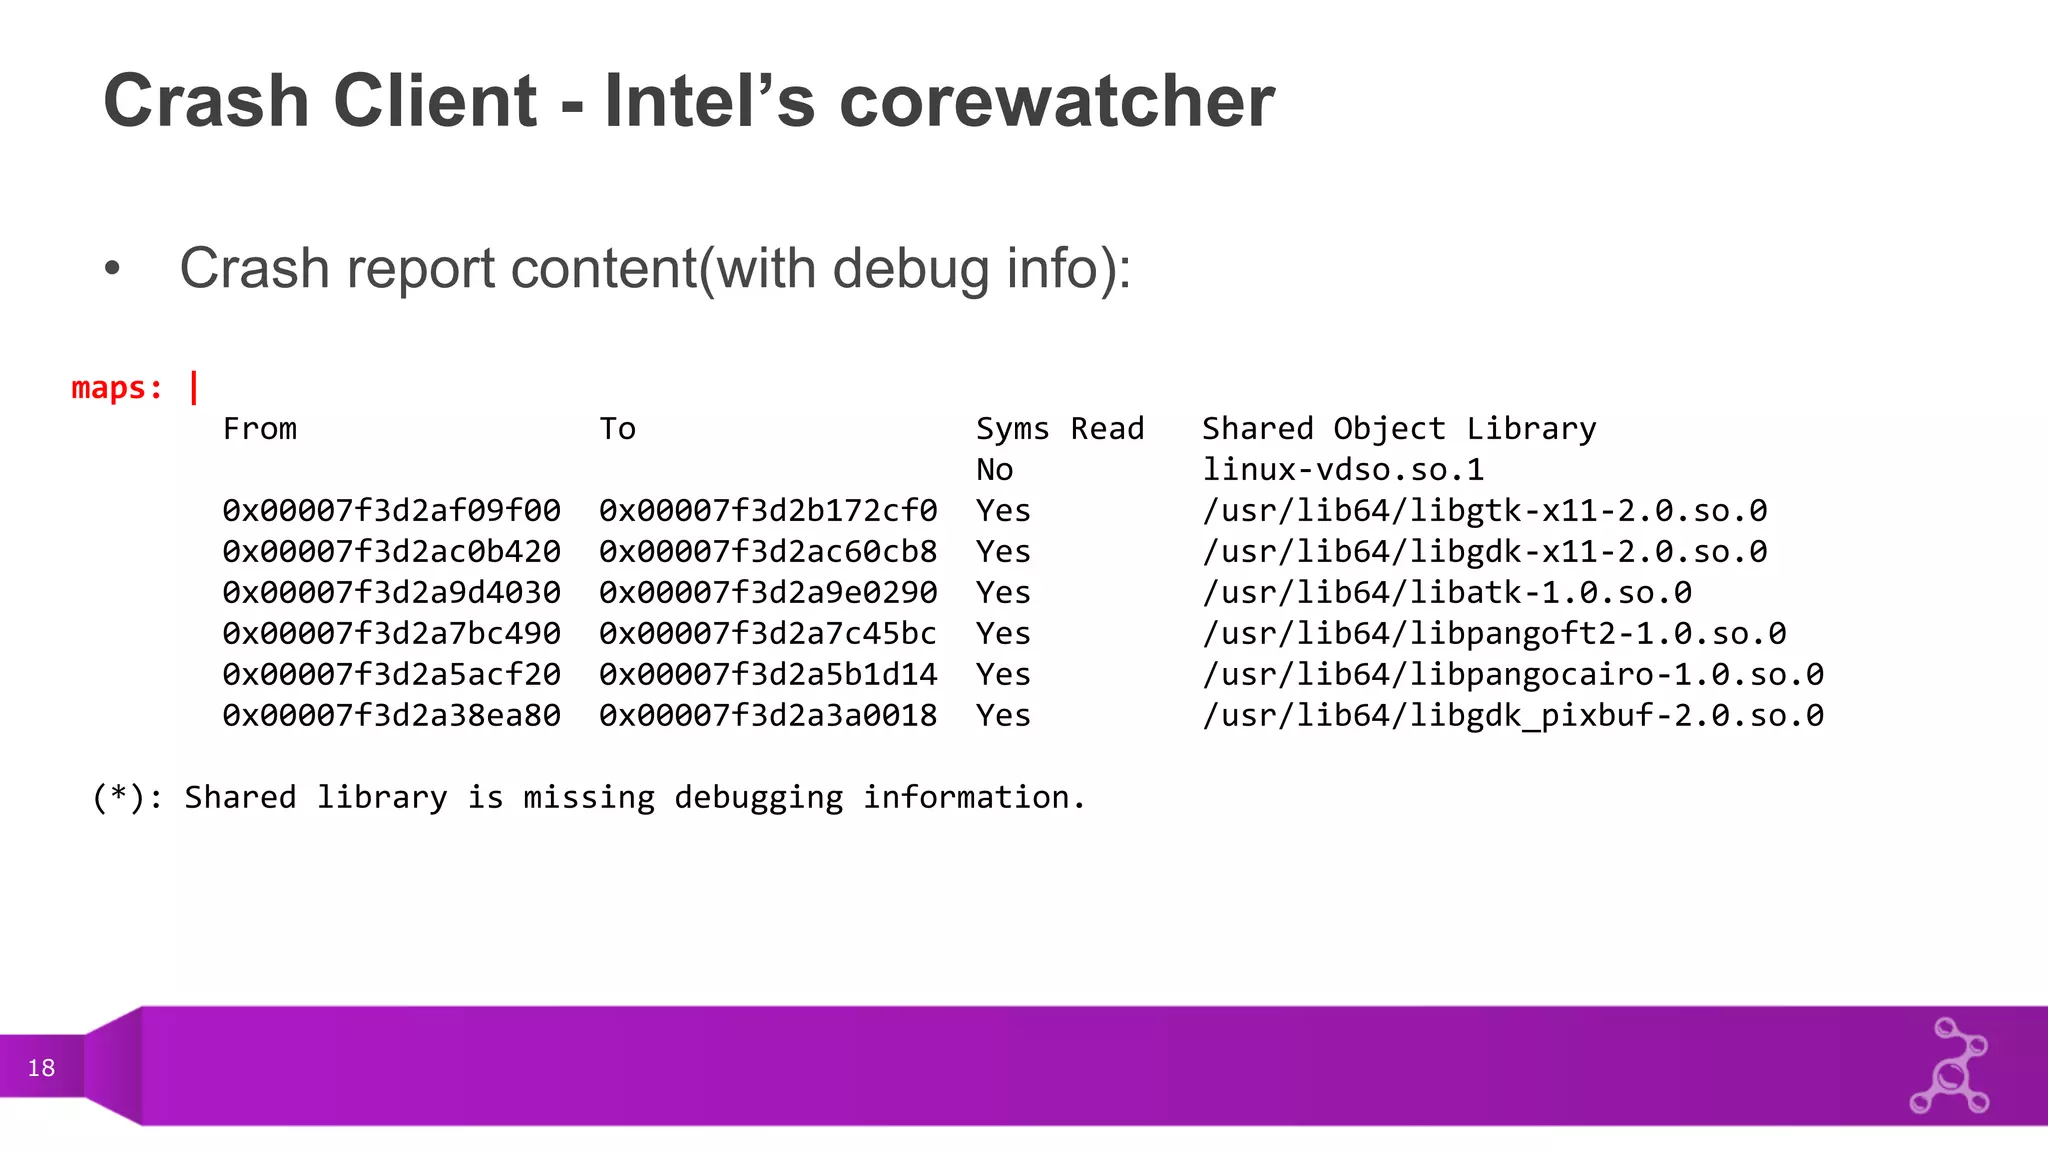
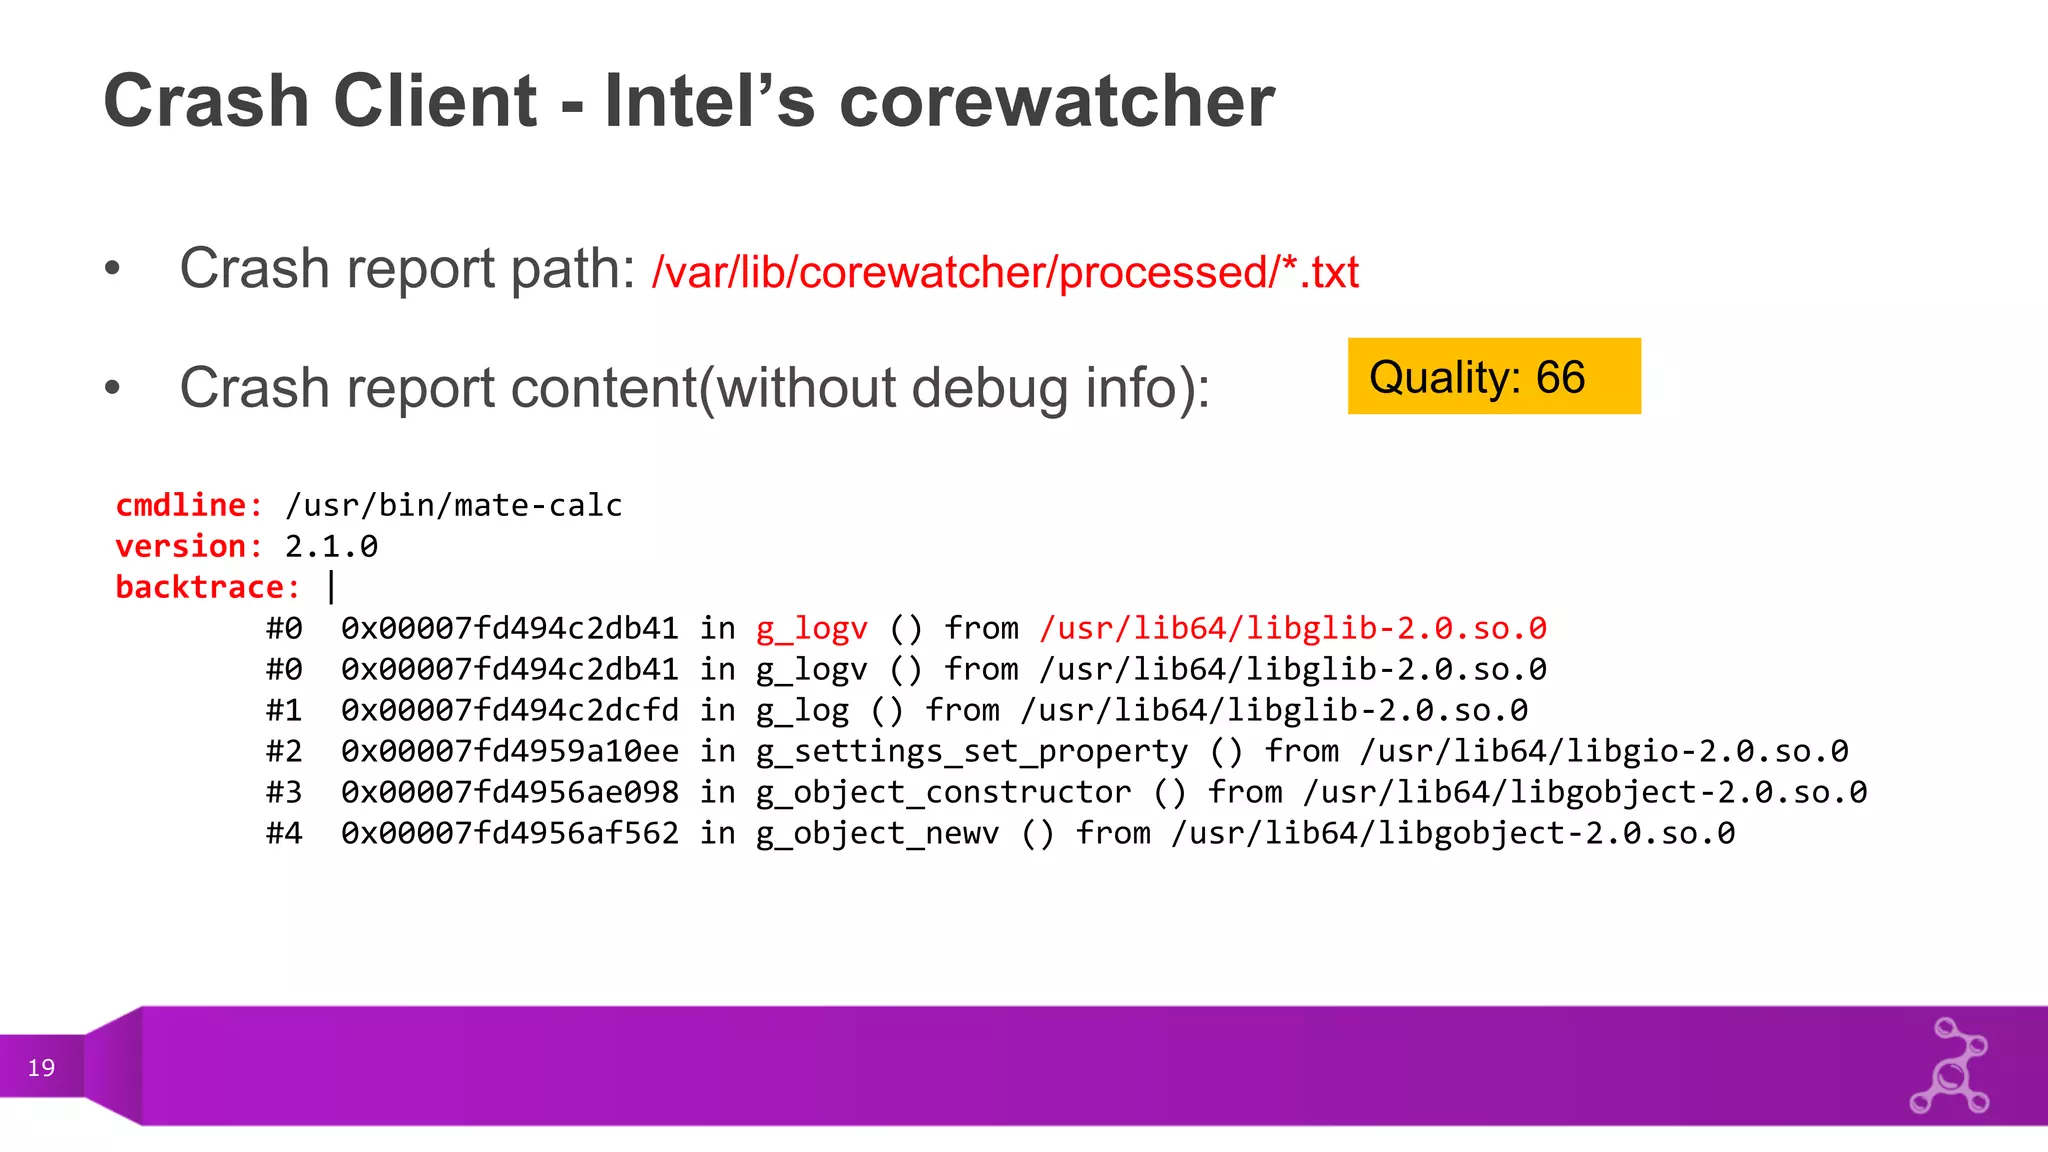
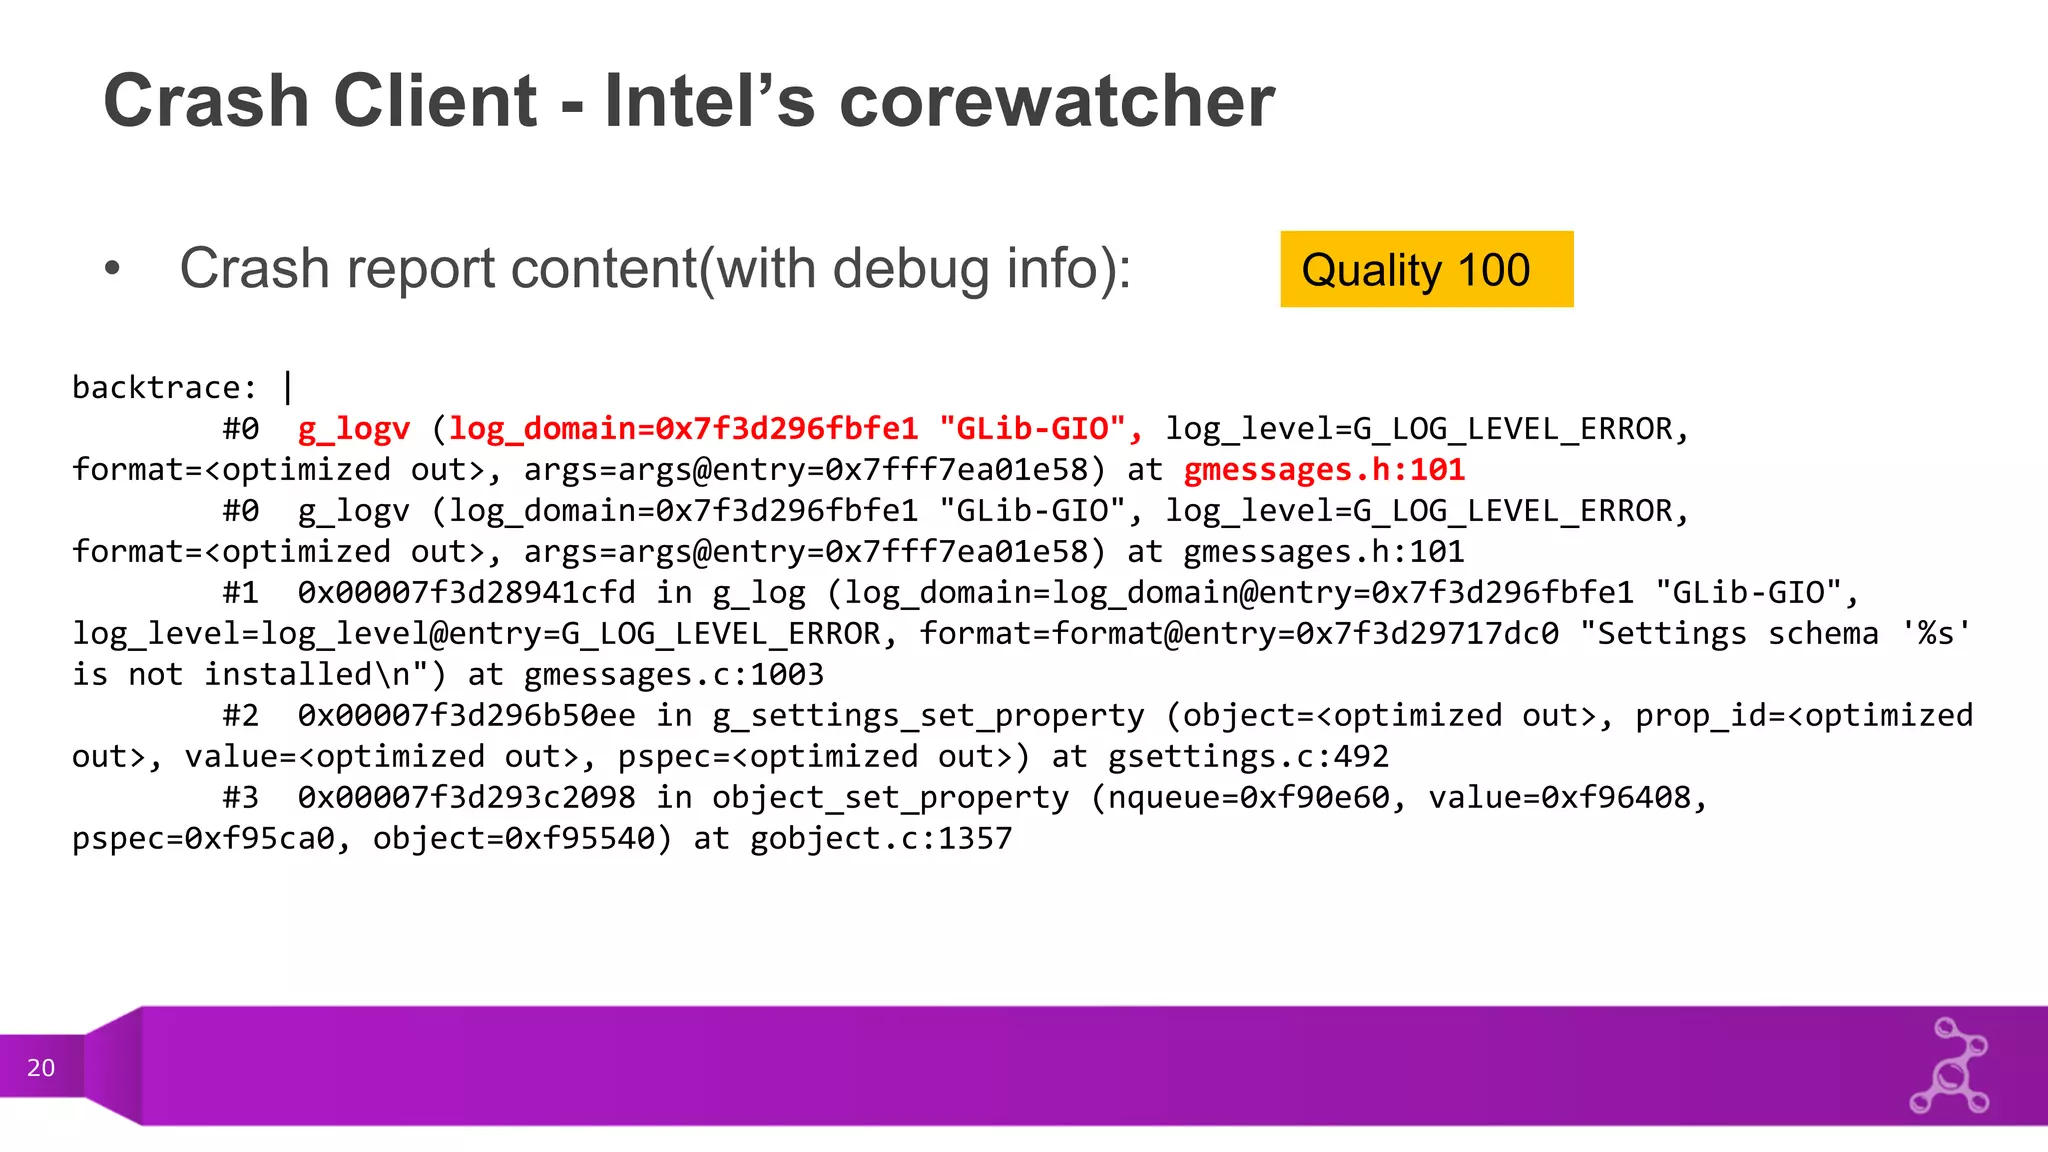
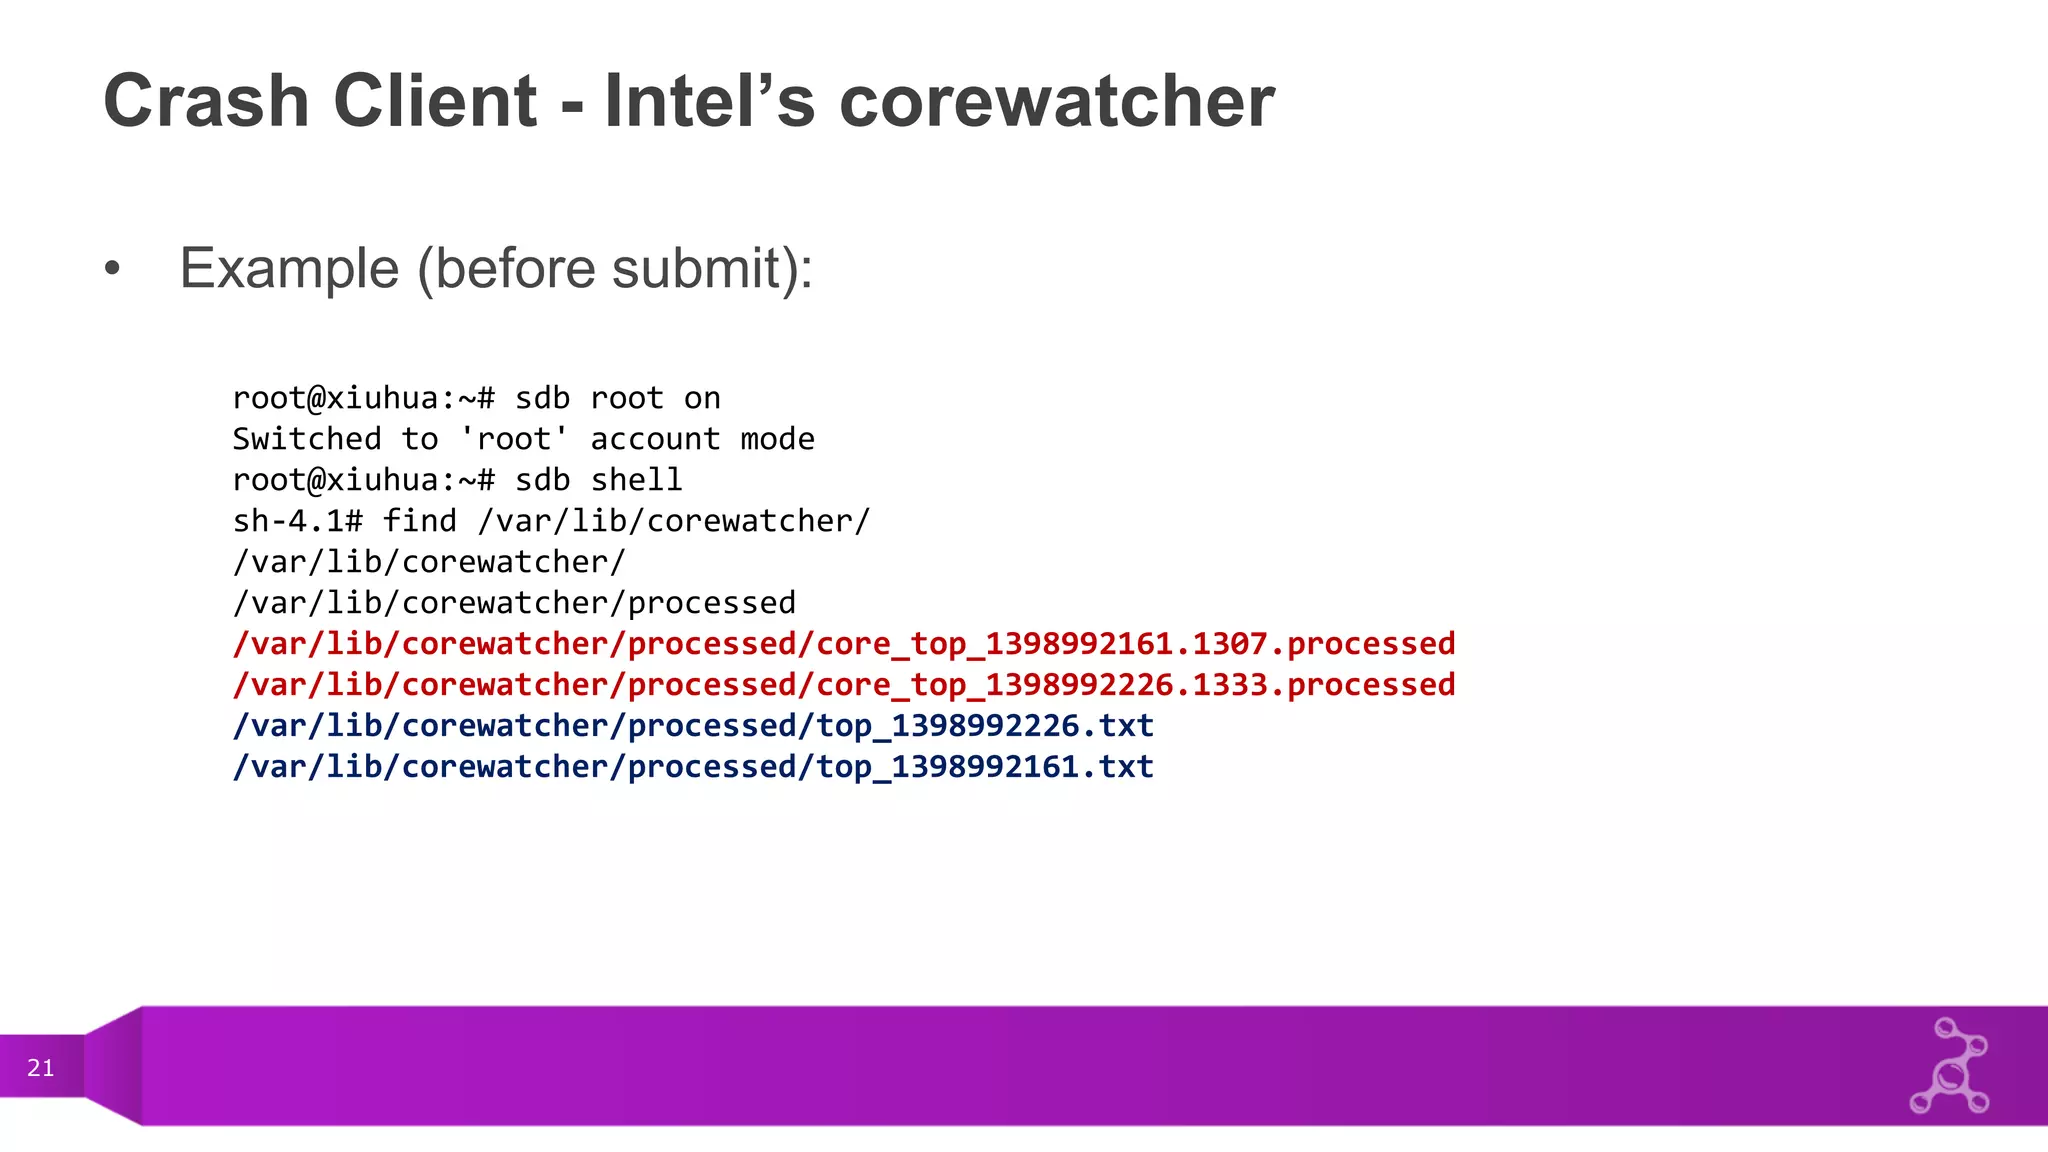
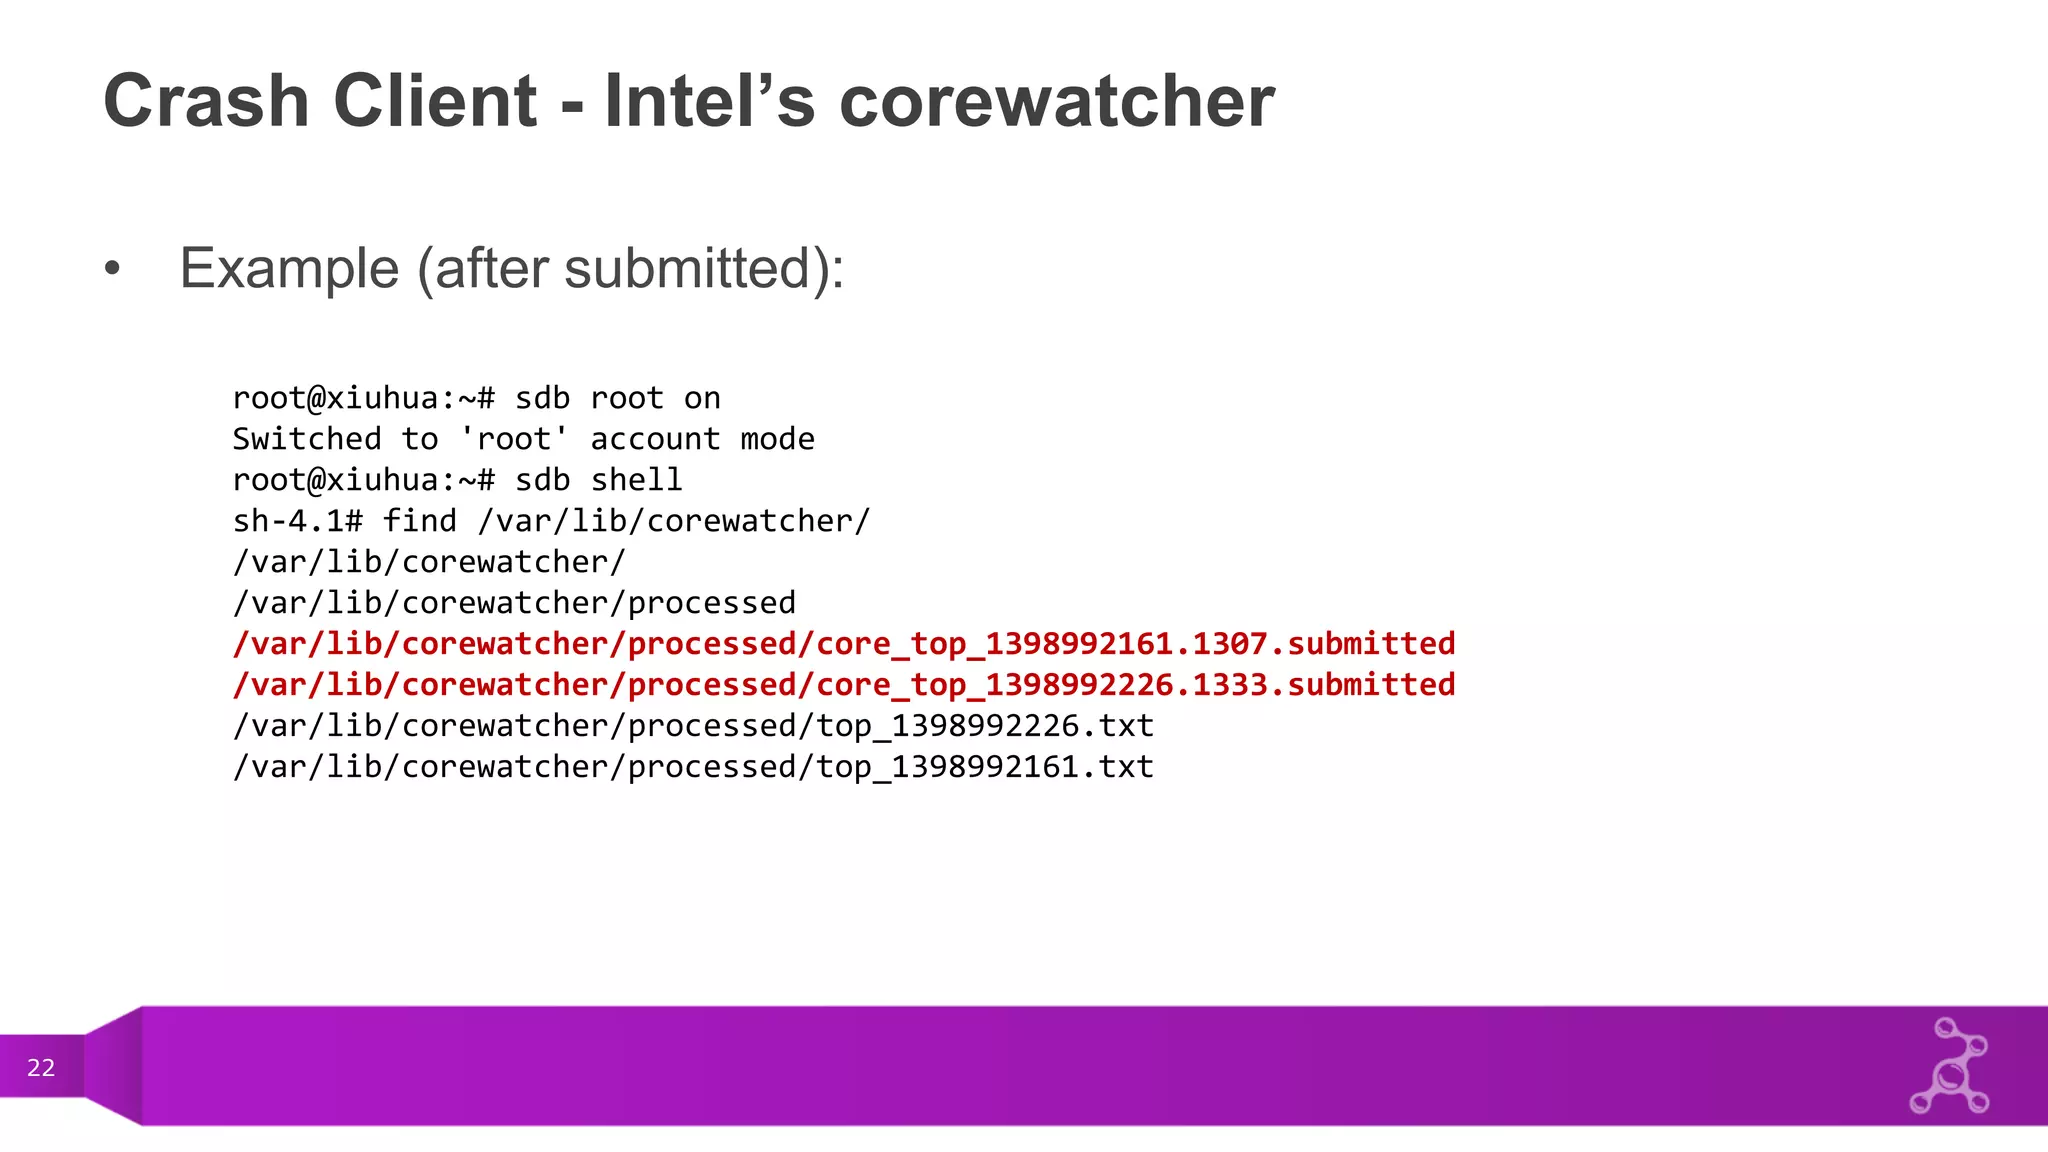
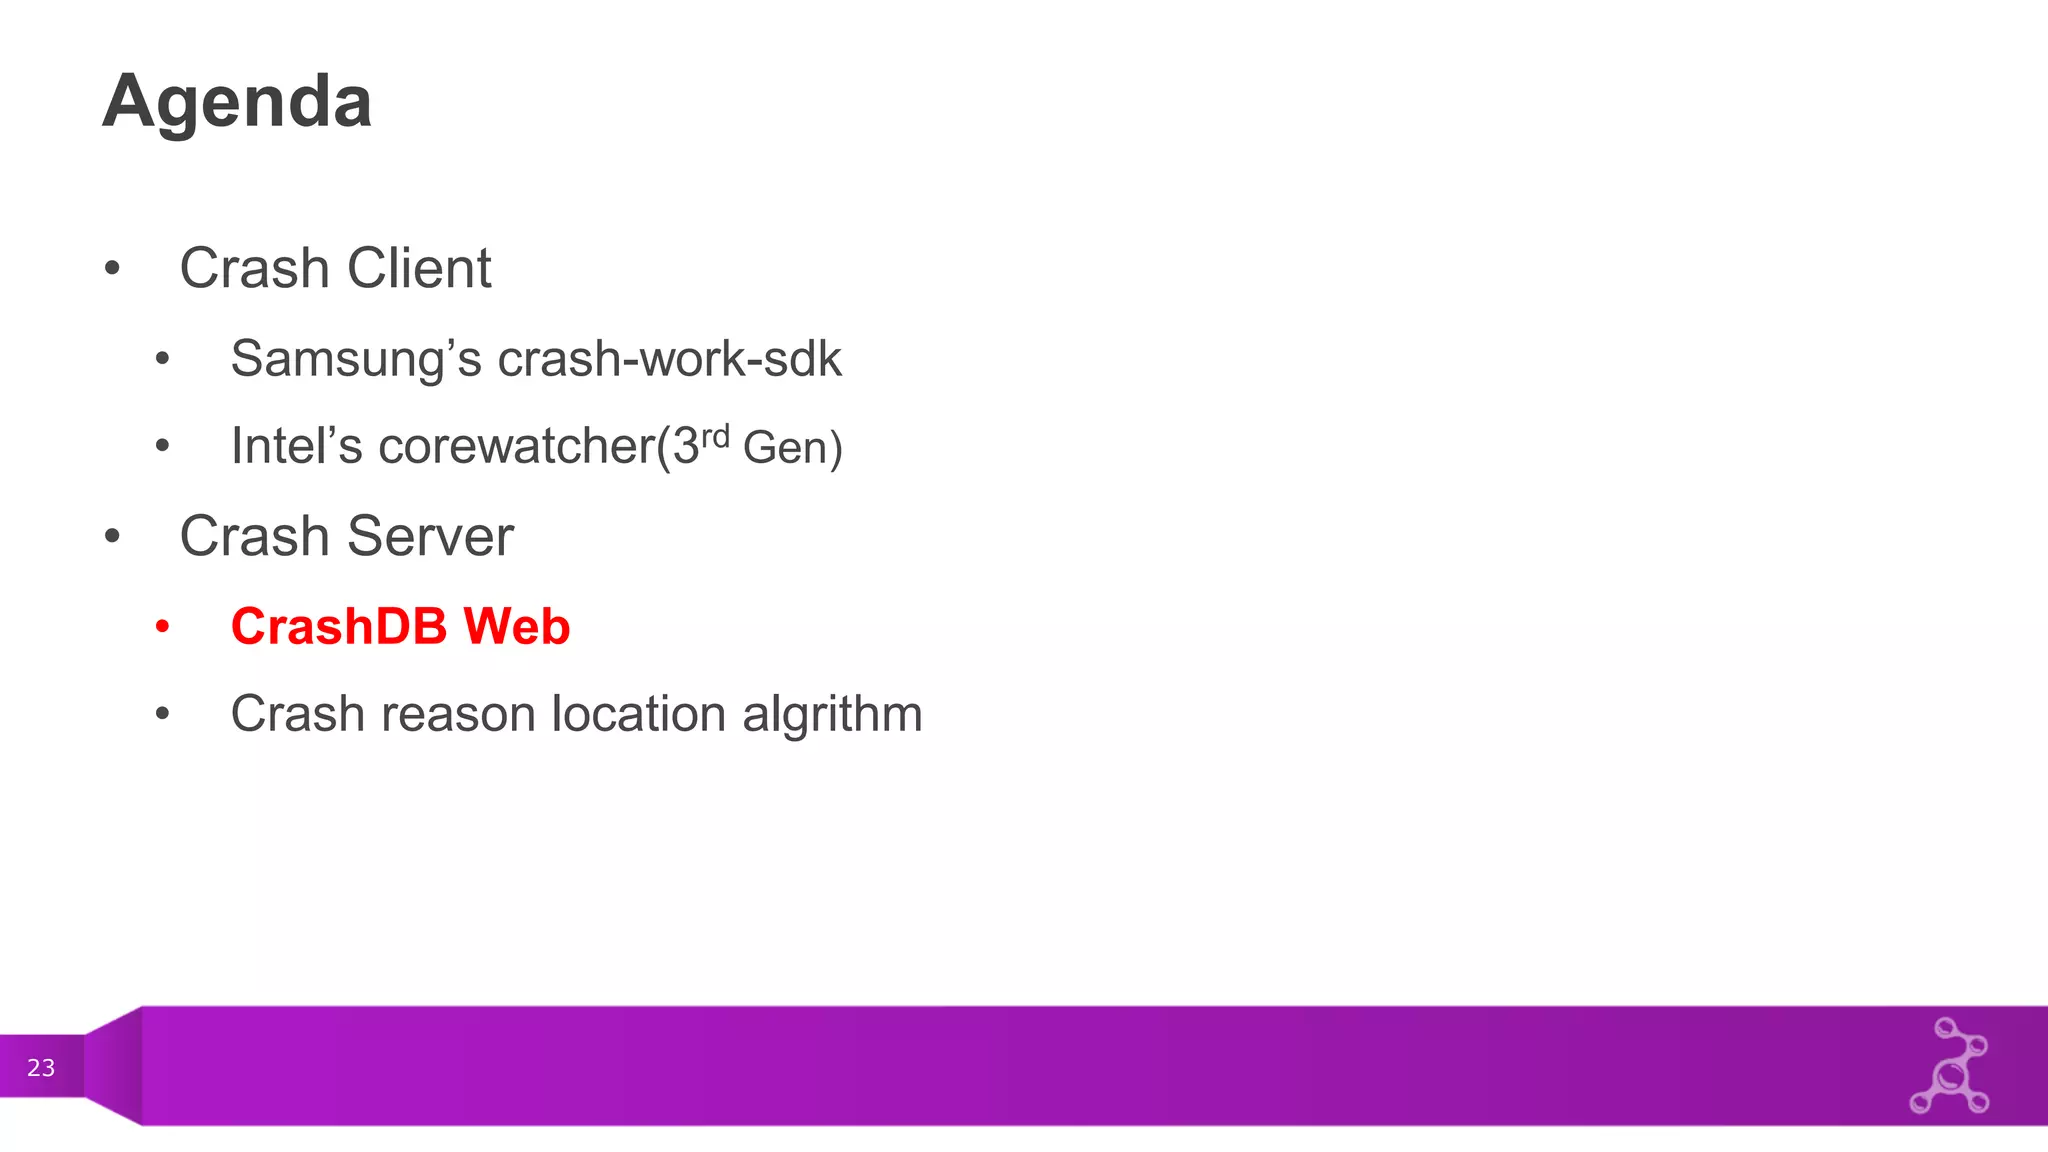
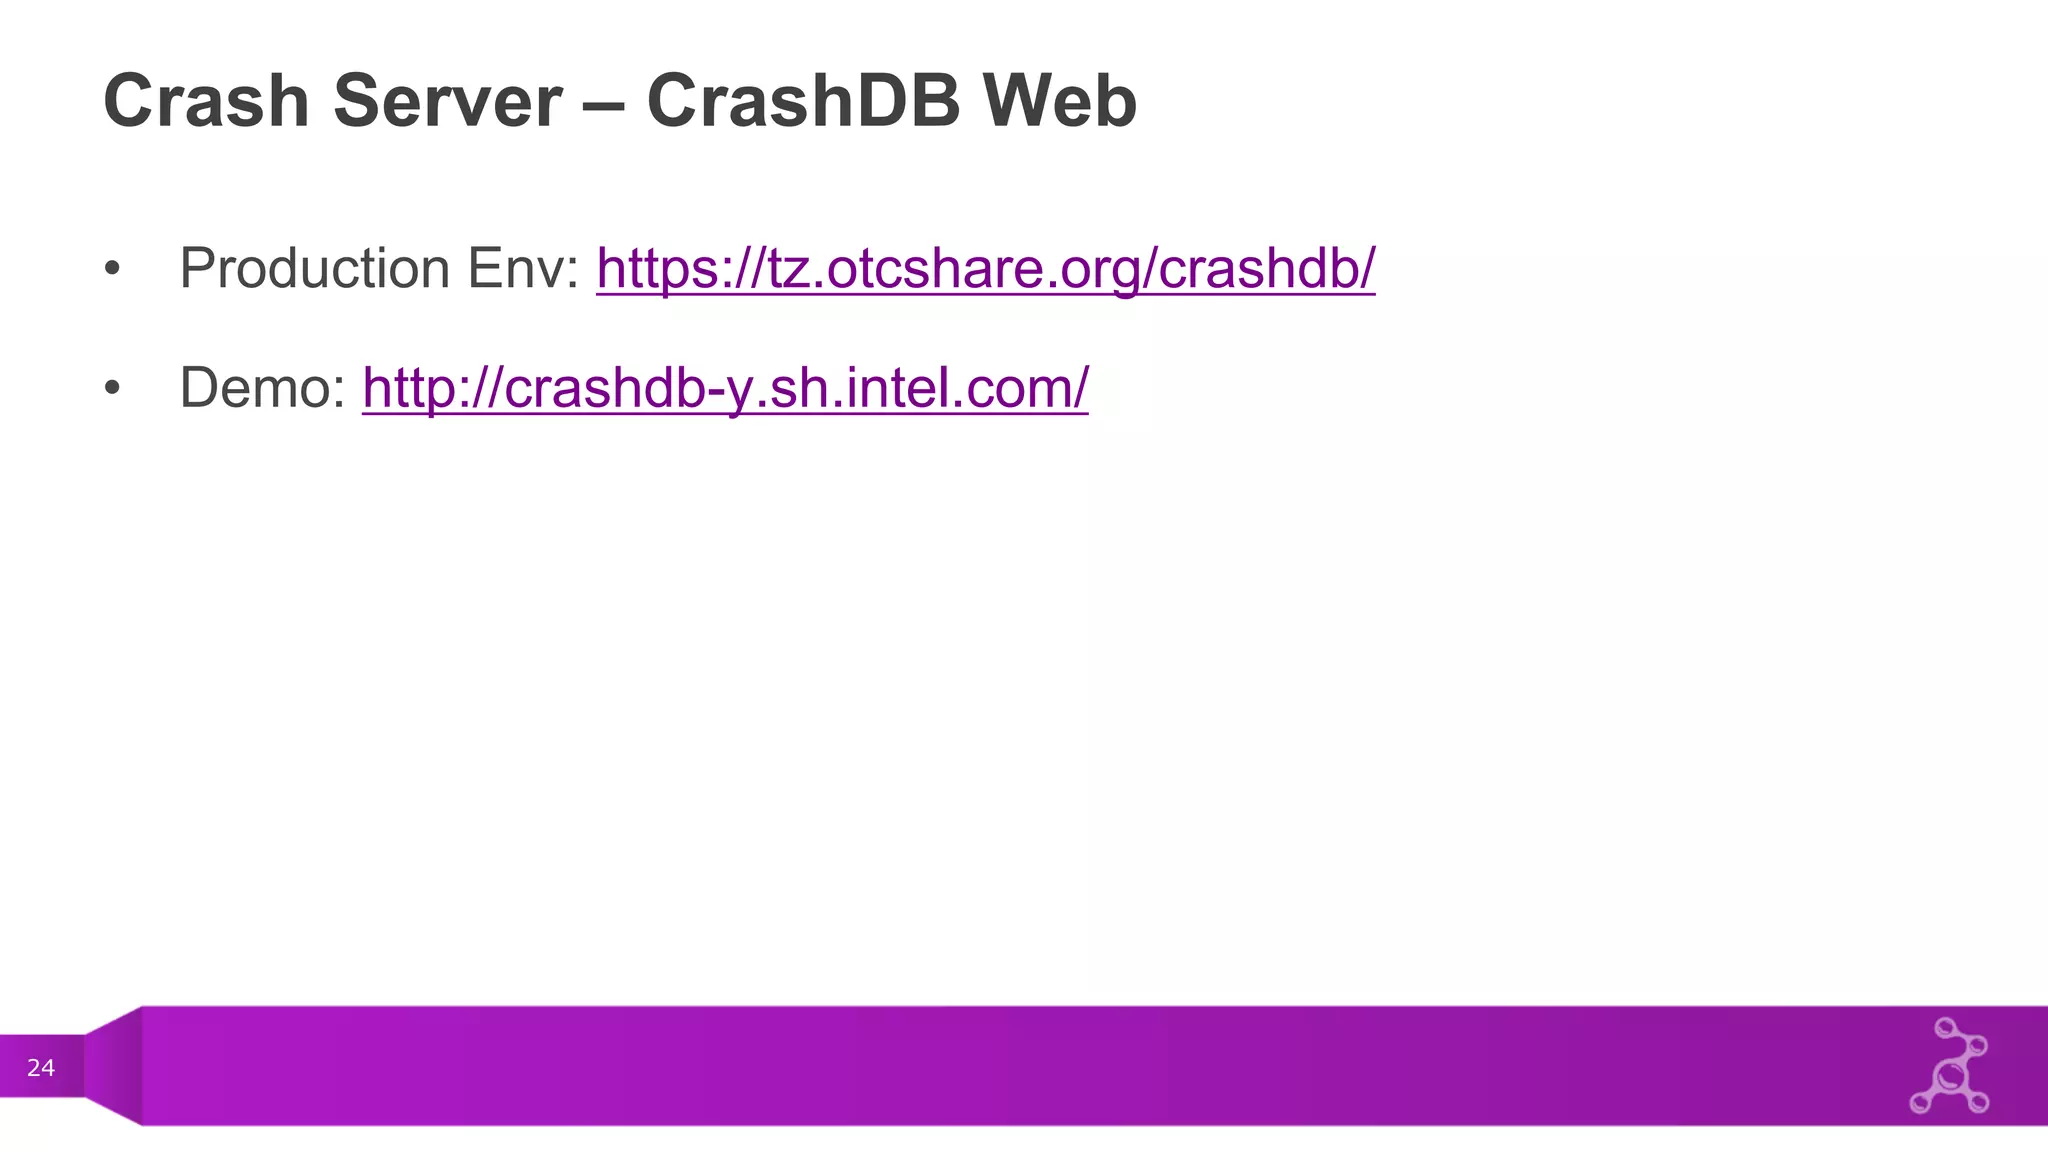

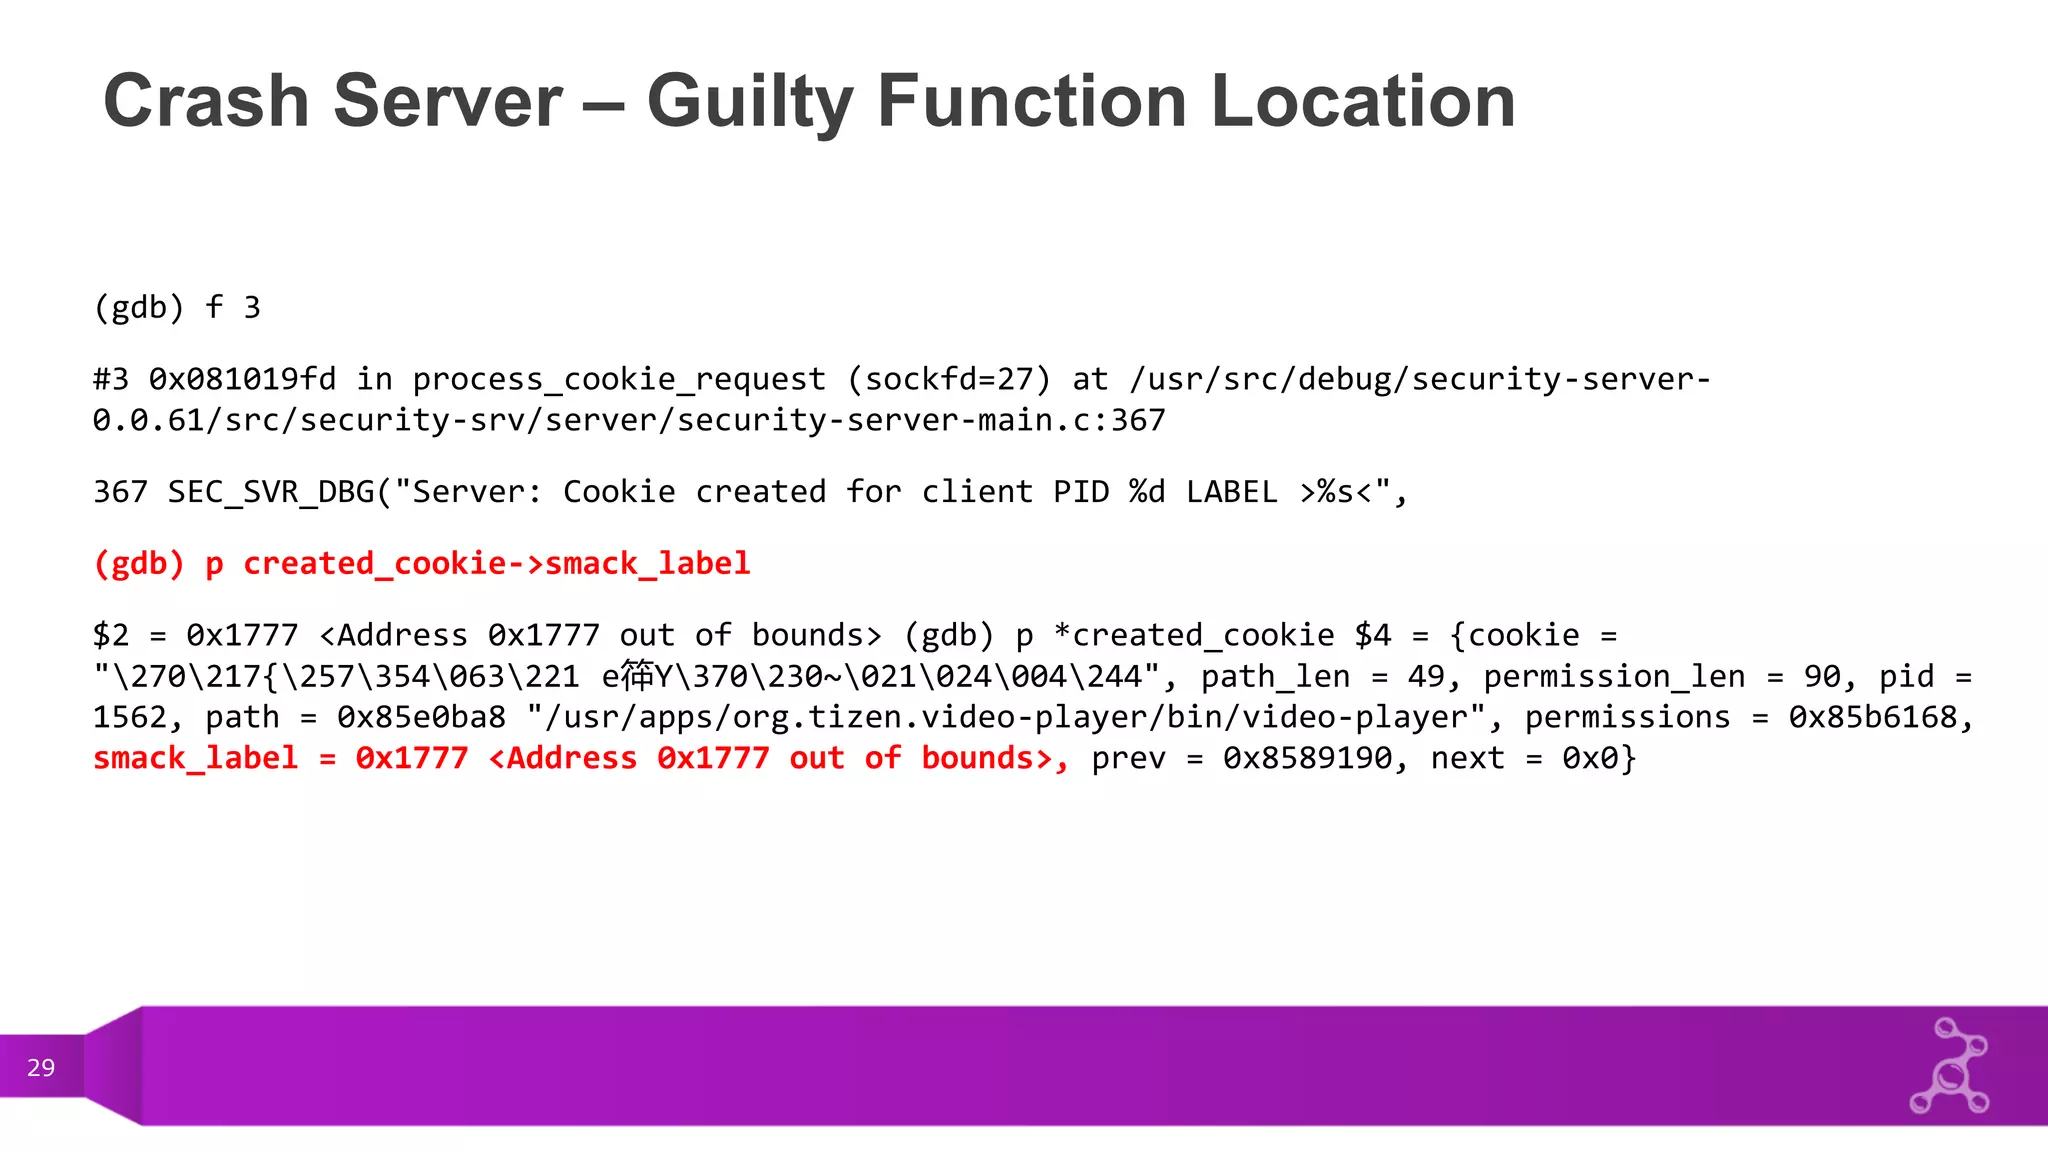
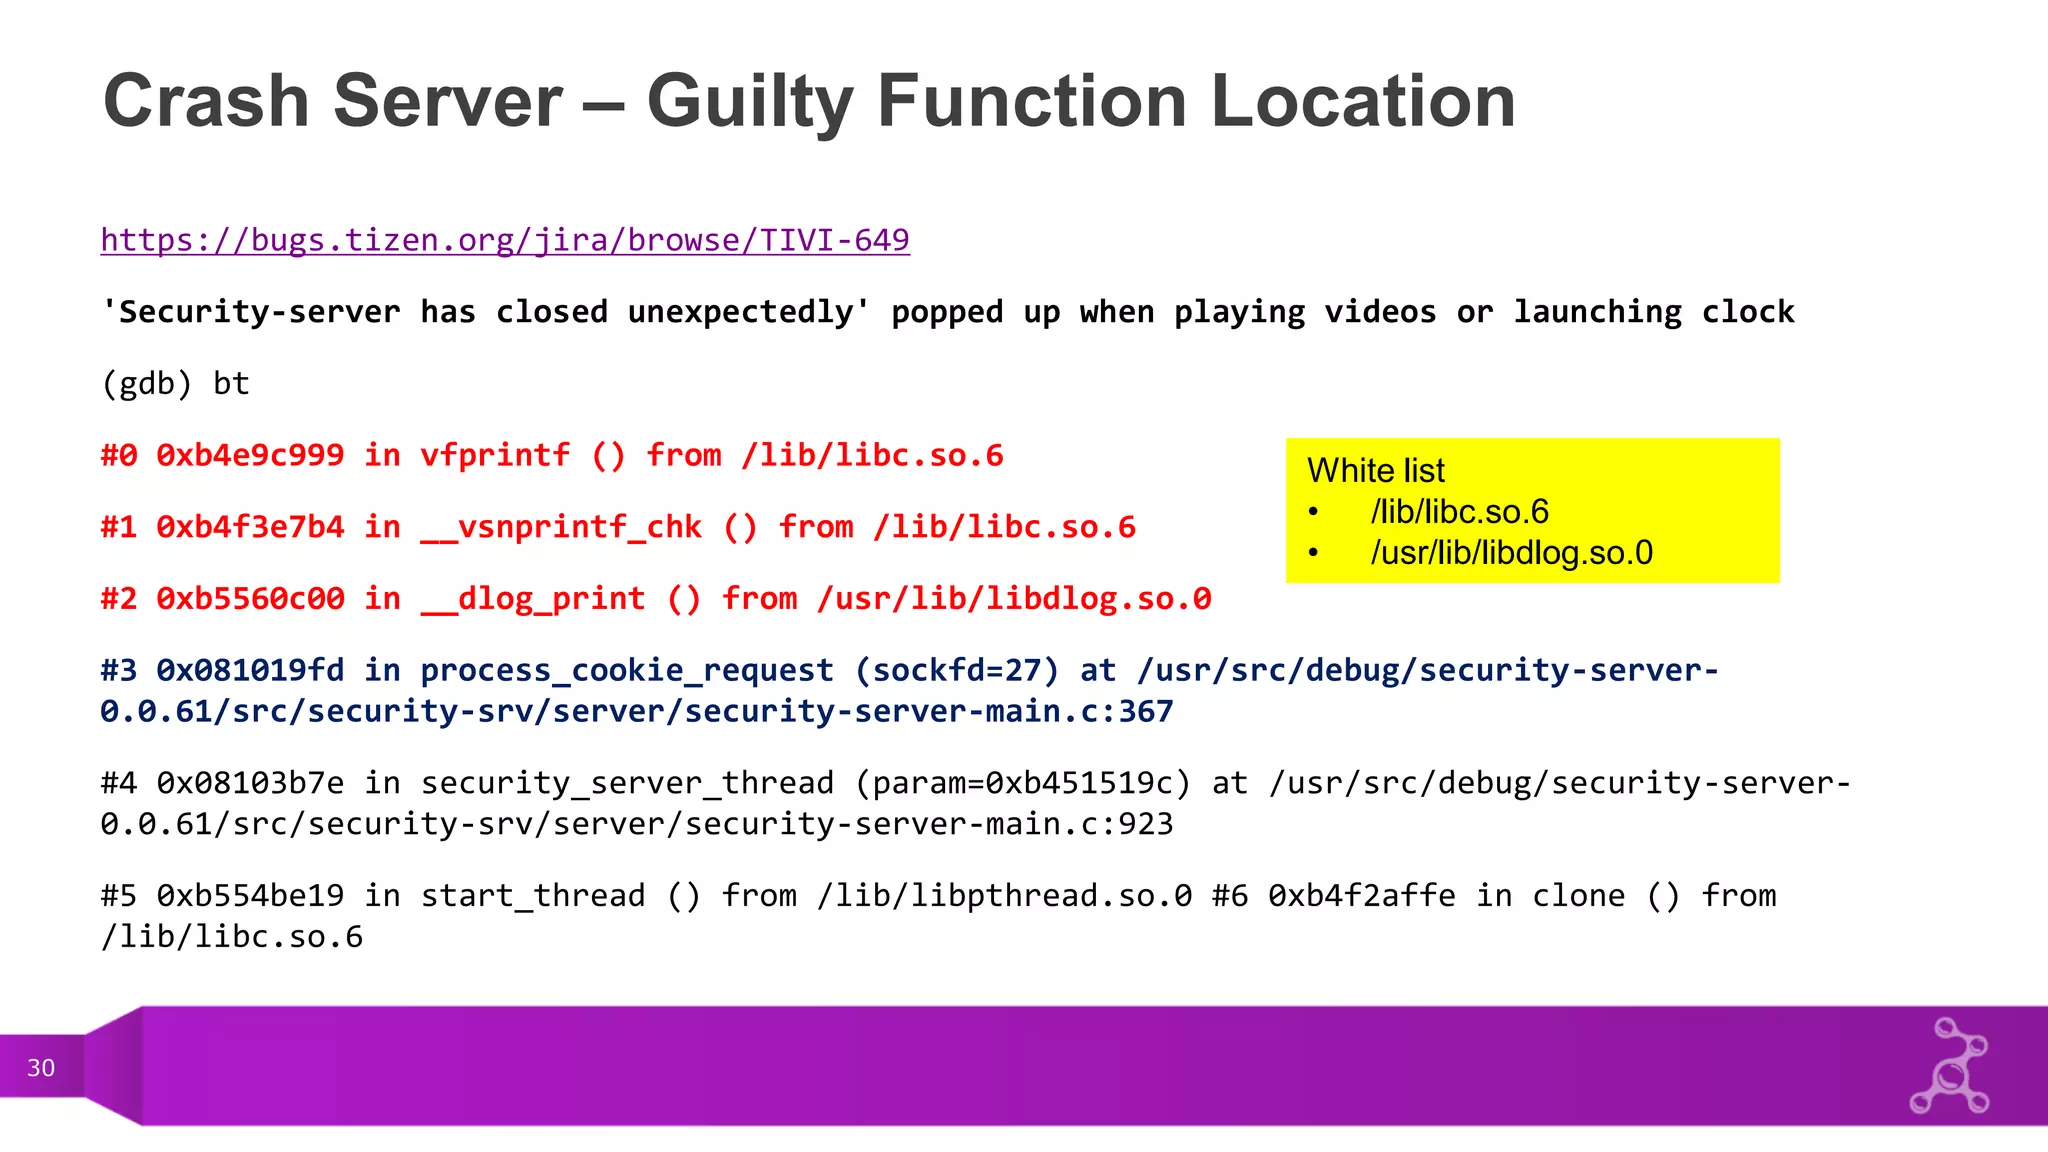


This document discusses the crash reporting mechanism in Tizen. It describes the crash client, which handles crash signals and generates crash reports. It covers Samsung's crash-work-sdk and Intel's corewatcher crash clients. It also discusses the crash server that receives reports and the CrashDB web interface. Finally, it mentions crash reason location algorithms.


![[嵌入式系統] MCS-51 實驗 - 使用 IAR (2)](https://cdn.slidesharecdn.com/ss_thumbnails/mcs51iarpart2-150613071717-lva1-app6891-thumbnail.jpg?width=640&height=640&fit=bounds)


![[ZigBee 嵌入式系統] ZigBee 應用實作 - 使用 TI Z-Stack Firmware](https://cdn.slidesharecdn.com/ss_thumbnails/zigbeeappimplementation-150613072040-lva1-app6891-thumbnail.jpg?width=640&height=640&fit=bounds)