The document summarizes performance benchmarks comparing PostgreSQL versions from 7.4 to the latest version. The benchmarks show significant performance improvements across different workloads over time, including:
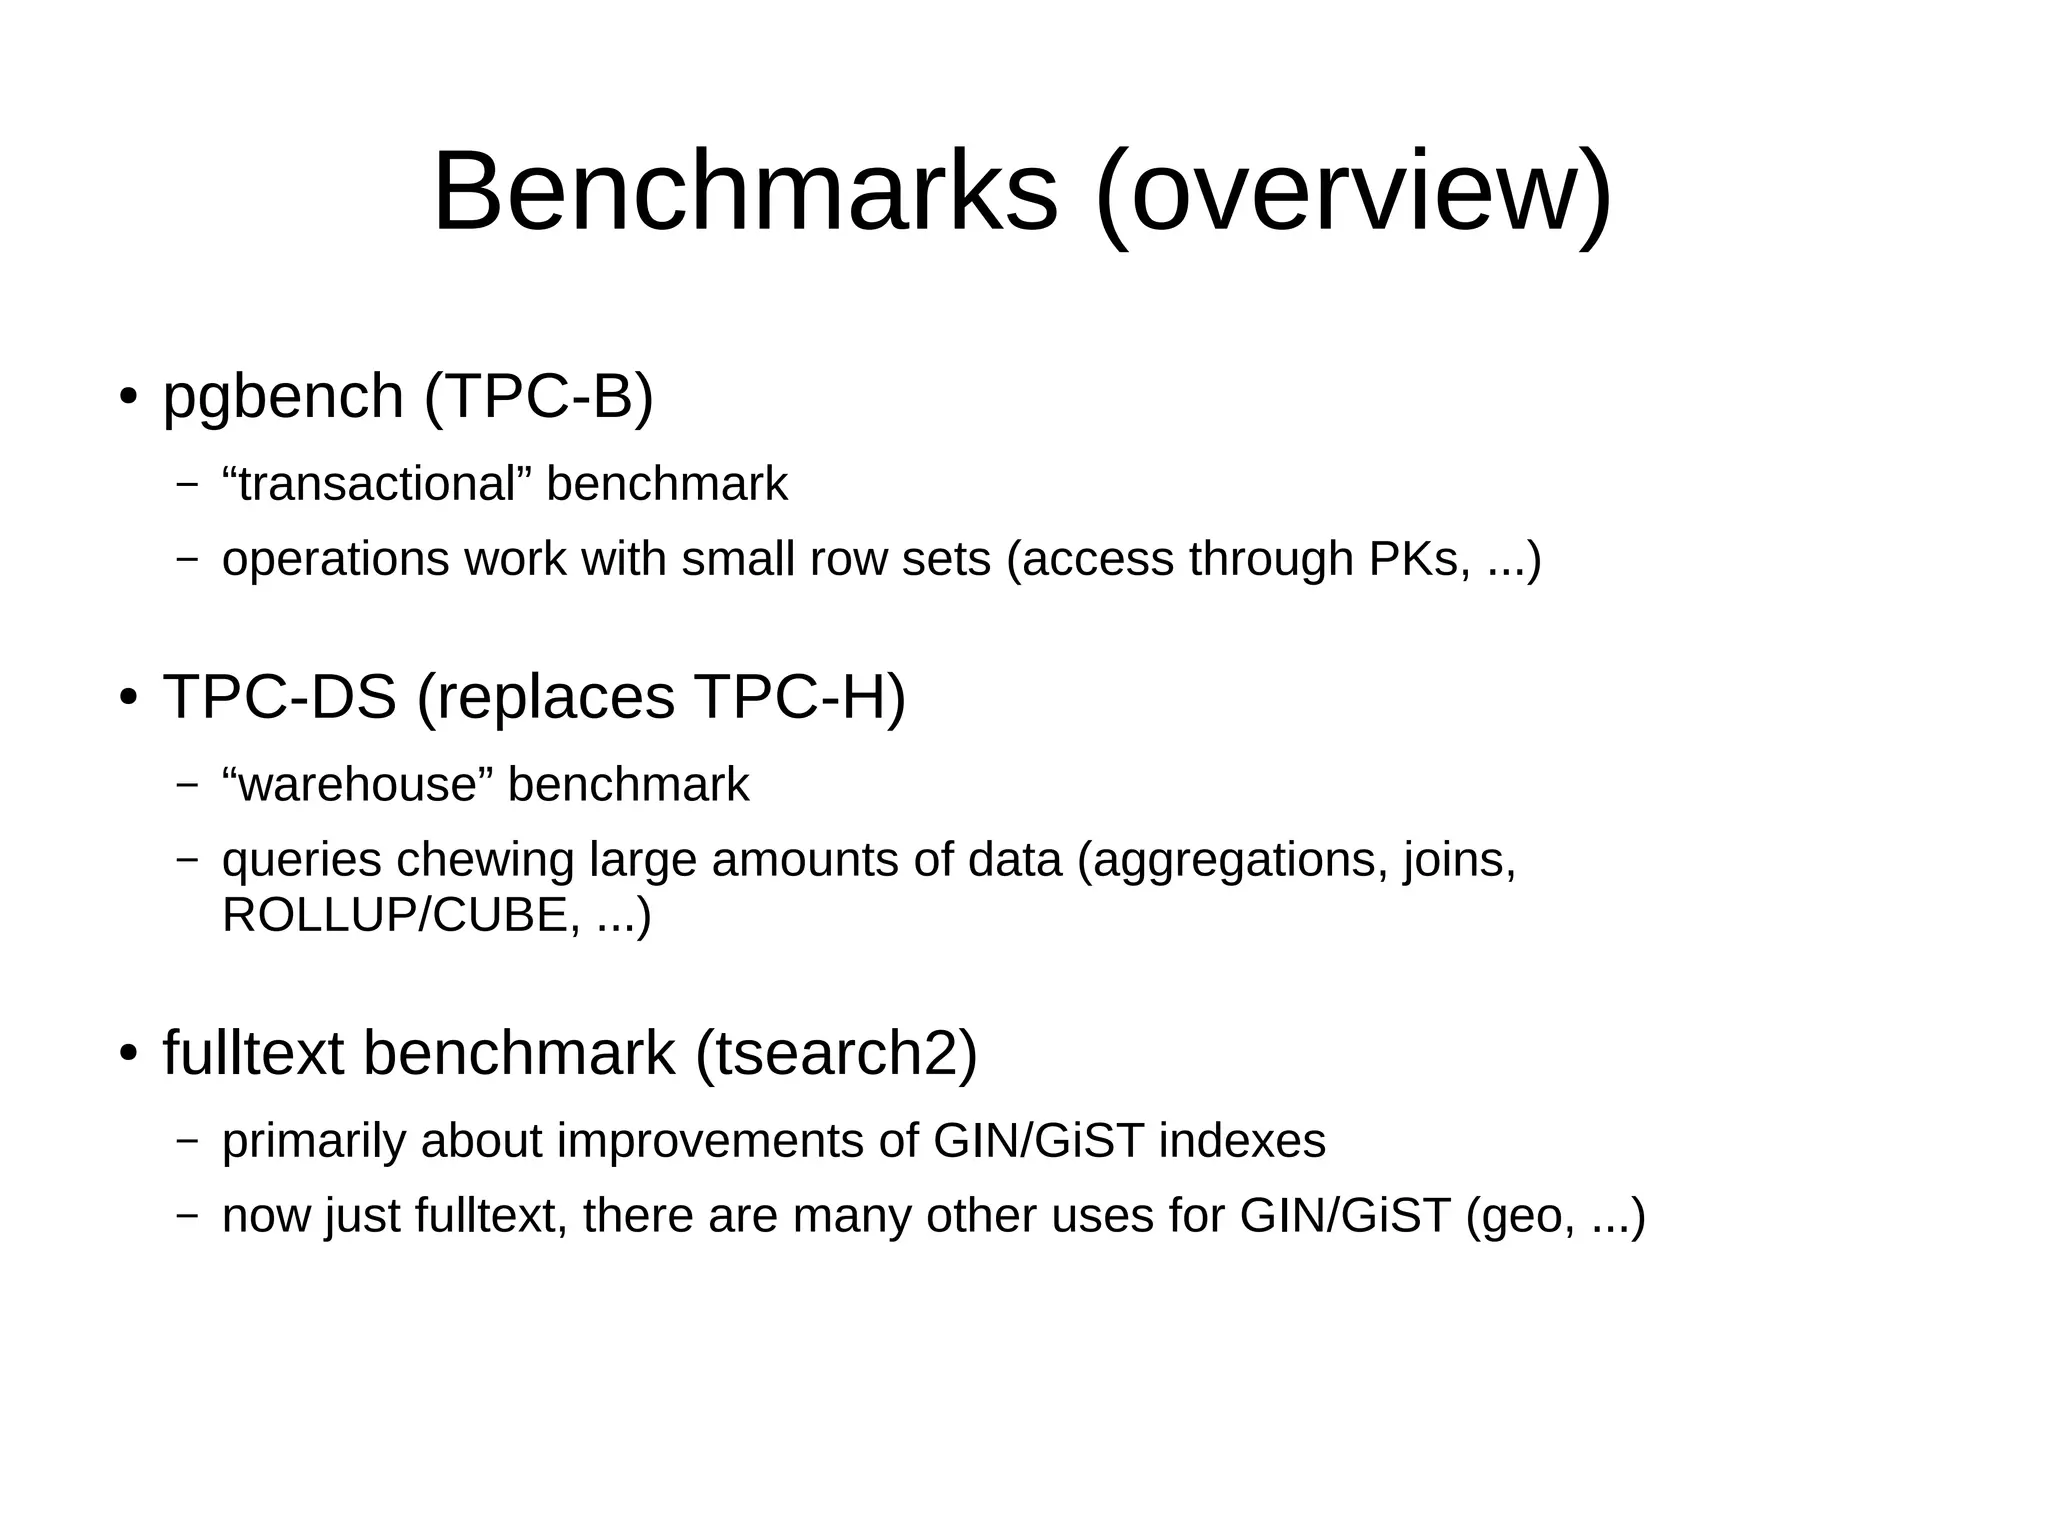
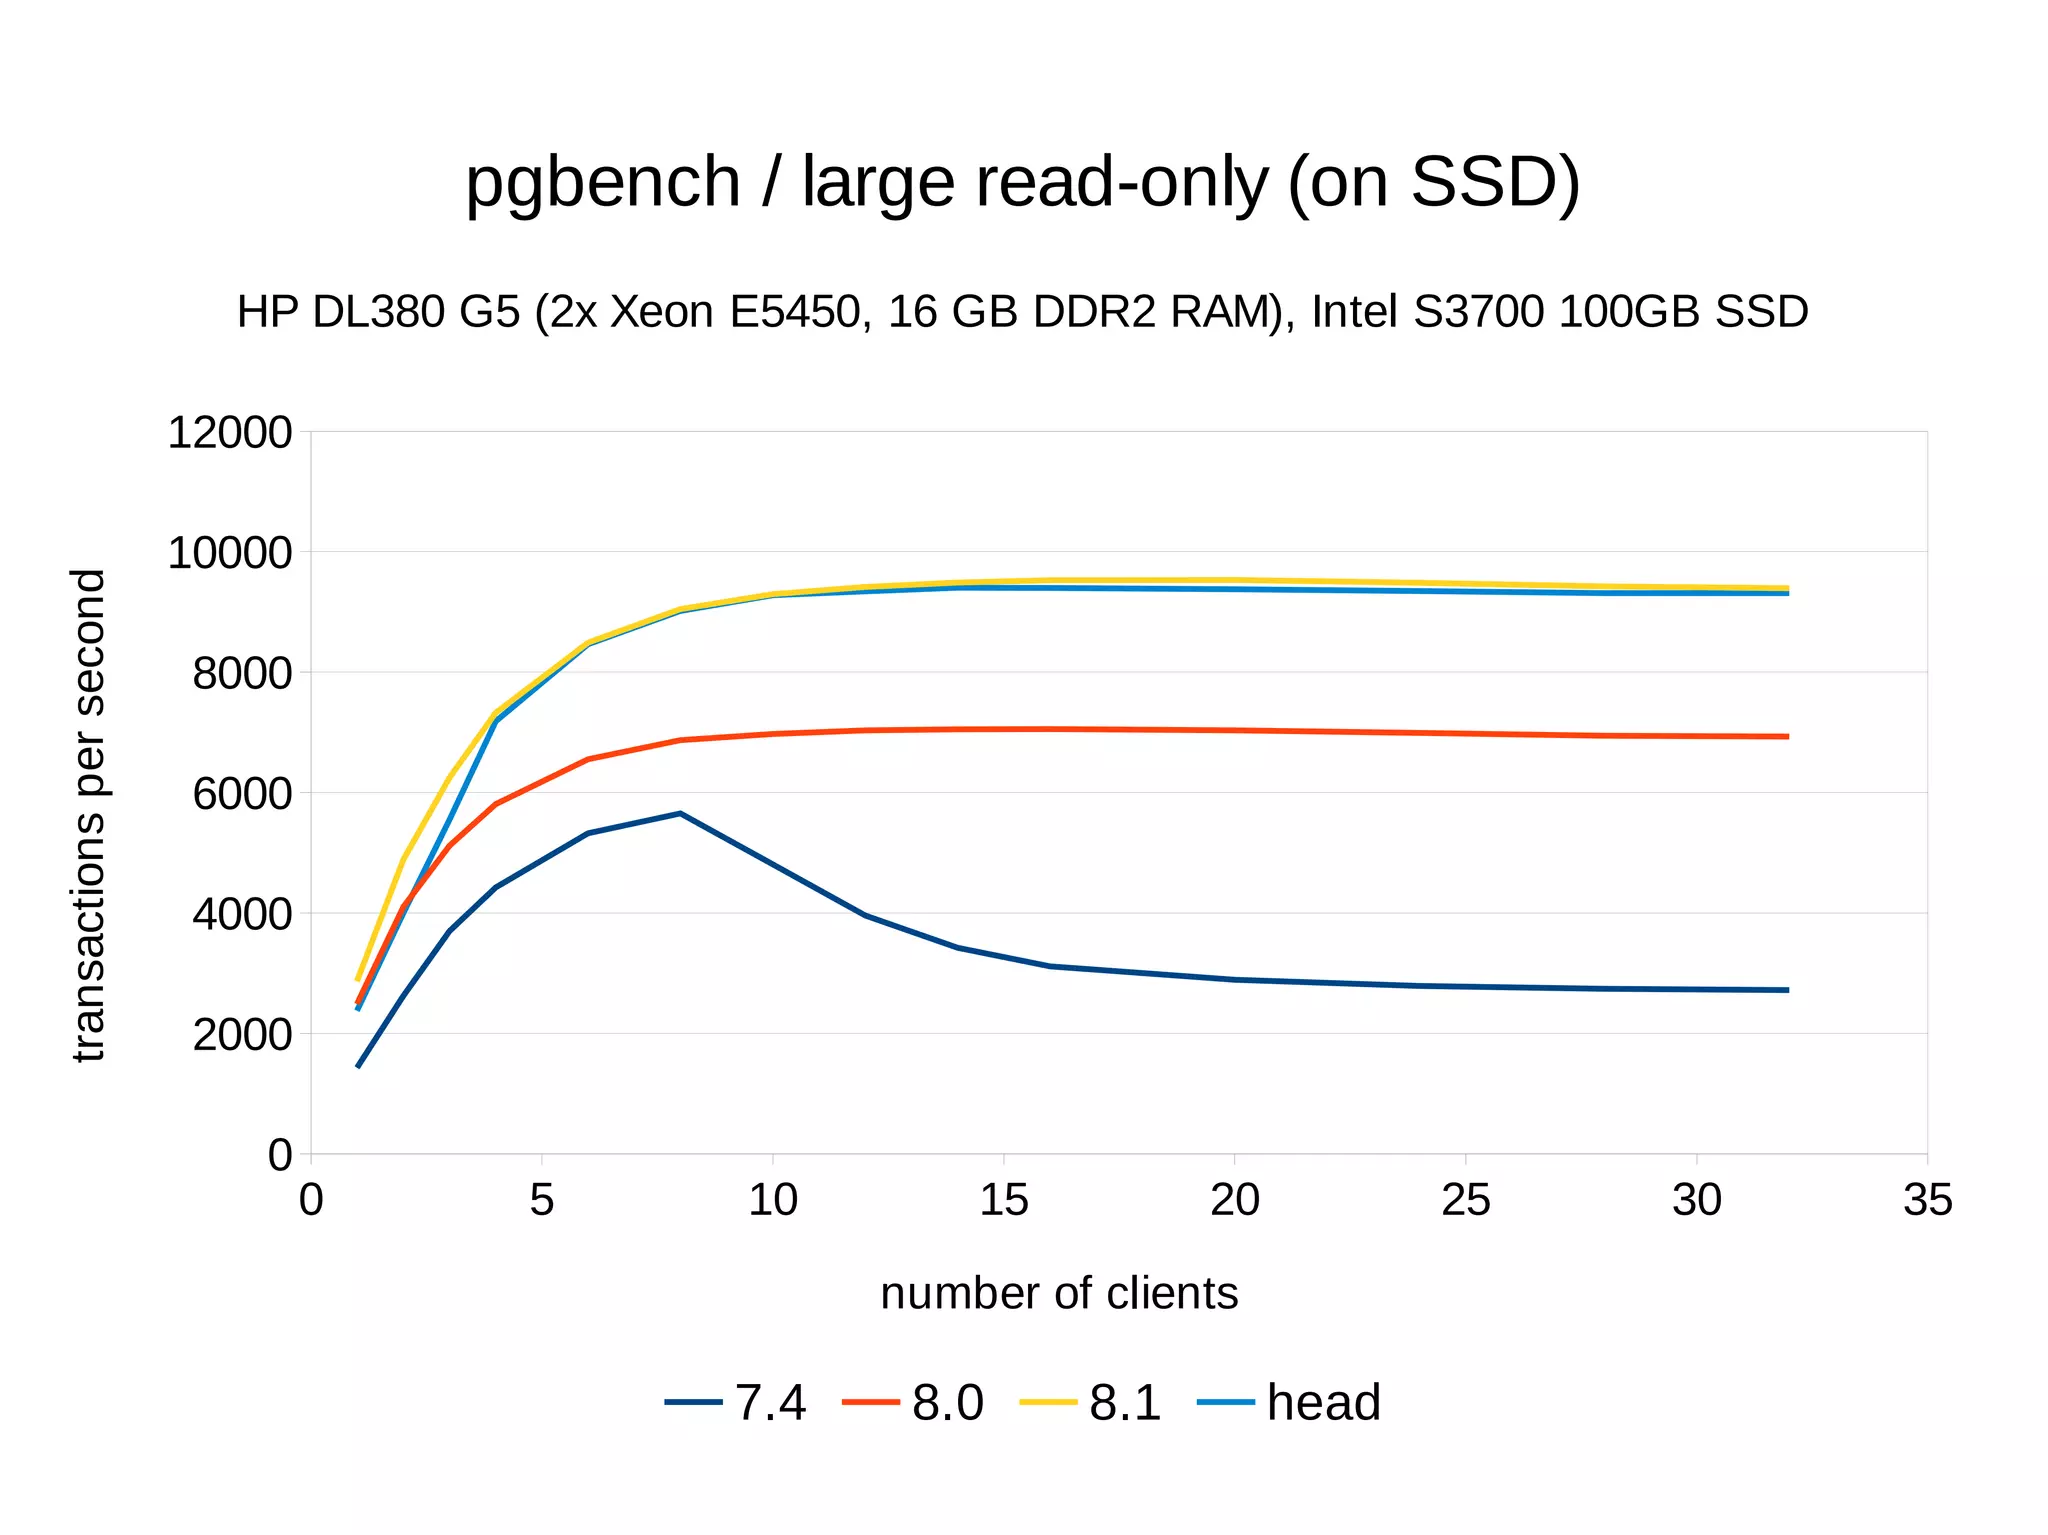
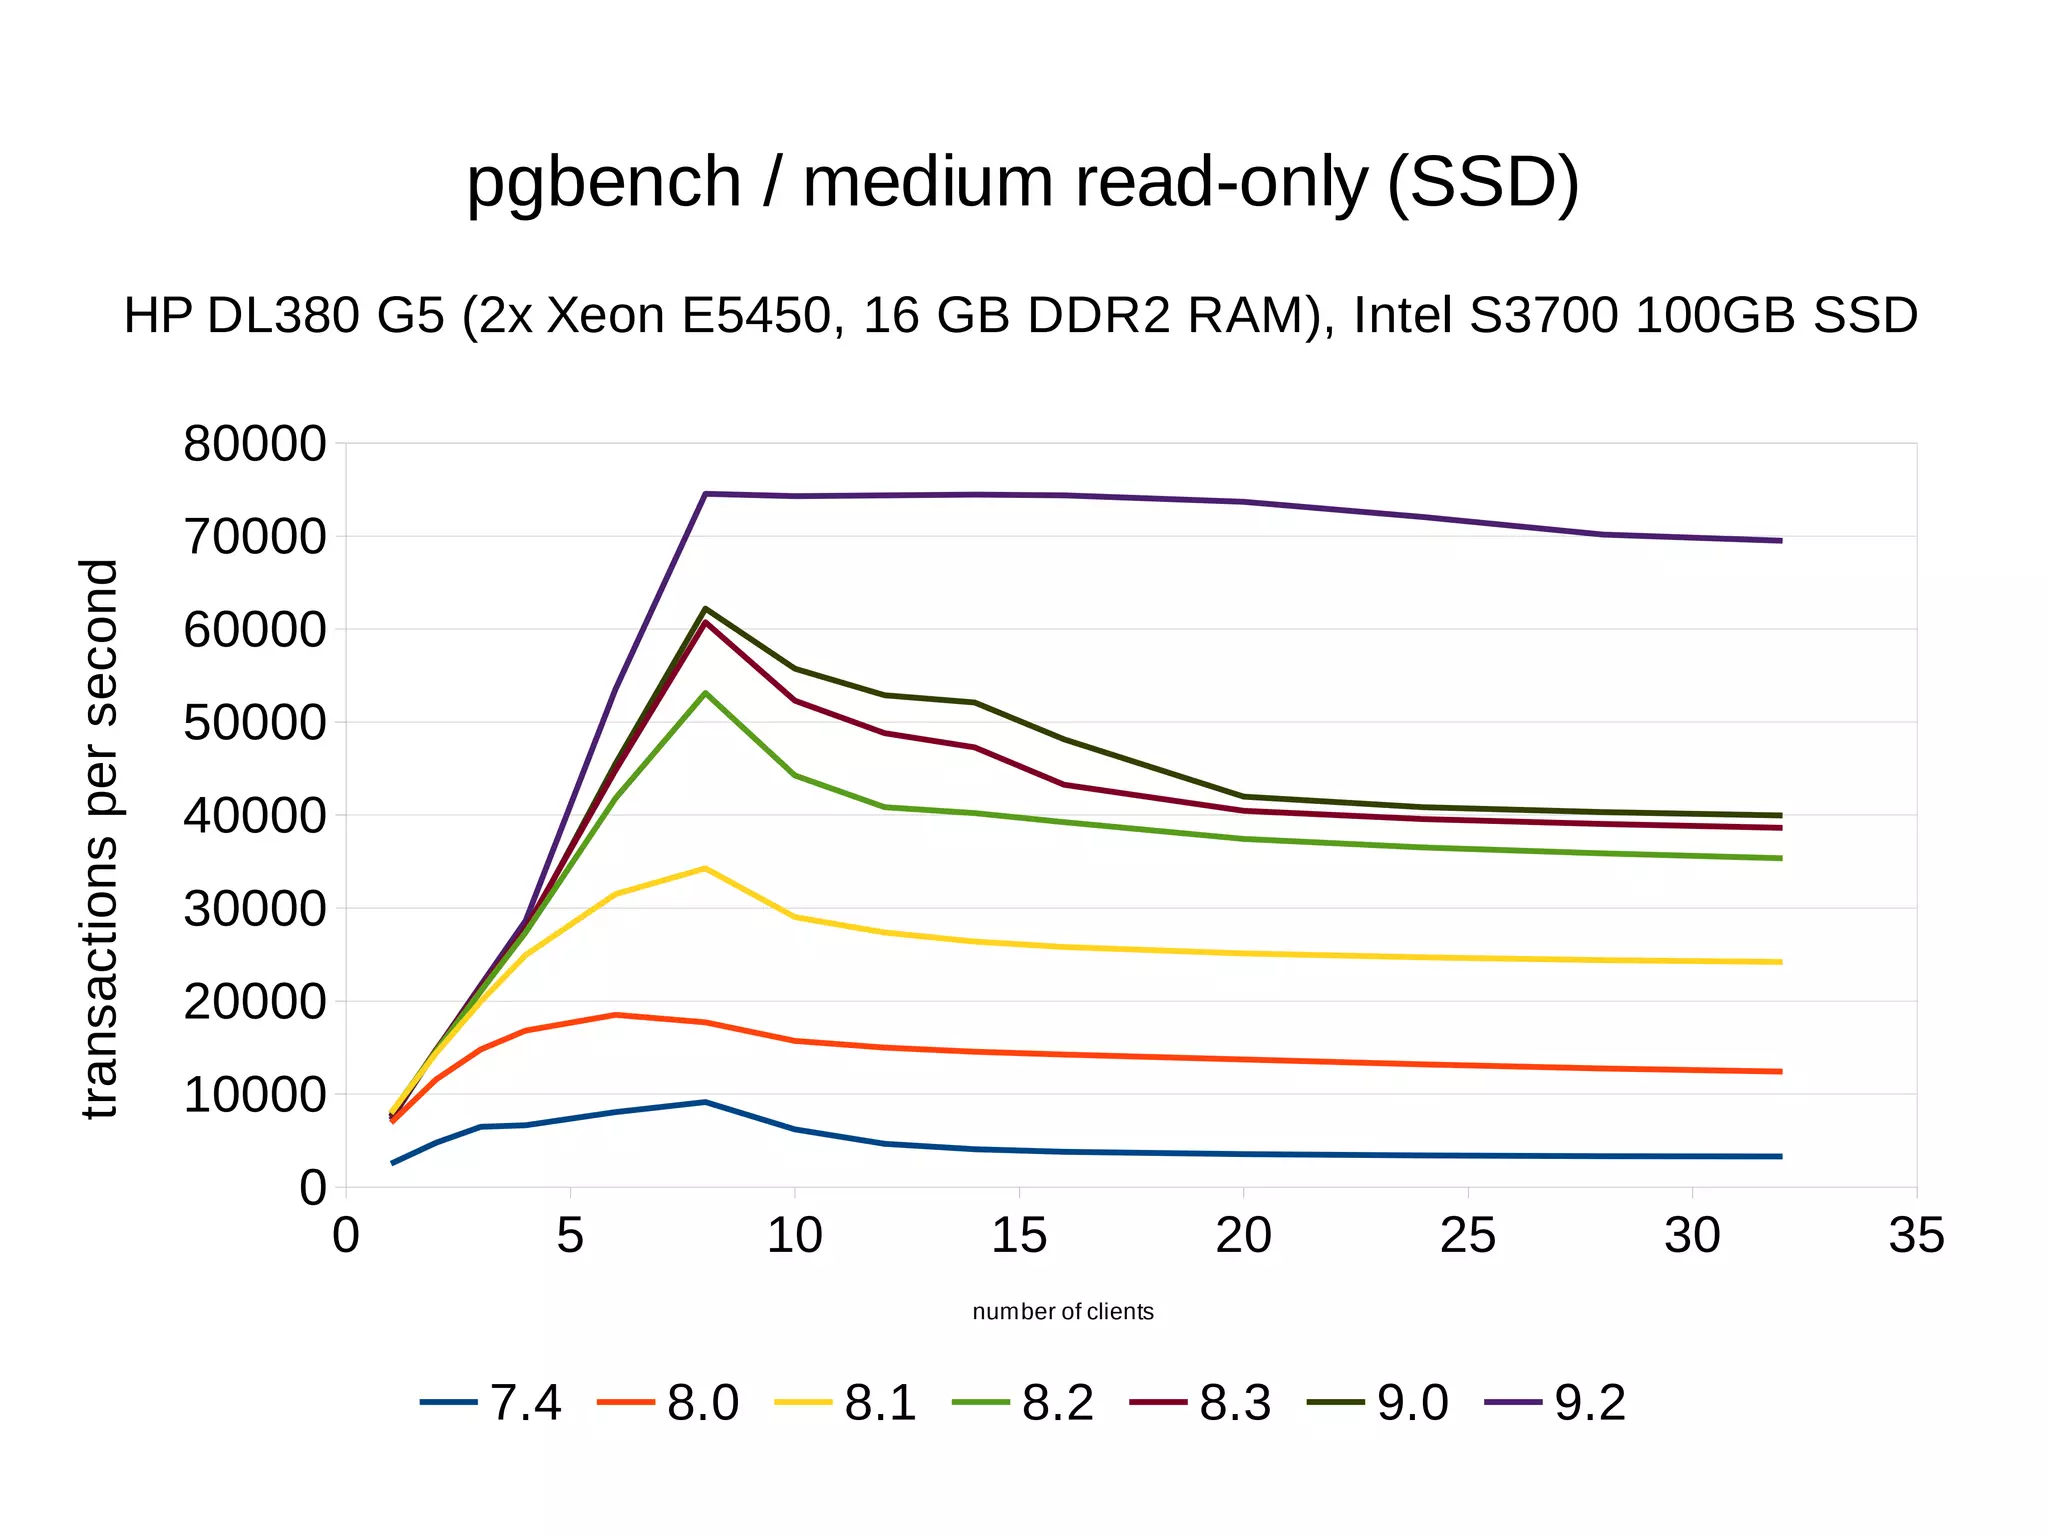
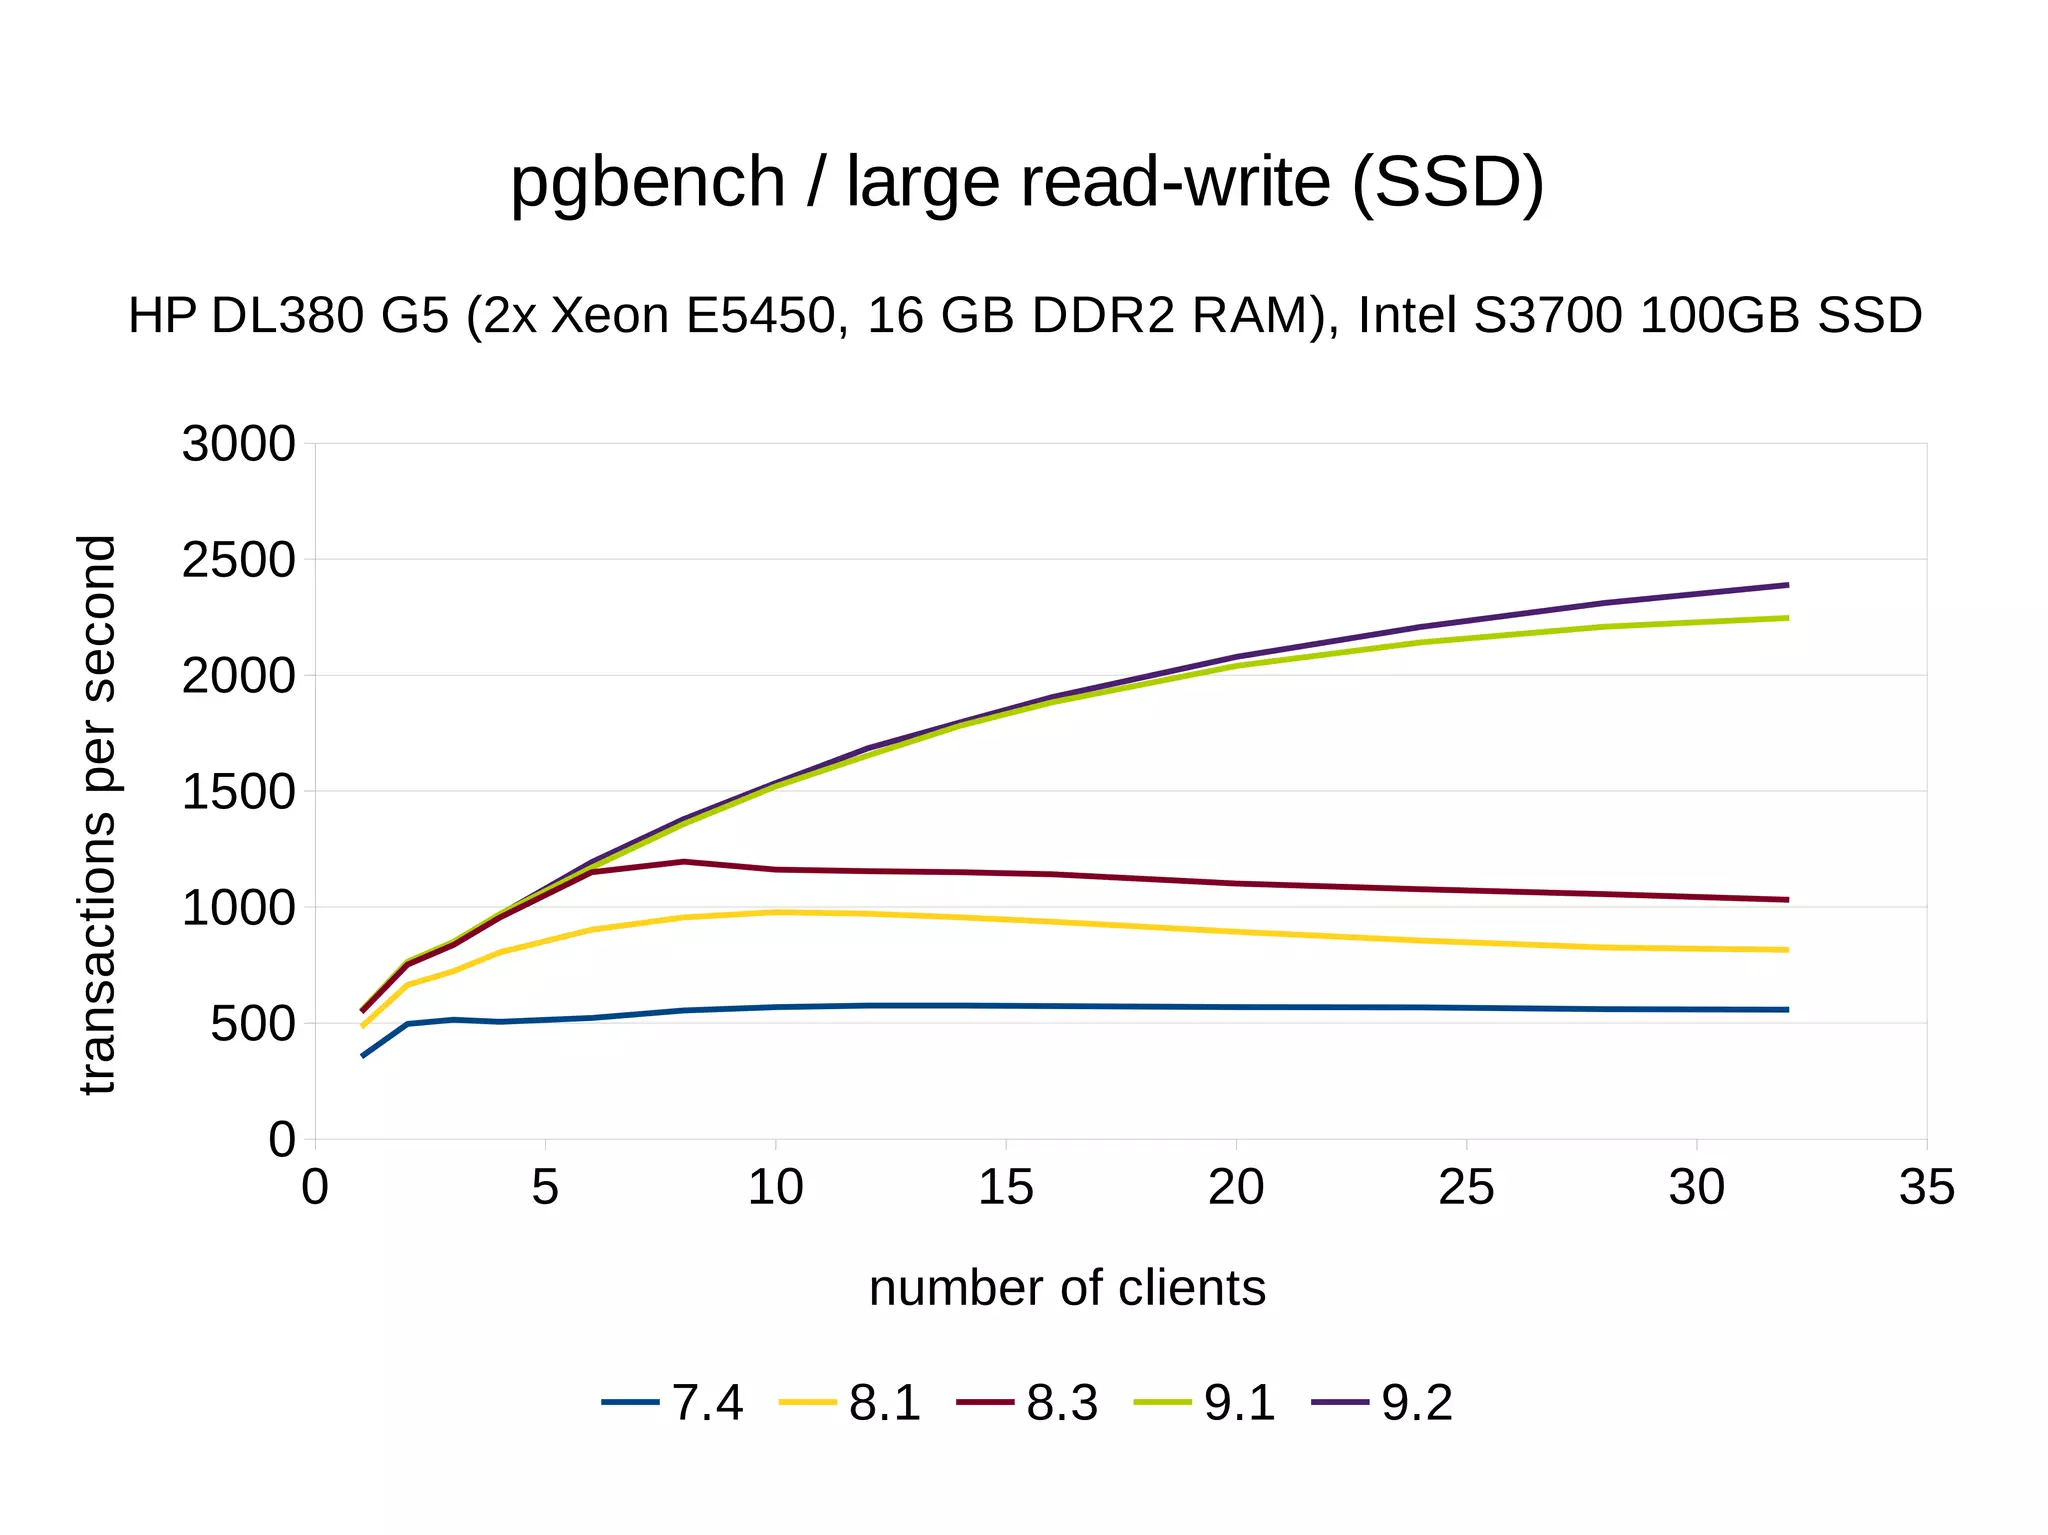
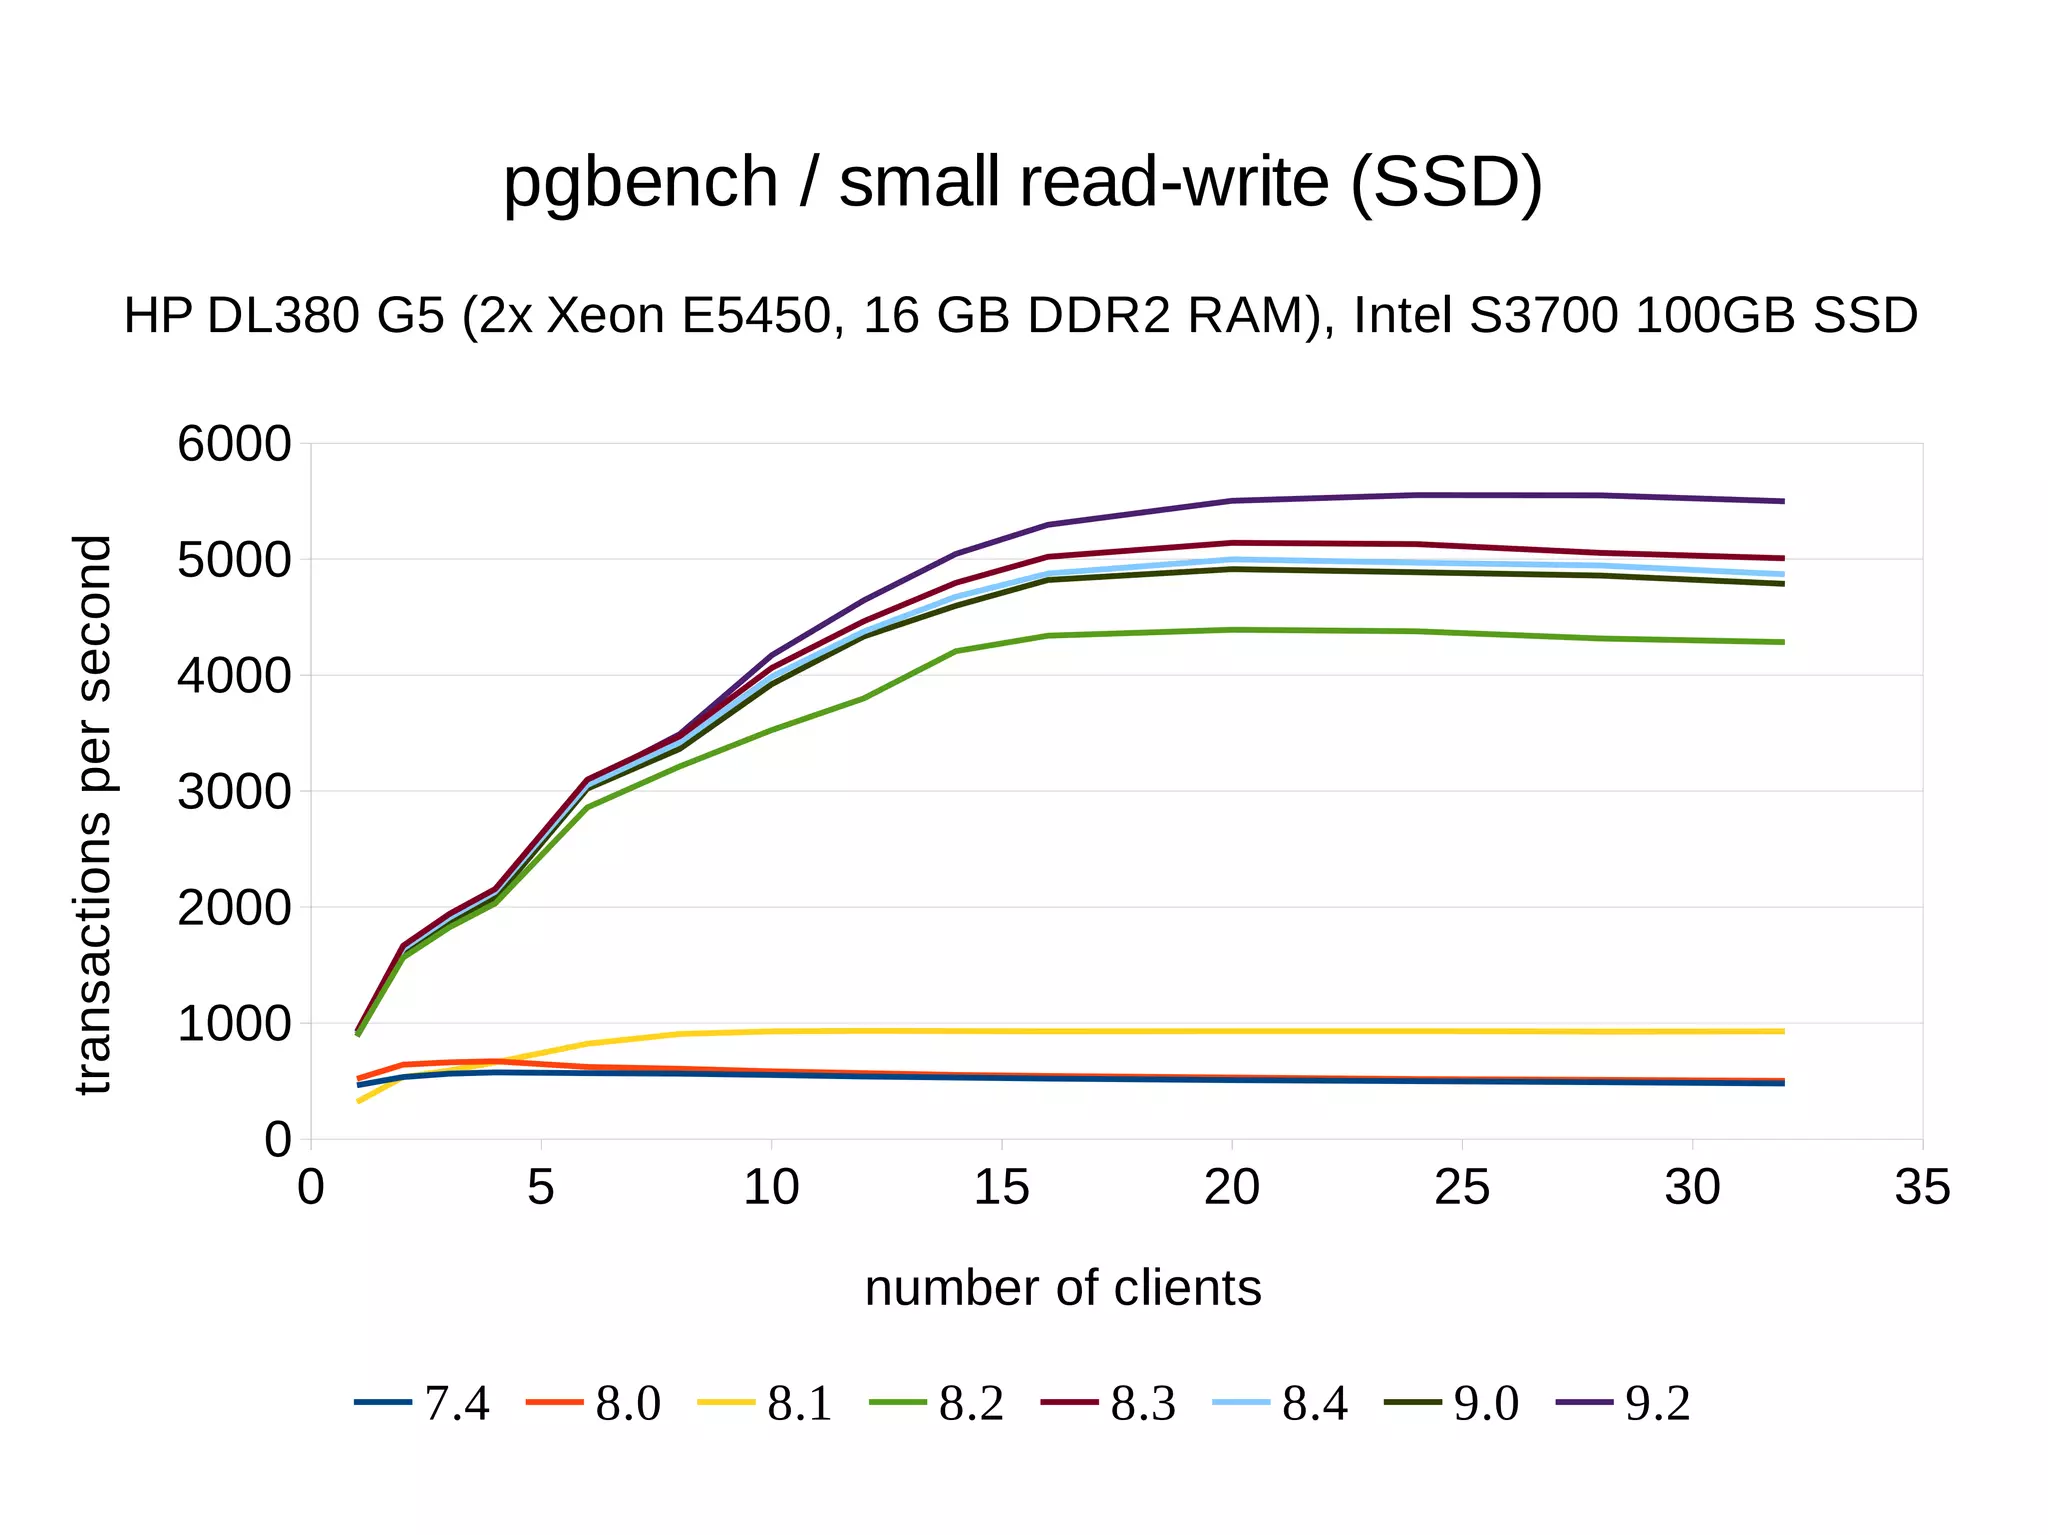
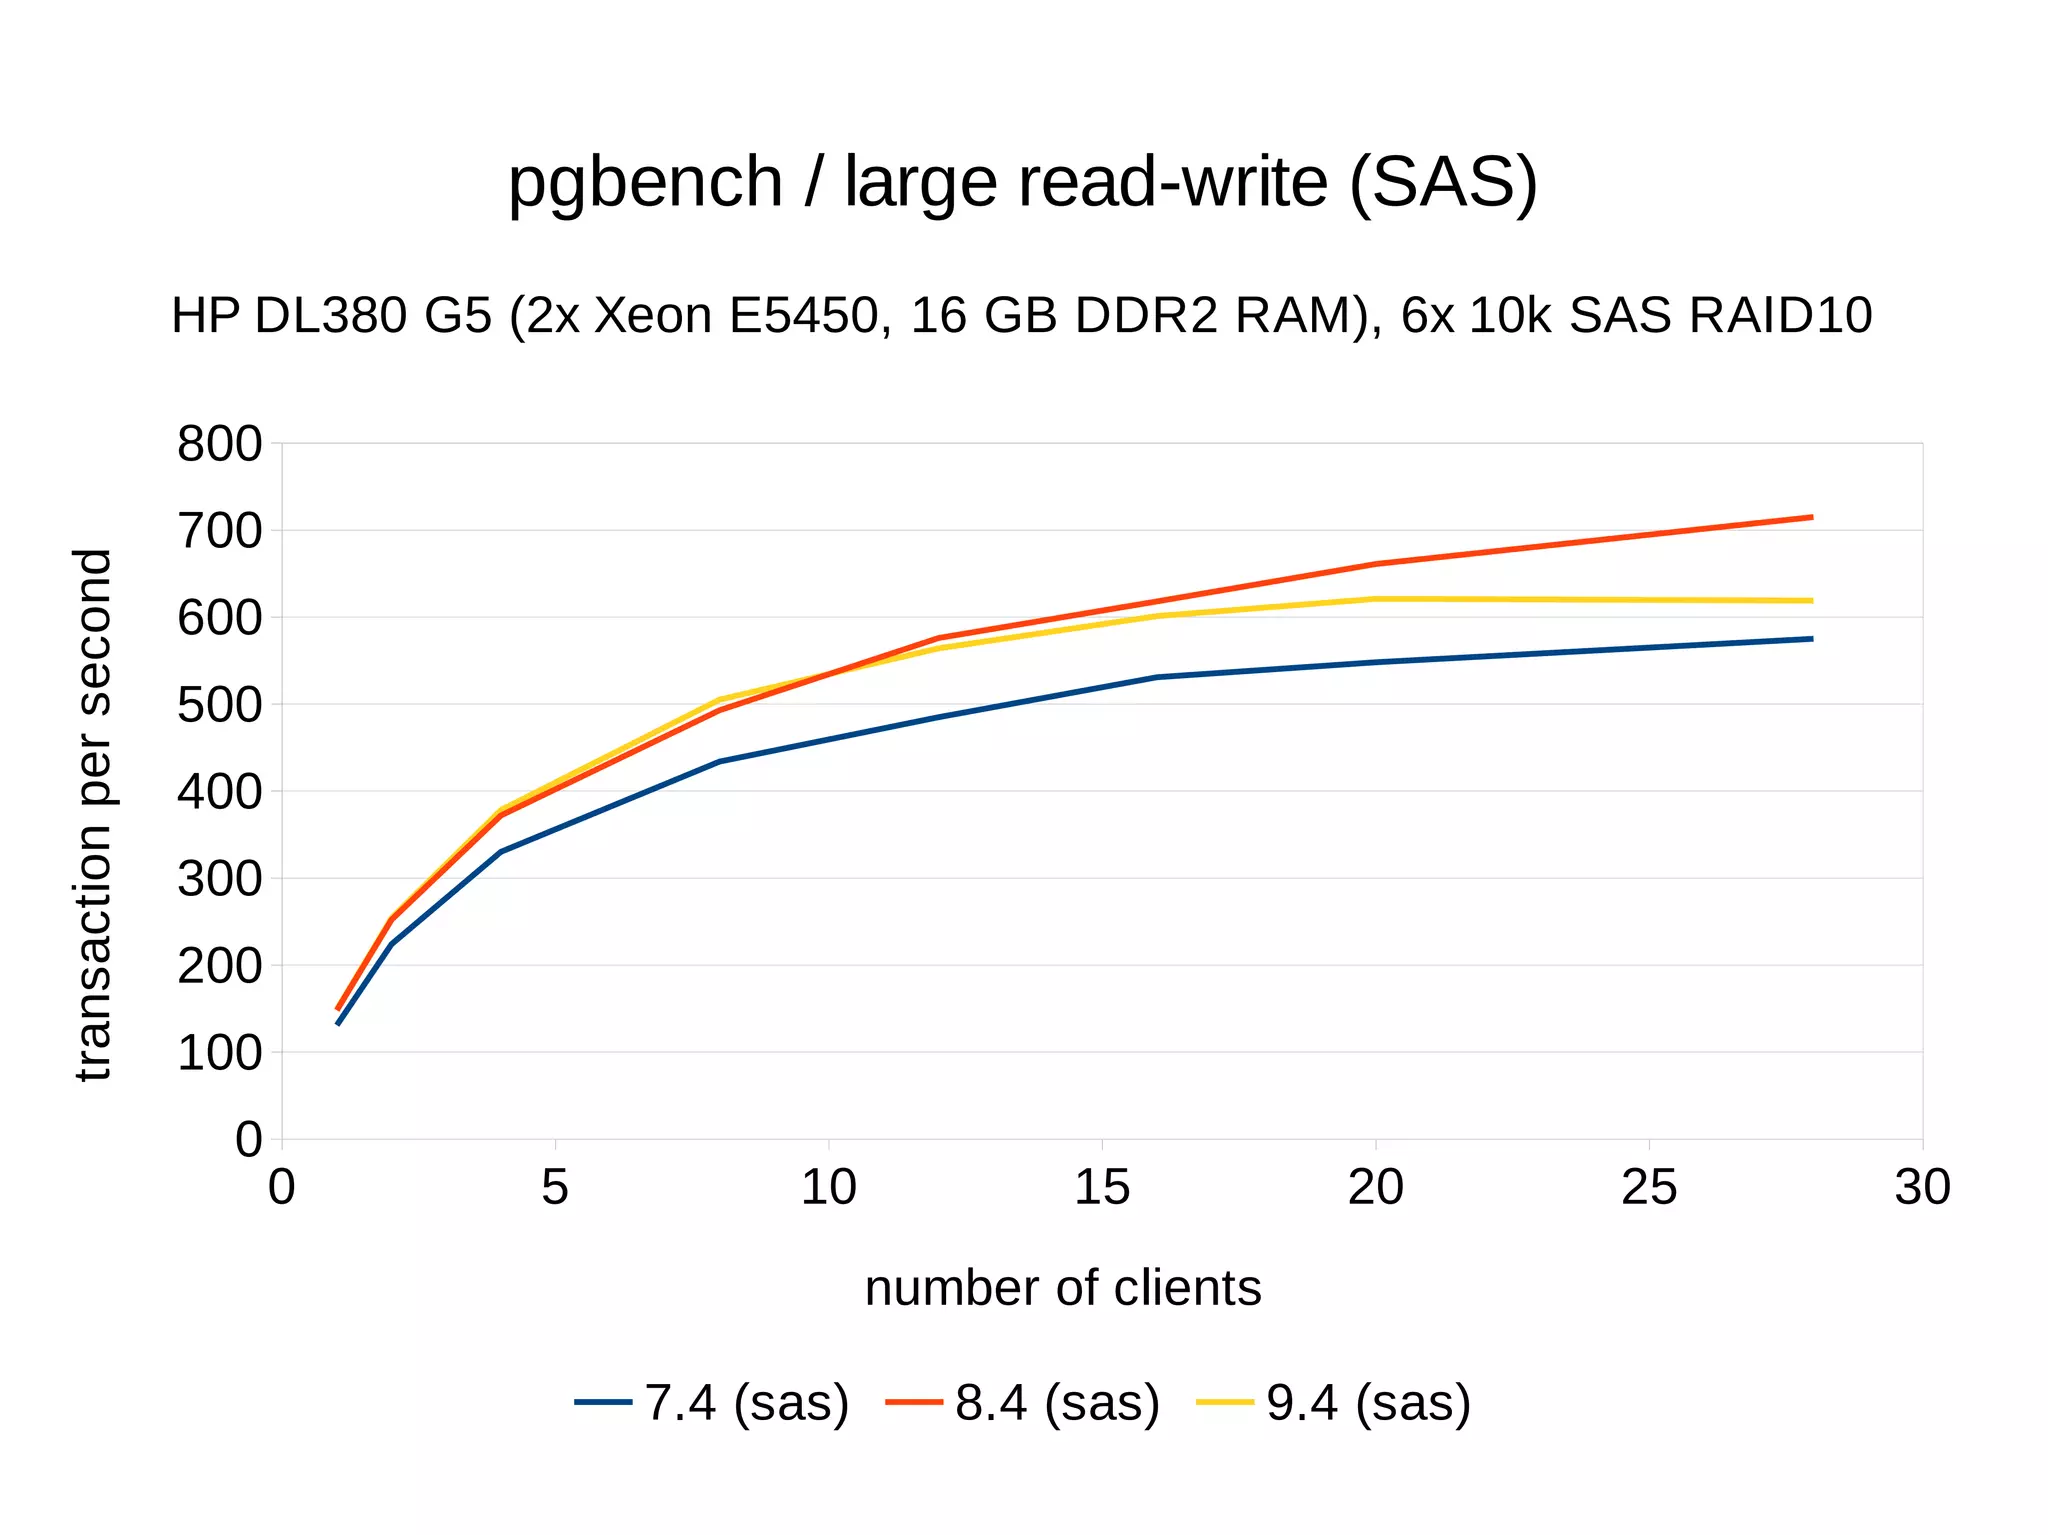
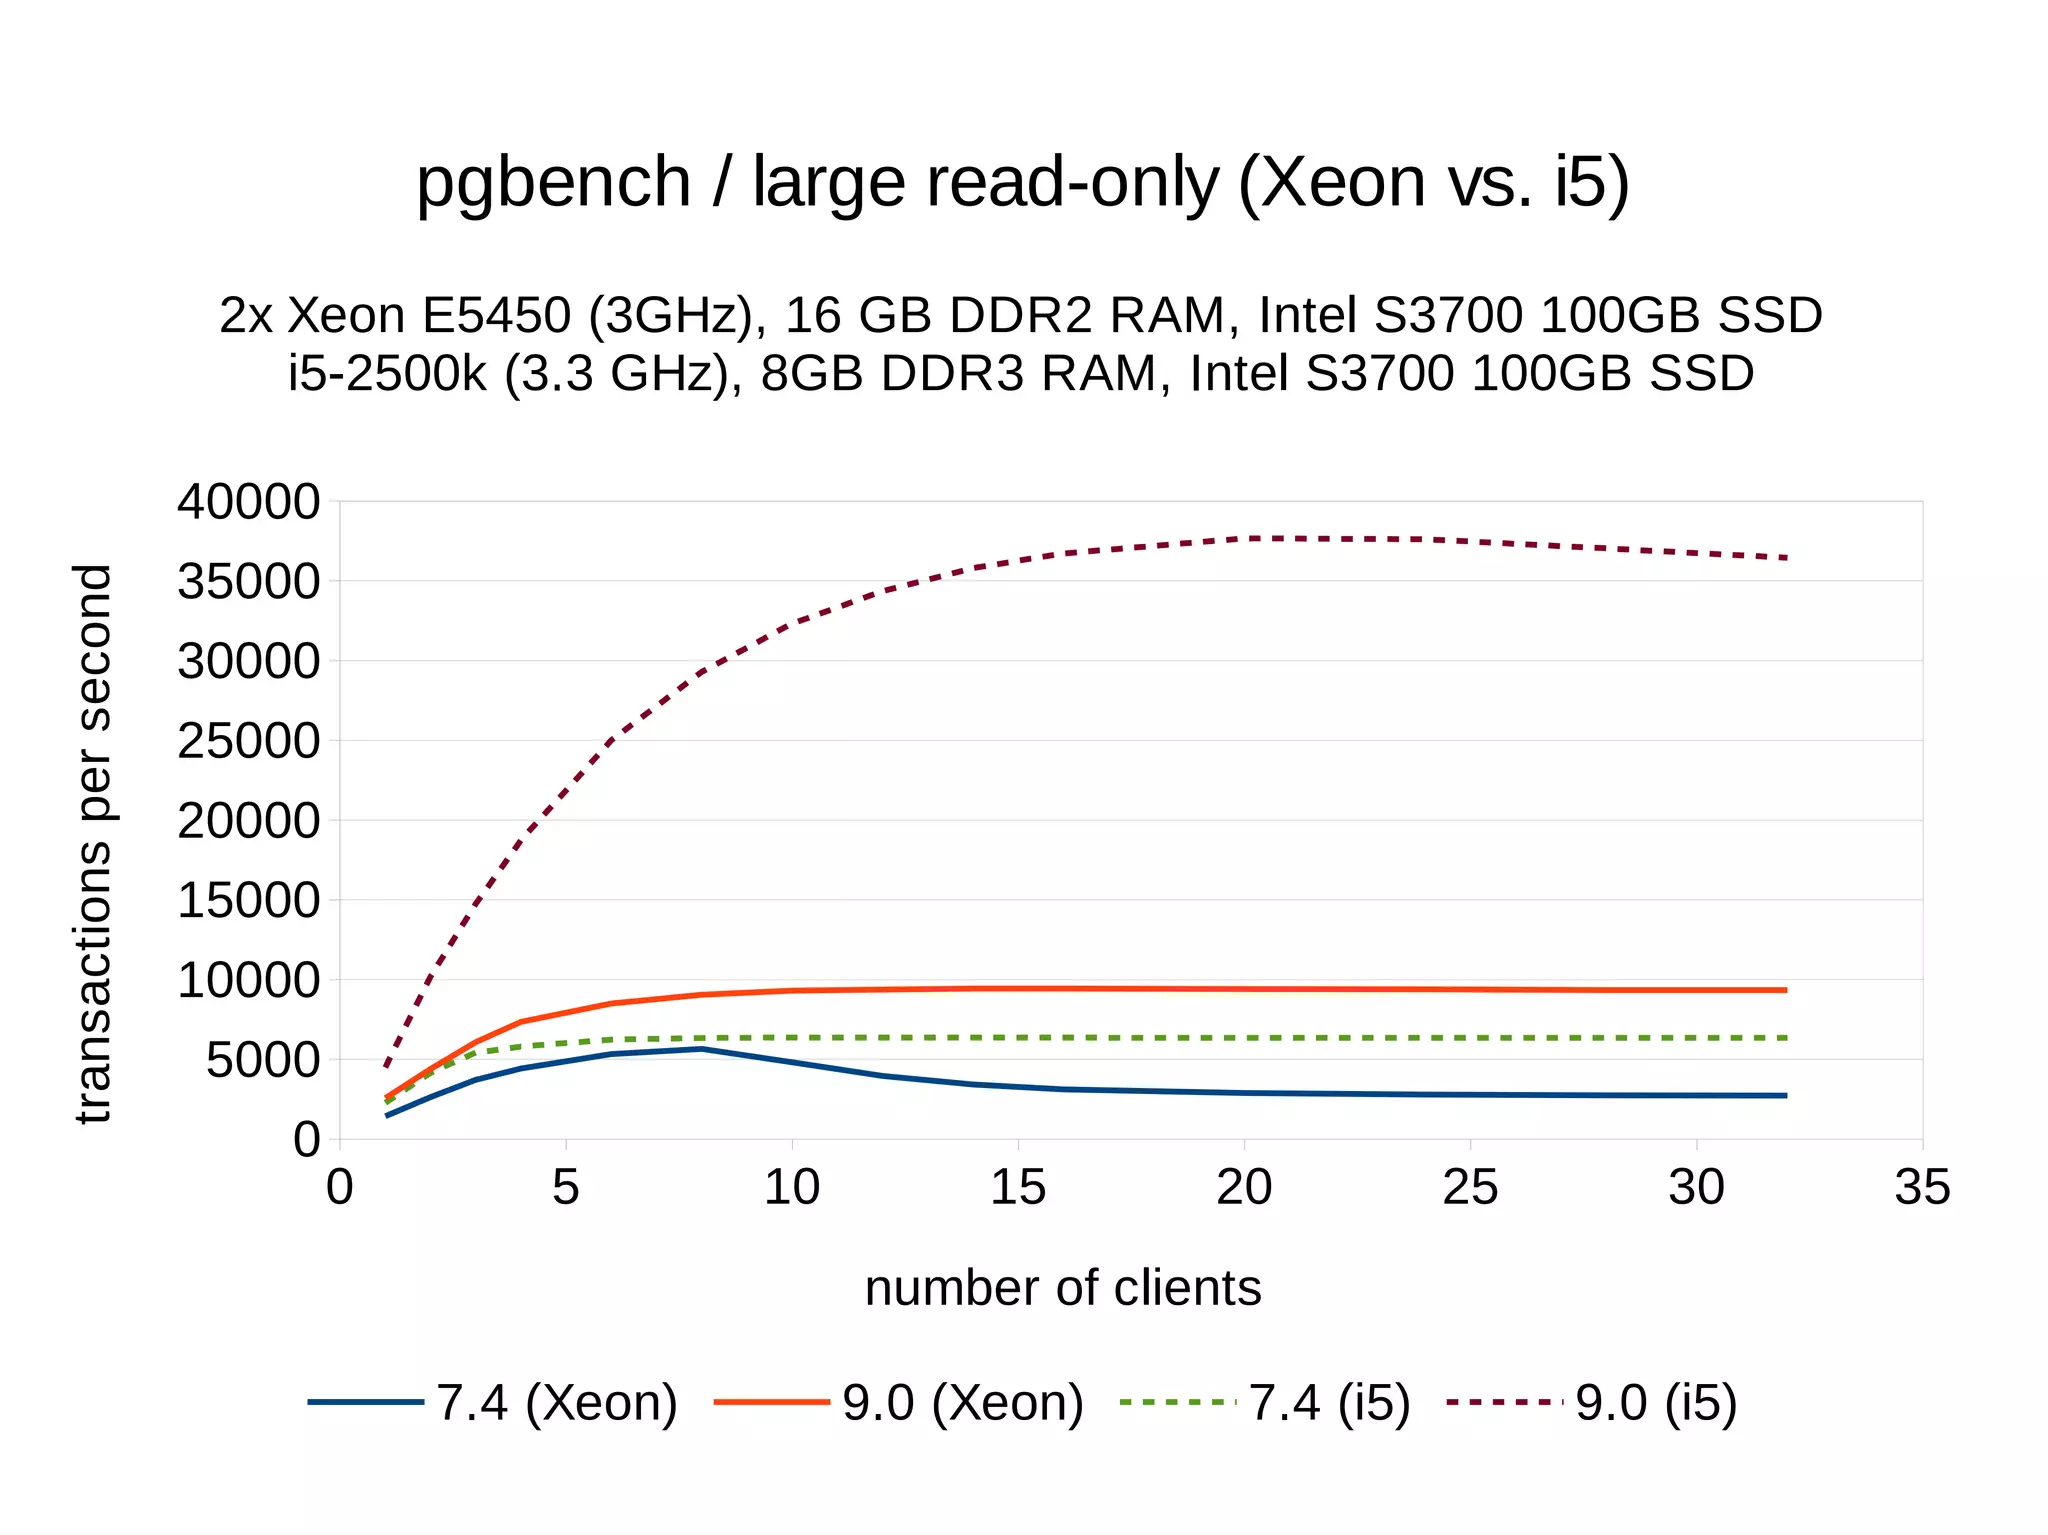
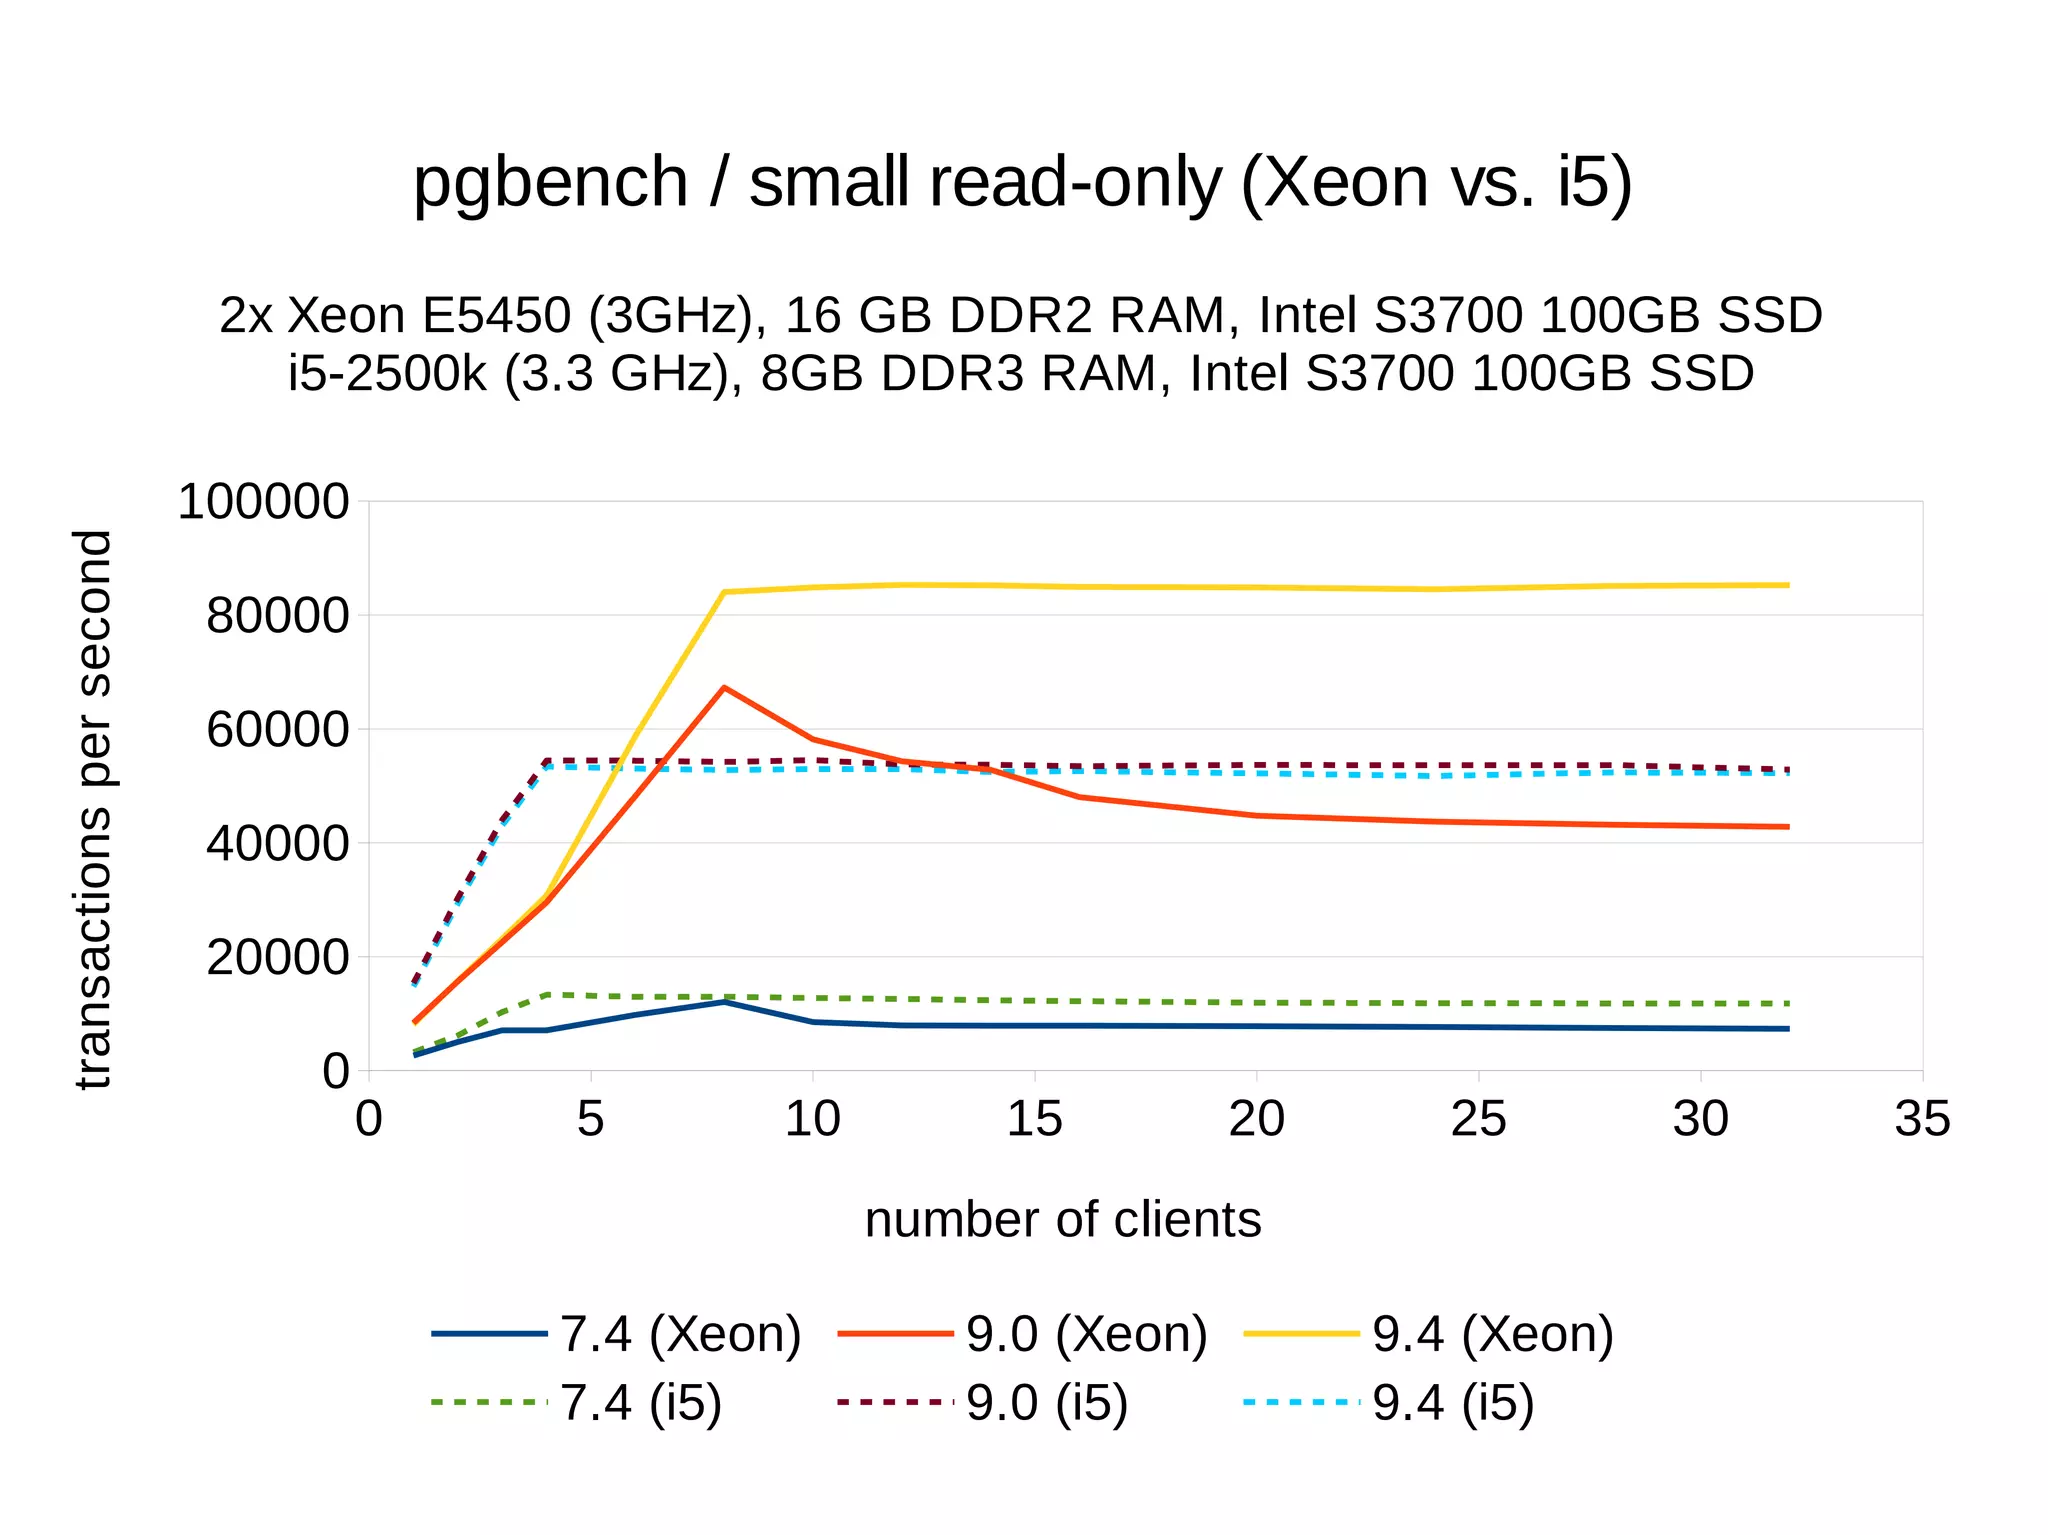
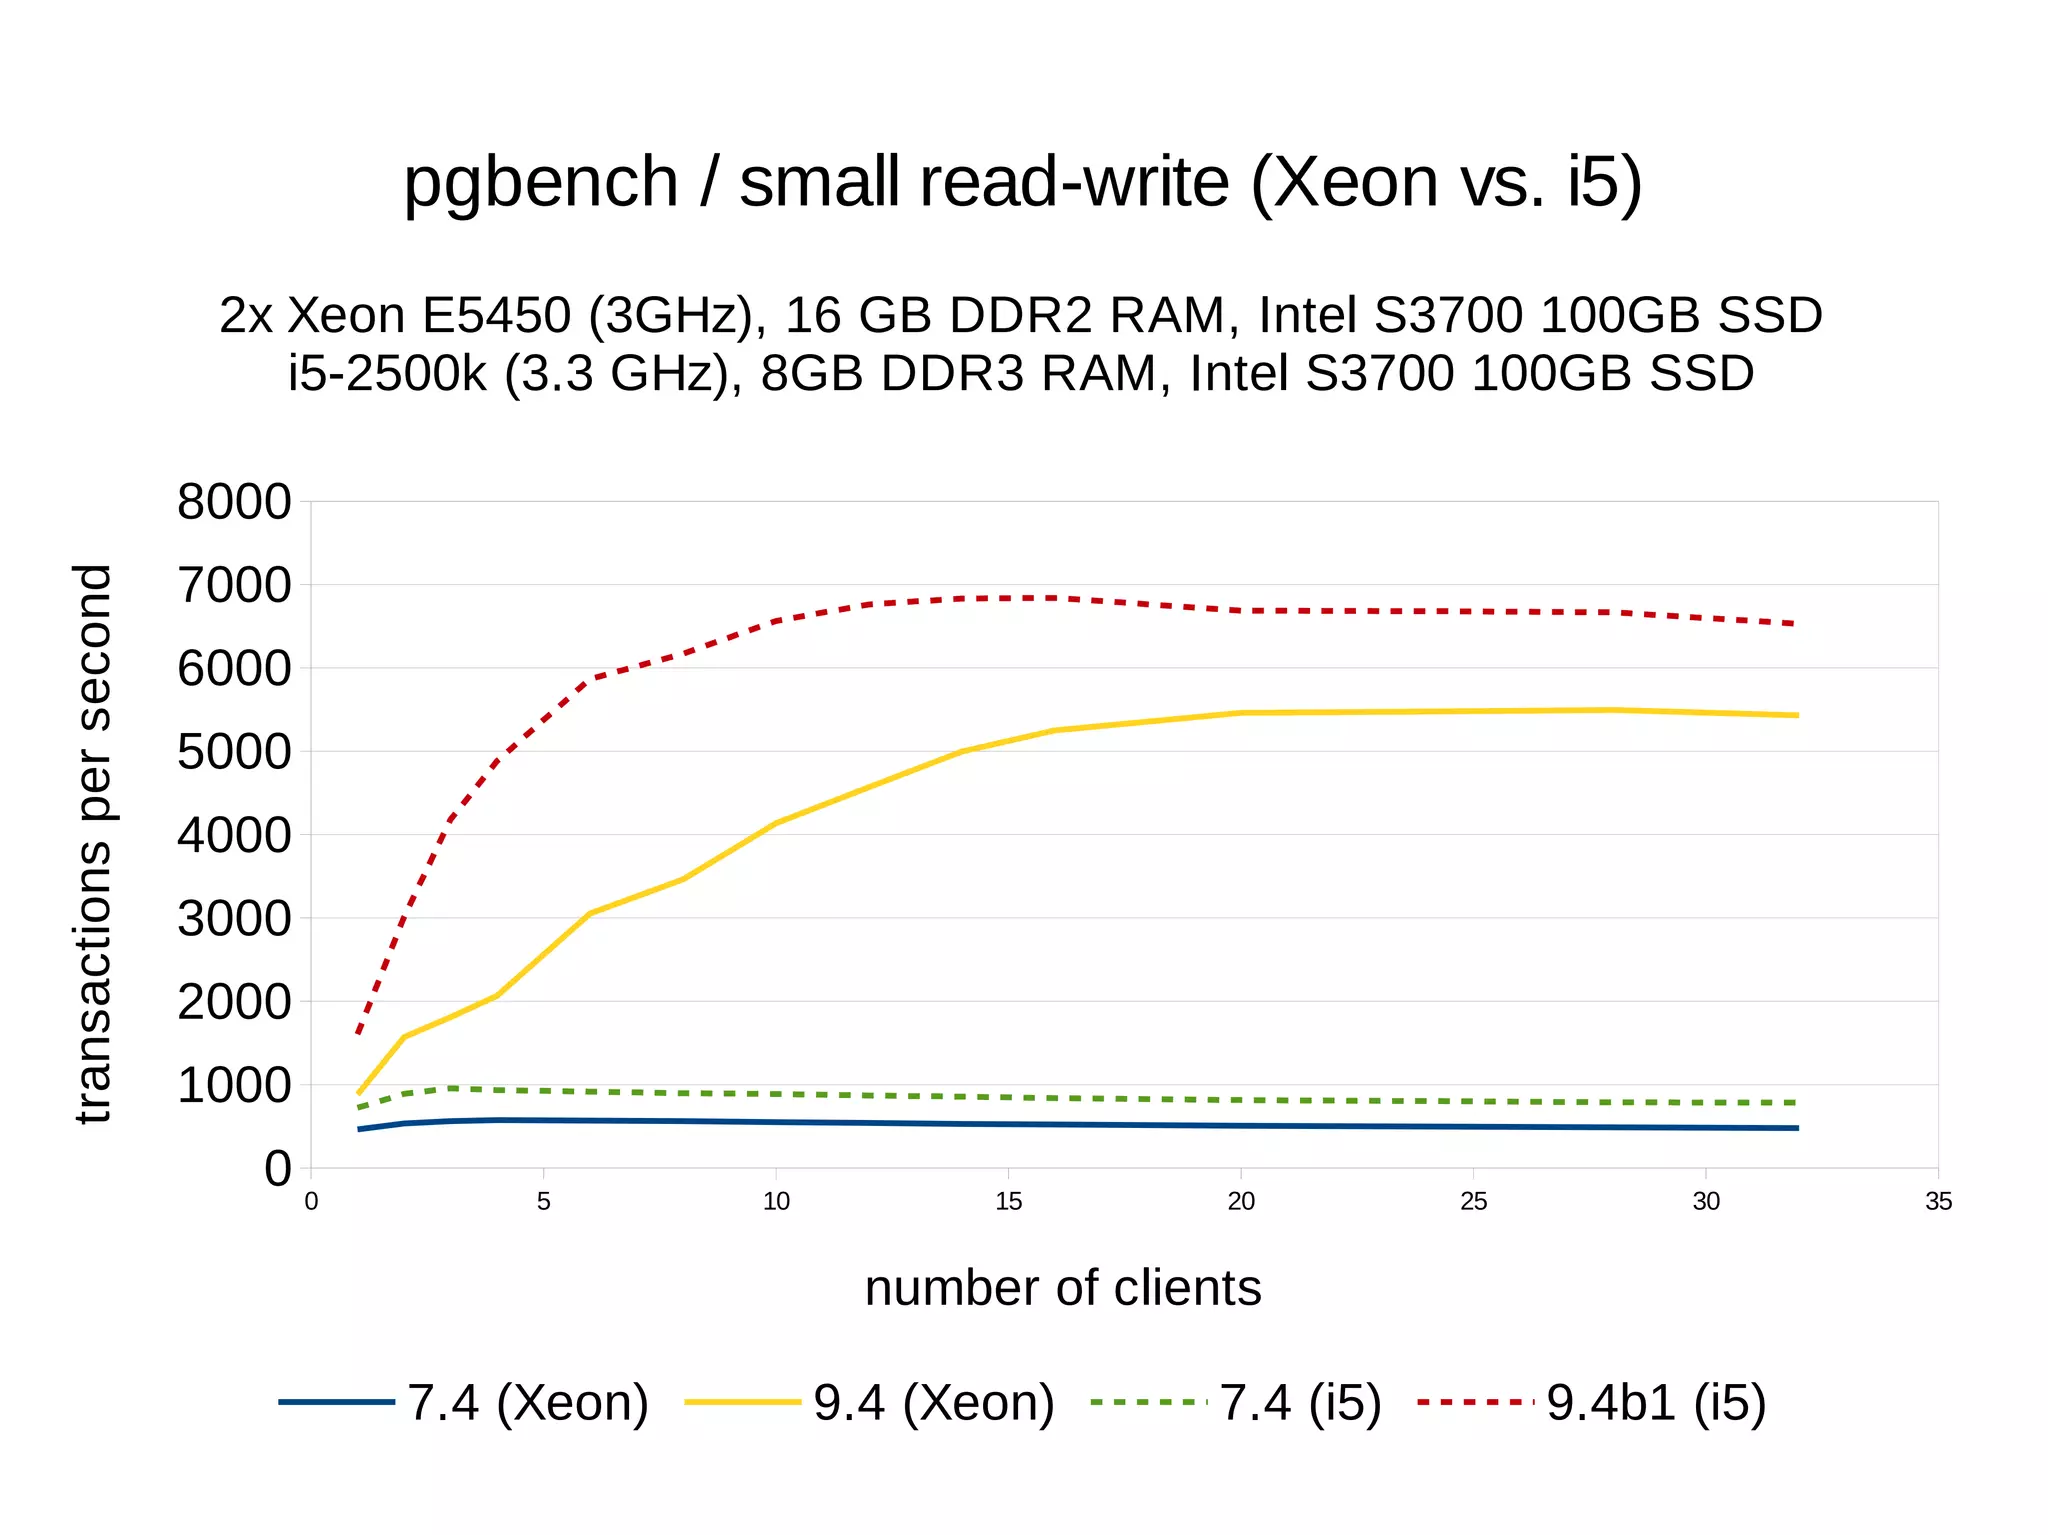
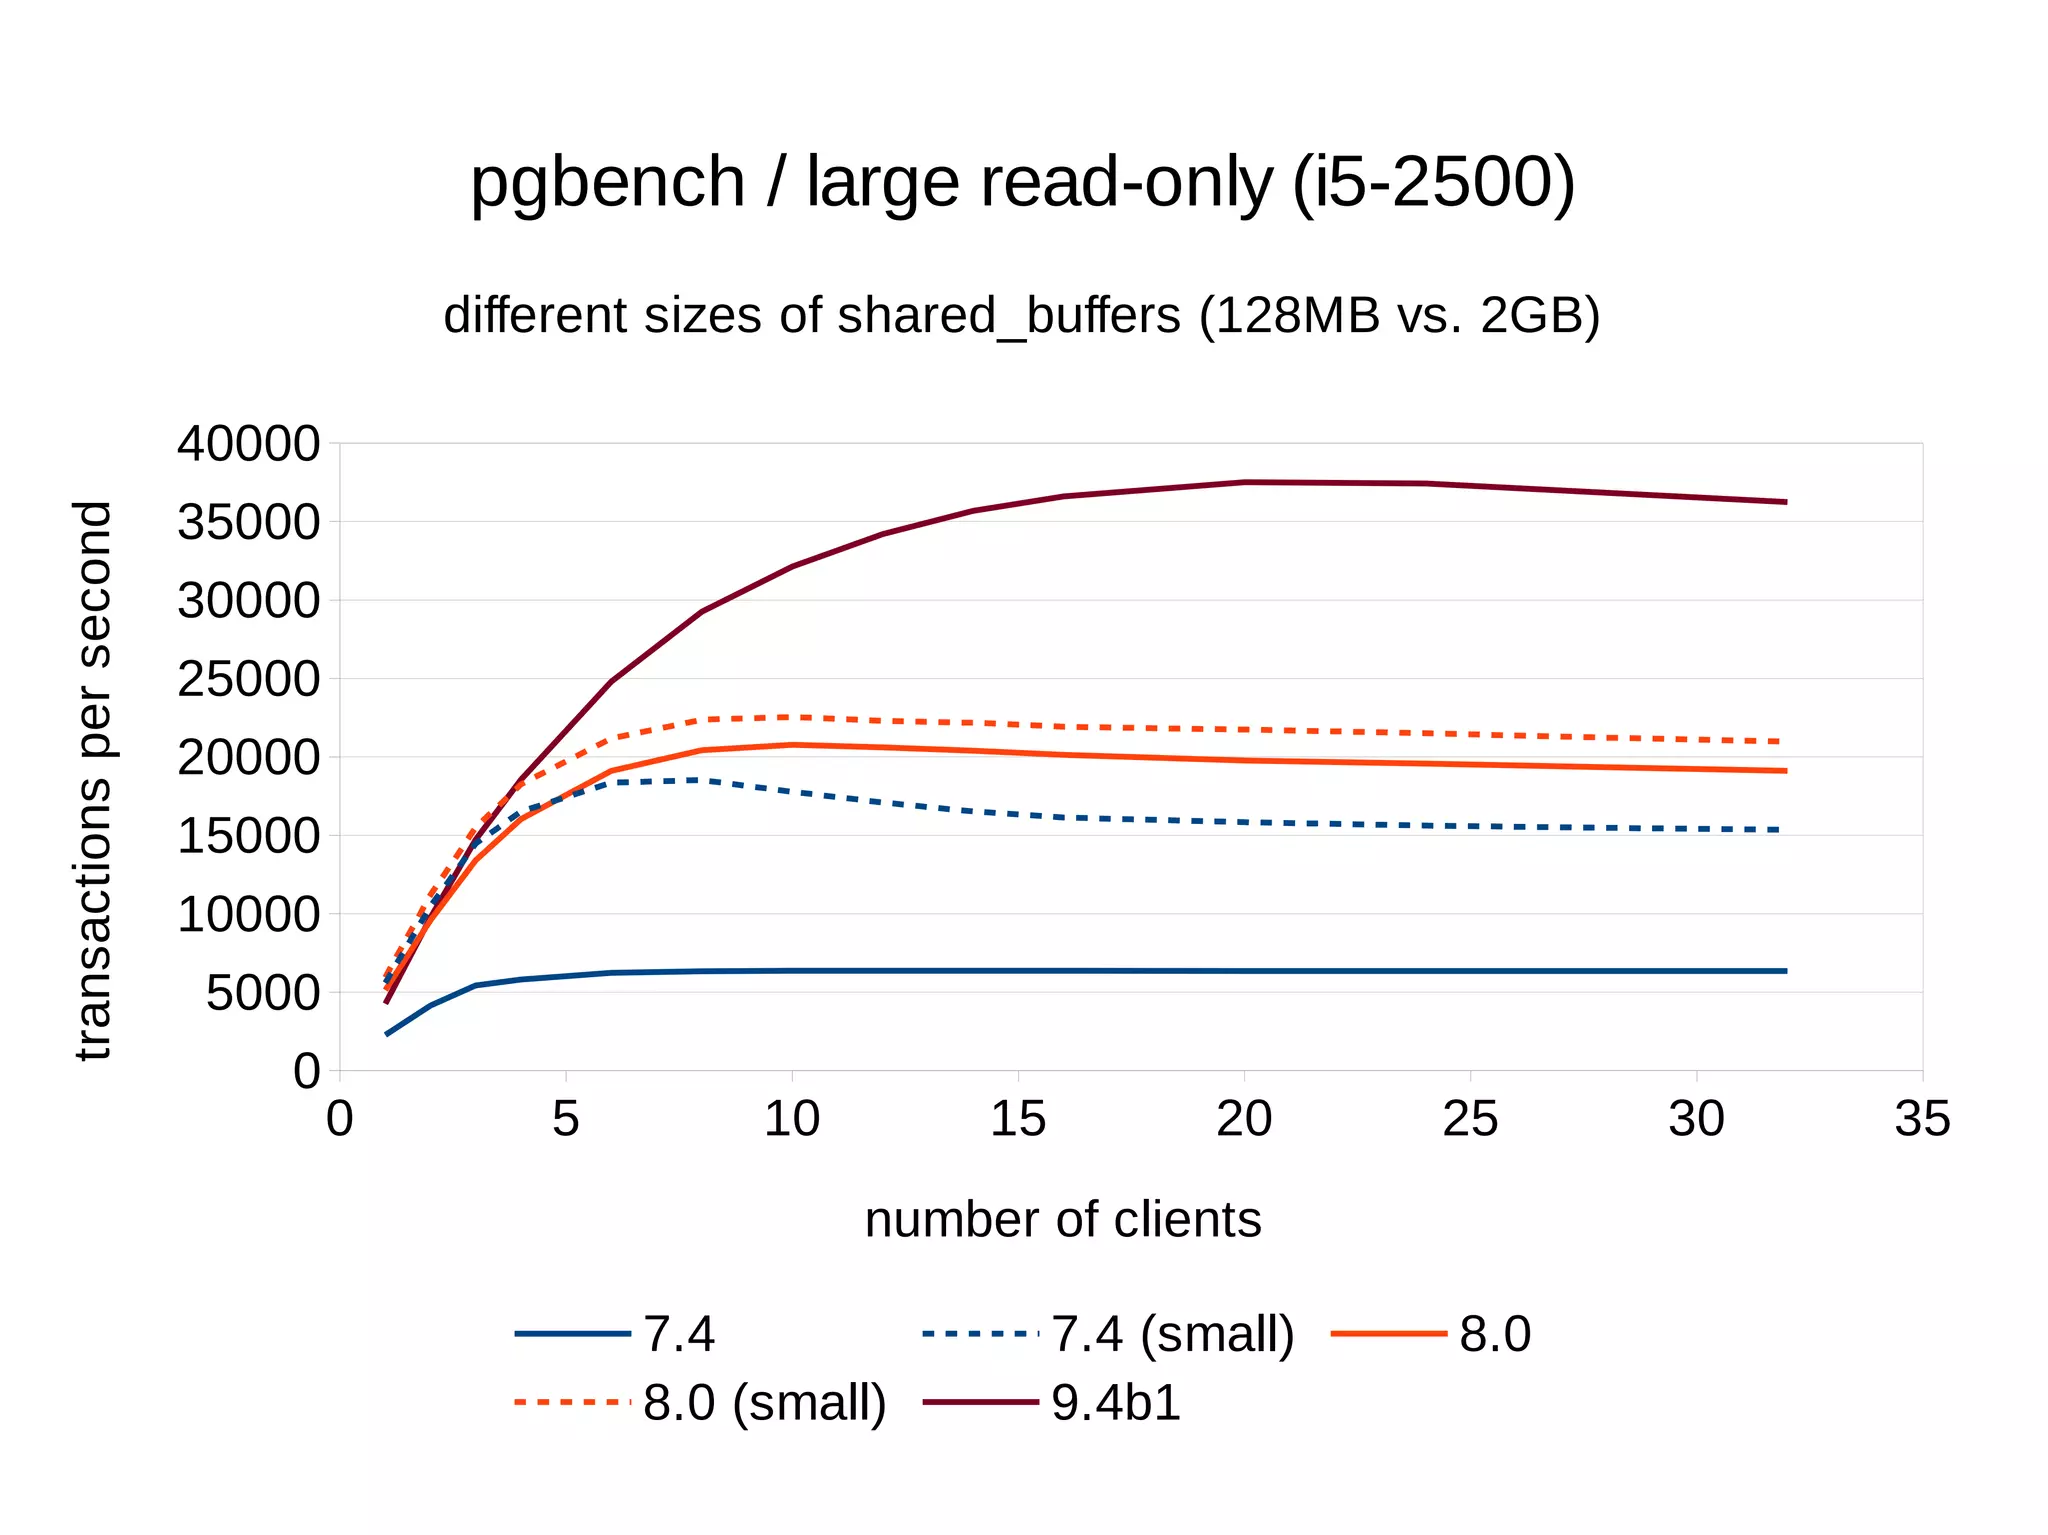
- Up to 6x faster transaction processing rates in pgbench
- Much better scalability to multiple cores and clients
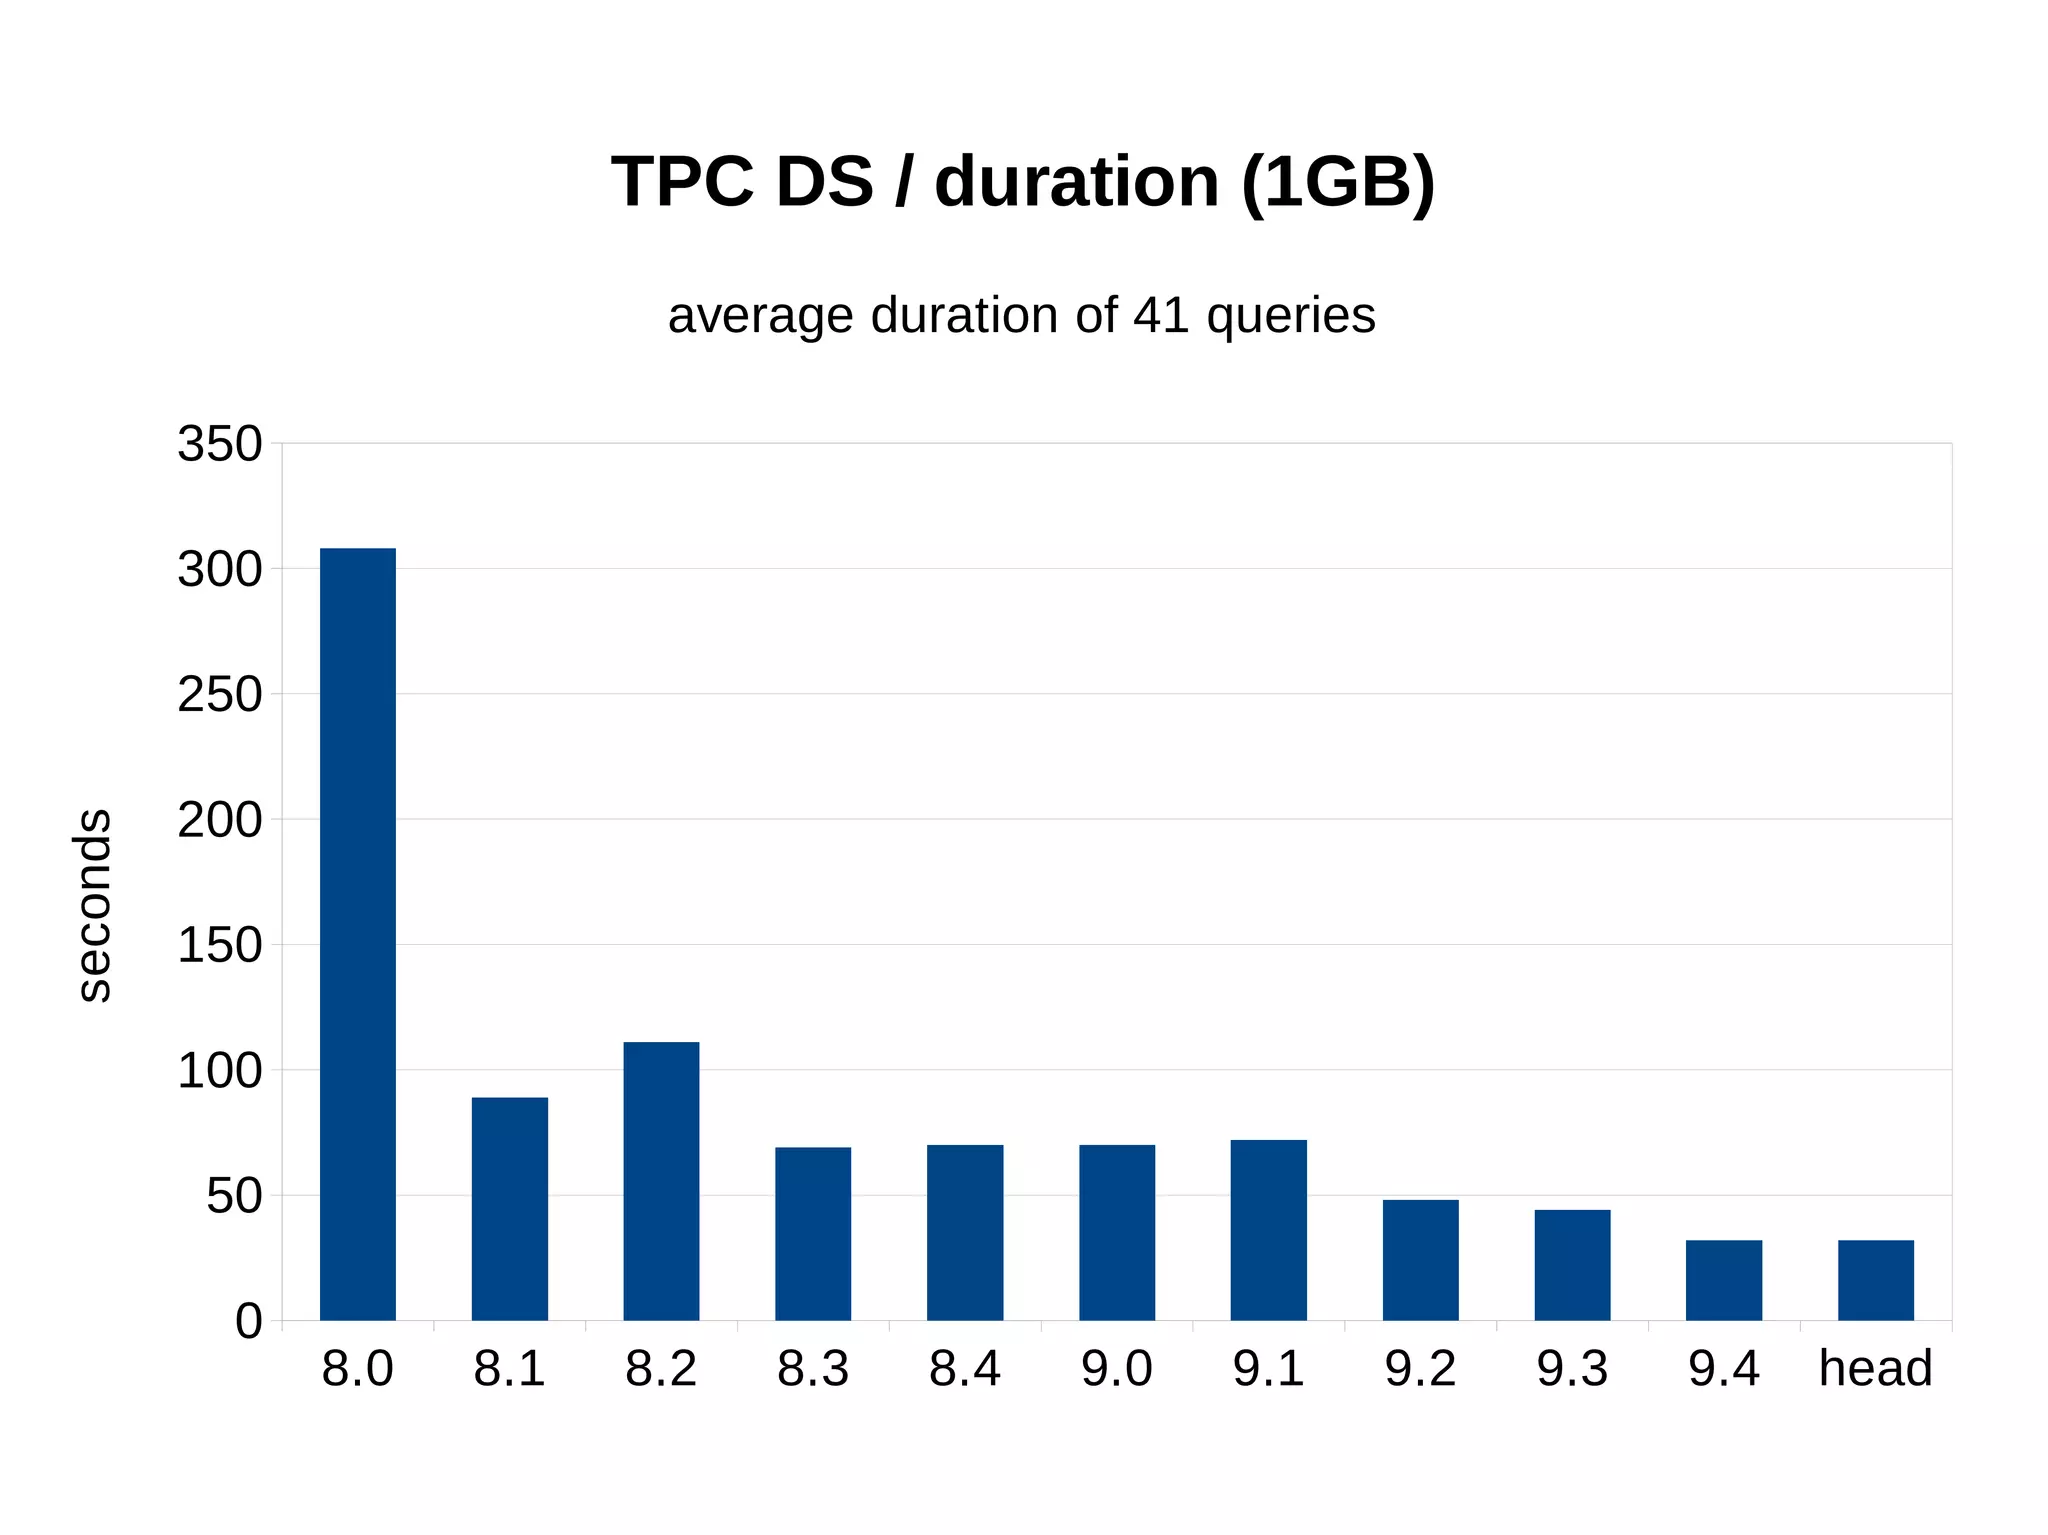
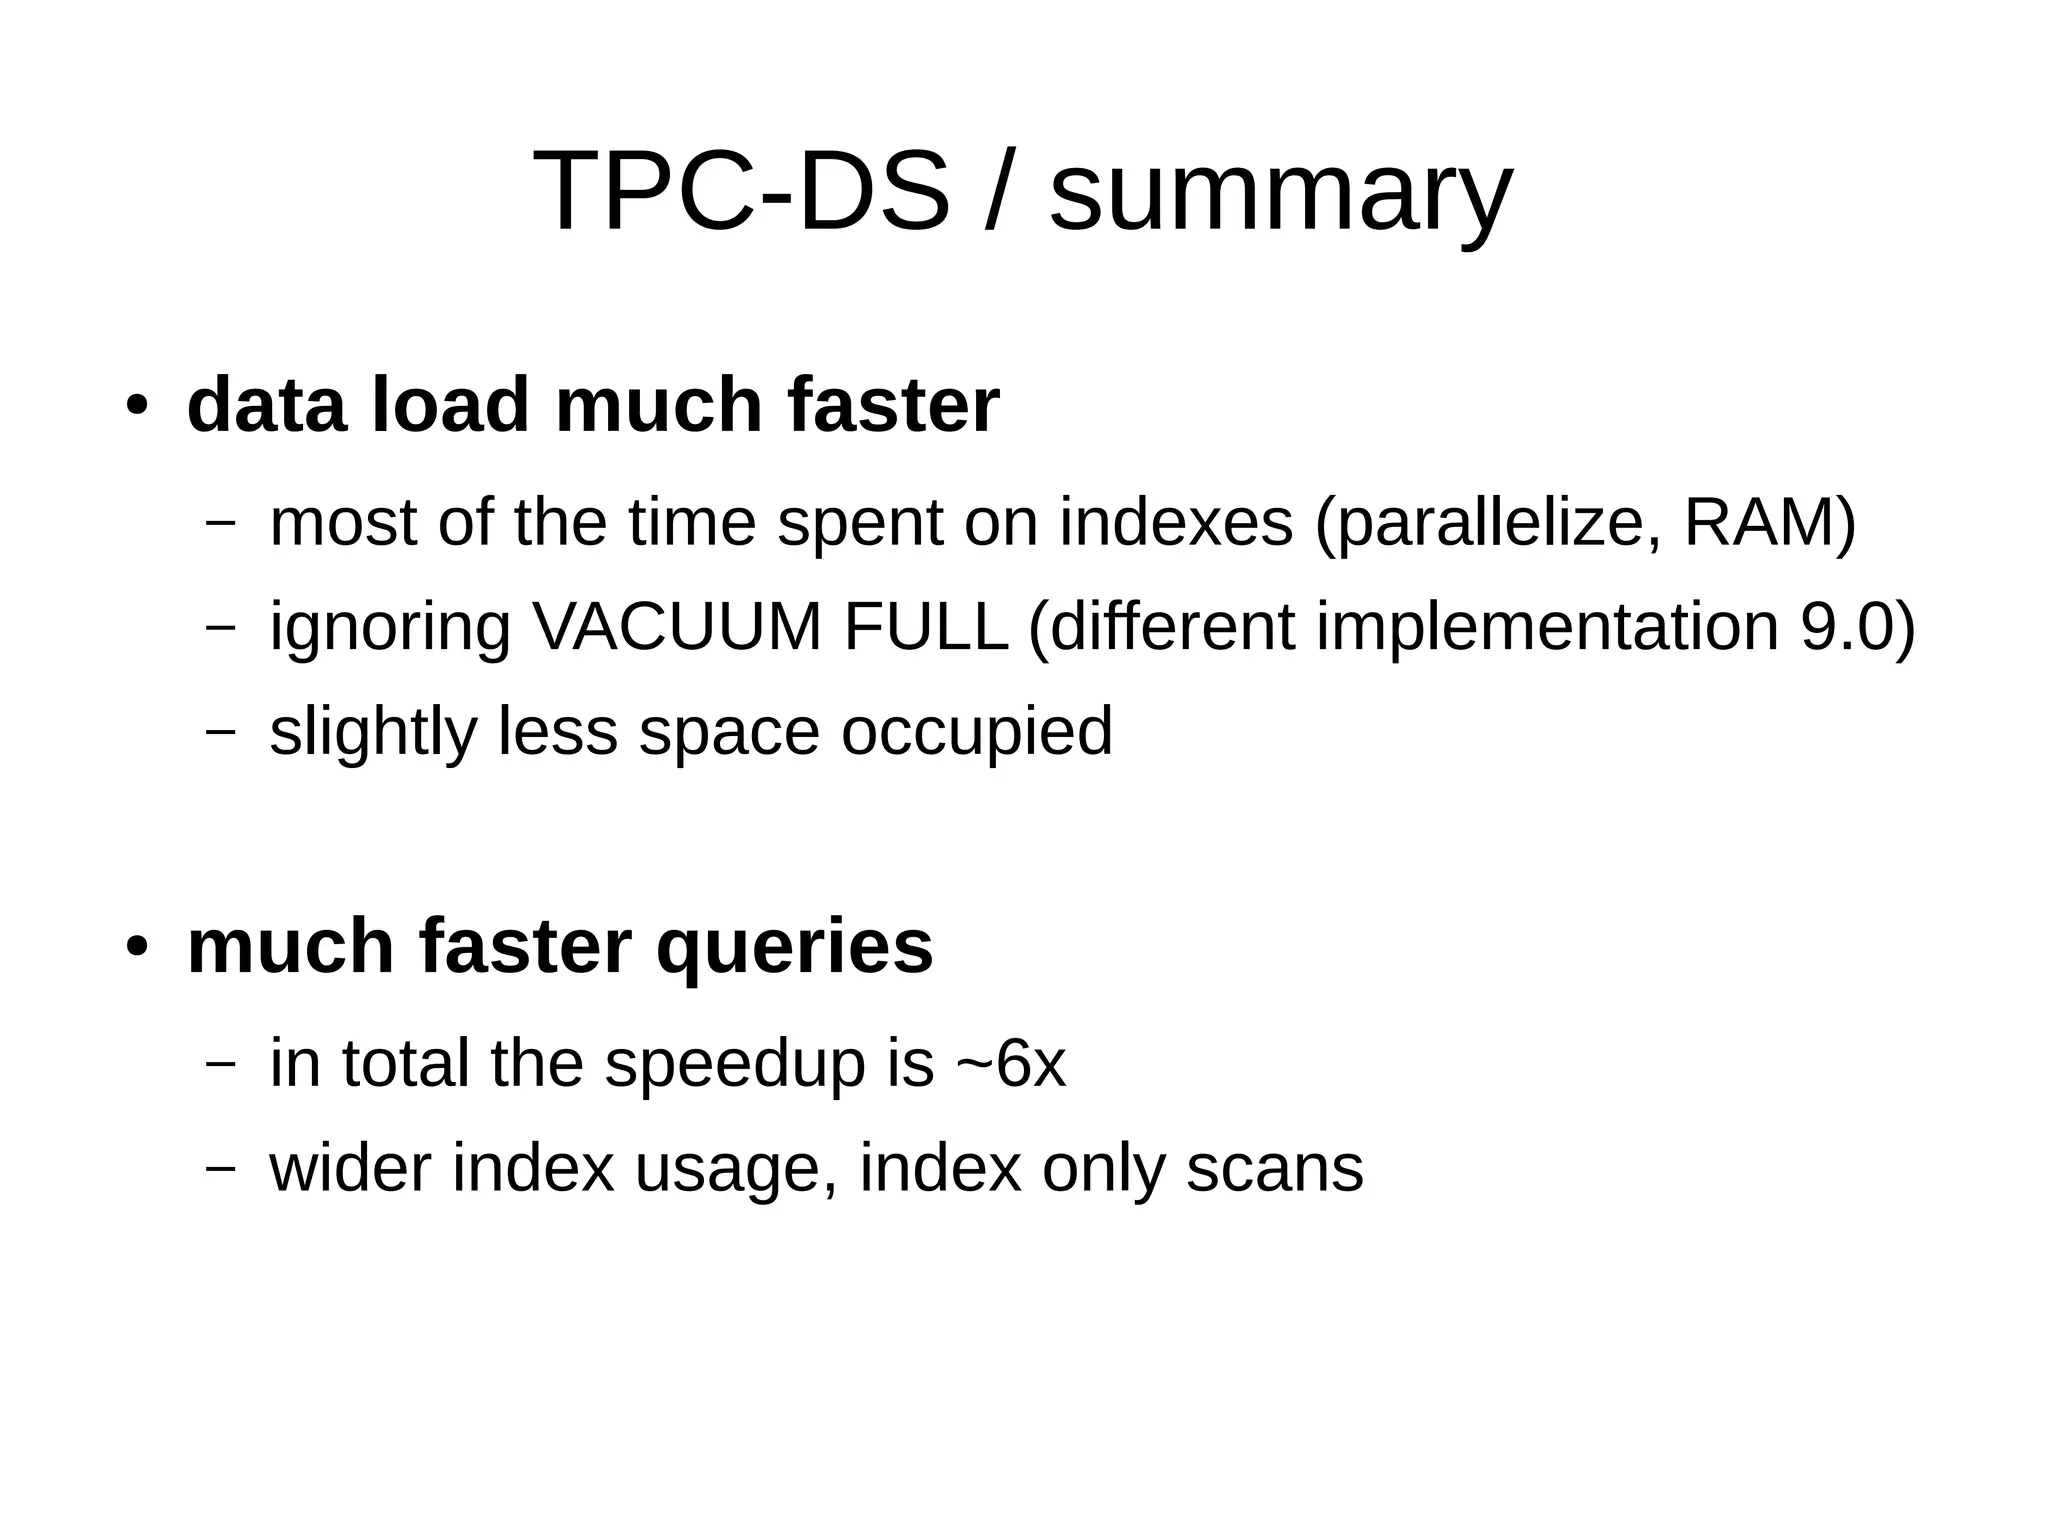
- 6x faster query times for TPC-DS data warehouse benchmark
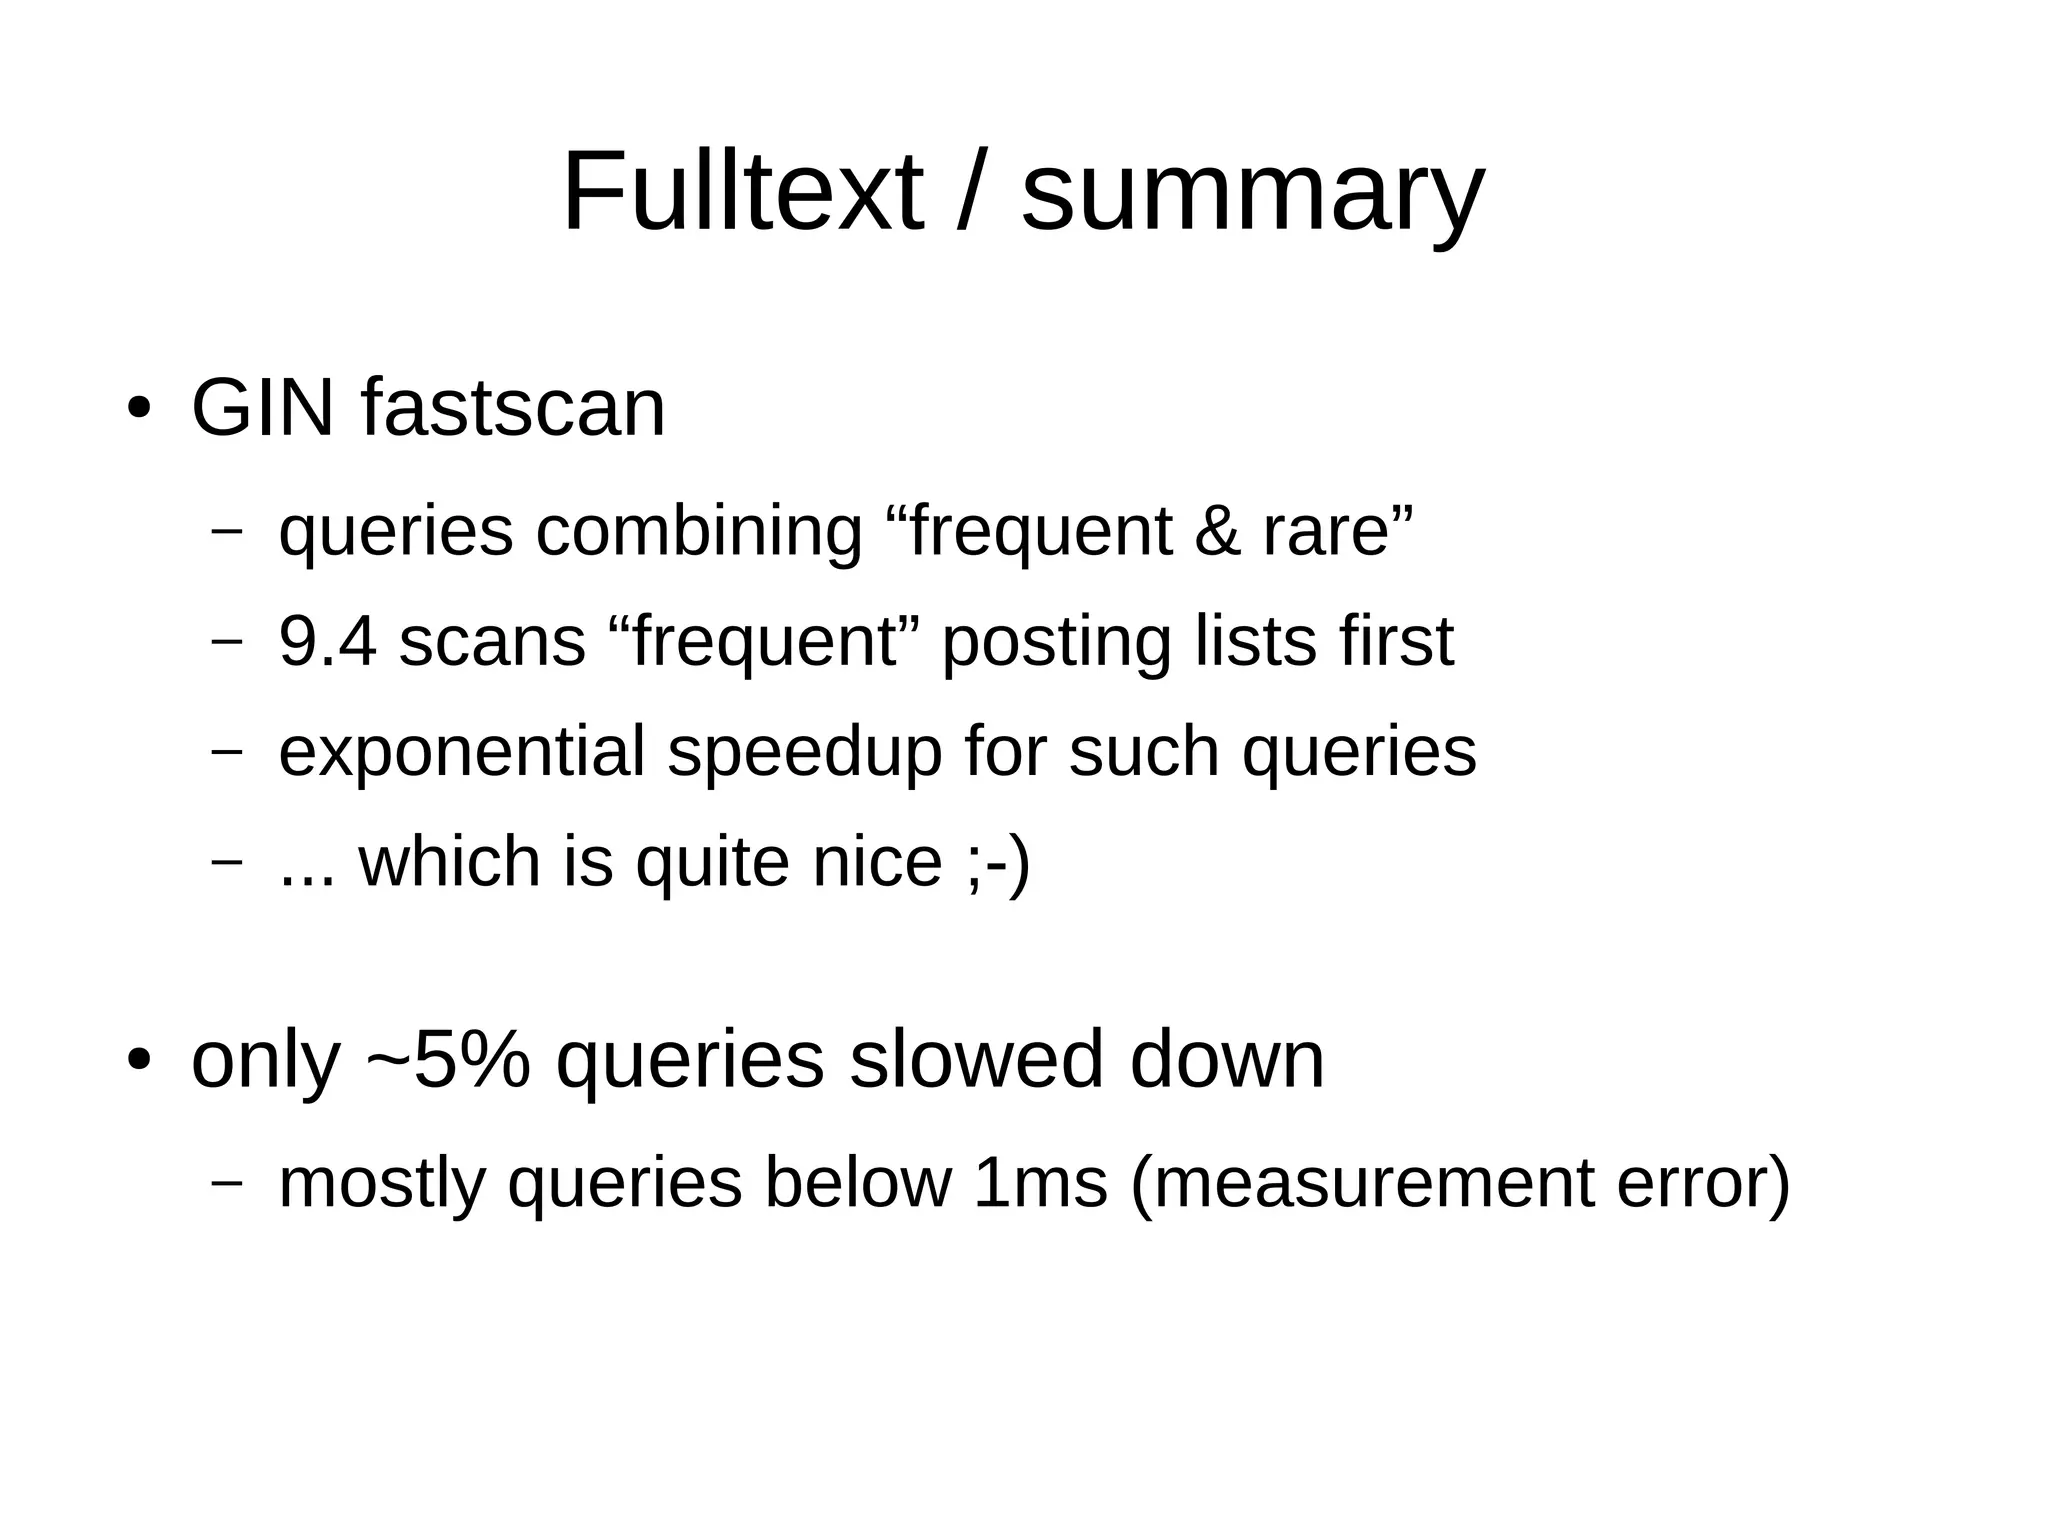
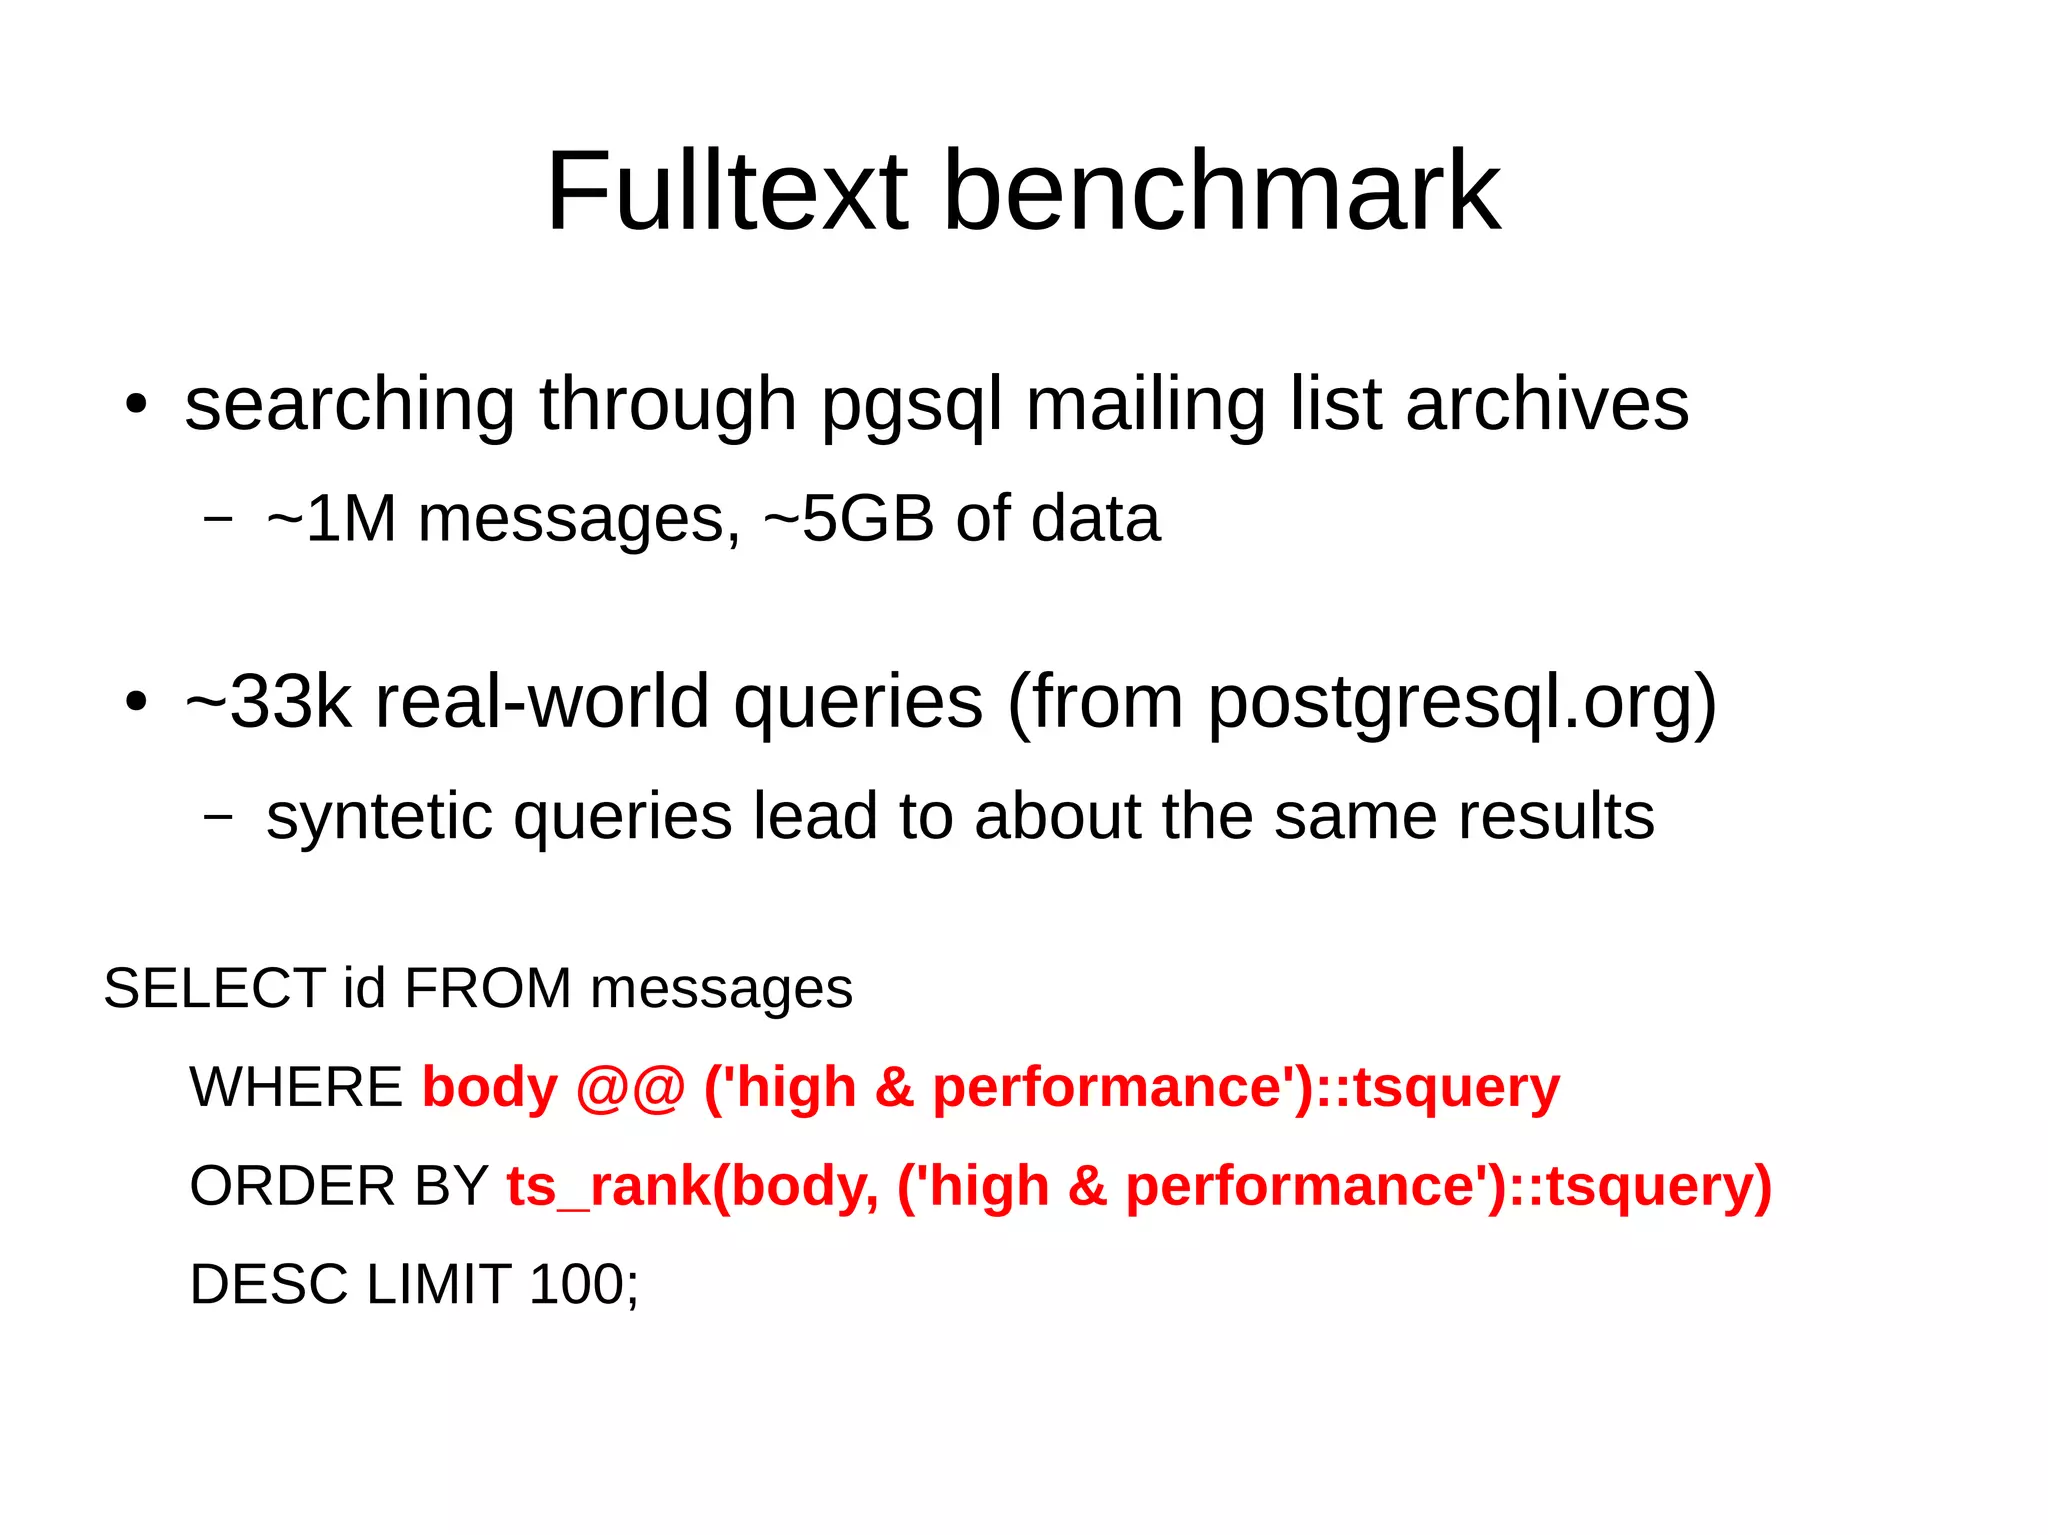
- Over 10x speedup for some full text search queries in latest version
The benchmarks demonstrate that PostgreSQL has become dramatically faster and more scalable over the past 10+ years, while also using less disk space and memory.


![8.0 8.1 8.2 8.3 8.4 9.0 9.1 9.2 9.3 9.4 head
7000
6000
5000
4000
3000
2000
1000
0
TPC DS / database size per 1GB raw data
data indexes
size [MB]](https://image.slidesharecdn.com/performance-archaeology-141022042347-conversion-gate01/75/PostgreSQL-performance-archaeology-32-2048.jpg)
![8.0 8.1 8.2 8.3 8.4 9.0 9.1 9.2 9.3 9.4 head
1400
1200
1000
800
600
400
200
0
TPC DS / load duration (1GB)
copy indexes vacuum full vacuum freeze analyze
duration [s]](https://image.slidesharecdn.com/performance-archaeology-141022042347-conversion-gate01/75/PostgreSQL-performance-archaeology-33-2048.jpg)
![8.0 8.1 8.2 8.3 8.4 9.0 9.1 9.2 9.3 9.4 head
1200
1000
800
600
400
200
0
TPC DS / load duration (1GB)
copy indexes vacuum freeze analyze
duration [s]](https://image.slidesharecdn.com/performance-archaeology-141022042347-conversion-gate01/75/PostgreSQL-performance-archaeology-34-2048.jpg)
![8.0 8.1 8.2 8.3 8.4 9.0 9.1 9.2 9.3 9.4
9000
8000
7000
6000
5000
4000
3000
2000
1000
0
TPC DS / load duration (16 GB)
LOAD INDEXES VACUUM FREEZE ANALYZE duration [seconds]](https://image.slidesharecdn.com/performance-archaeology-141022042347-conversion-gate01/75/PostgreSQL-performance-archaeology-35-2048.jpg)
![8.0* 8.1 8.2 8.3 8.4 9.0 9.1 9.2 9.3 9.4
6000
5000
4000
3000
2000
1000
0
TPC DS / duration (16 GB)
average duration of 41 queries
version
duration [seconds]](https://image.slidesharecdn.com/performance-archaeology-141022042347-conversion-gate01/75/PostgreSQL-performance-archaeology-37-2048.jpg)
![2000
1800
1600
1400
1200
1000
800
600
400
200
0
Fulltext benchmark / load
COPY / with indexes and PL/pgSQL triggers
COPY VACUUM FREEZE ANALYZE
duration [sec]](https://image.slidesharecdn.com/performance-archaeology-141022042347-conversion-gate01/75/PostgreSQL-performance-archaeology-41-2048.jpg)
![8.0 8.1 8.2 8.3 8.4 9.0 9.1 9.2 9.3 9.4
6000
5000
4000
3000
2000
1000
0
Fulltext benchmark / GiST
33k queries from postgresql.org [TOP 100]
total runtime [sec]](https://image.slidesharecdn.com/performance-archaeology-141022042347-conversion-gate01/75/PostgreSQL-performance-archaeology-42-2048.jpg)
![8.2 8.3 8.4 9.0 9.1 9.2 9.3 9.4
800
700
600
500
400
300
200
100
0
Fulltext benchmark / GIN
33k queries from postgresql.org [TOP 100]
total runtime [sec]](https://image.slidesharecdn.com/performance-archaeology-141022042347-conversion-gate01/75/PostgreSQL-performance-archaeology-43-2048.jpg)
![8.0 8.1 8.2 8.3 8.4 9.0 9.1 9.2 9.3 9.4
6000
5000
4000
3000
2000
1000
0
Fulltext benchmark - GiST vs. GIN
33k queries from postgresql.org [TOP 100]
GiST GIN
total duration [sec]](https://image.slidesharecdn.com/performance-archaeology-141022042347-conversion-gate01/75/PostgreSQL-performance-archaeology-44-2048.jpg)
![9.4 durations, divided by 9.3 durations (e.g. 0.1 means 10x speedup)
1.8
1.6
1.4
1.2
1
0.8
0.6
0.4
0.2
0
Fulltext benchmark / 9.3 vs. 9.4 (GIN fastscan)
0.1 1 10 100 1000
duration on 9.3 [miliseconds, log scale]
9.4 duration (relative to 9.3)](https://image.slidesharecdn.com/performance-archaeology-141022042347-conversion-gate01/75/PostgreSQL-performance-archaeology-45-2048.jpg)