Downloaded 146 times

![Some terminology
• Cost
– Unit of measure to compare plan estimated perf
– Equivalent to expected #single block reads
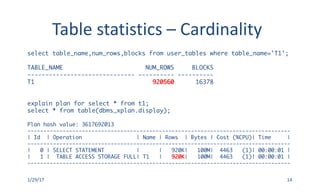
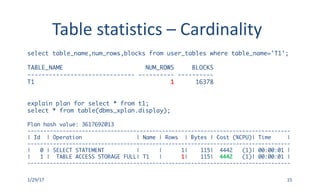
• Cardinality
– Number of rows handled, produced / consumed
• Selectivity
– % of filtering caused by predicates, range is [0,1]
– Output card = input card * selectivity
1/29/17 3](https://image.slidesharecdn.com/oraclestatisticsbyexample-170129154227/85/Oracle-statistics-by-example-3-320.jpg)

![Table statistics
• Optimizer only uses two statistics
– Number of blocks below HWM
• [ALL|DBA|USER]_TABLES.NUM_BLOCKS
• Used to cost Full Table Scan operations
– Number of rows in the table
• [ALL|DBA|USER]_TABLES.NUM_ROWS
• Used to estimate how many rows we dealing with
1/29/17 11](https://image.slidesharecdn.com/oraclestatisticsbyexample-170129154227/85/Oracle-statistics-by-example-11-320.jpg)
![Column Statistics
• Optimizer uses
– Number of distinct values (NDV)
• [ALL|DBA|USER]_TAB_COLS.NUM_DISTINCT
• Used to determine selectivity (no histogram present)
– Number of NULLs
• [ALL|DBA|USER]_TAB_COLS.NUM_NULLS
• Used to estimate how many rows we dealing with
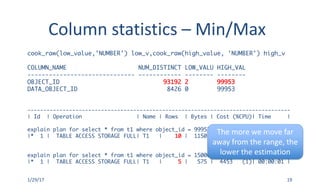
– Min/Max value
• [ALL|DBA|USER]_TAB_COLS.[LOW|HIGH]_VALUE
• Used to determine in|out-of range
1/29/17 16](https://image.slidesharecdn.com/oraclestatisticsbyexample-170129154227/85/Oracle-statistics-by-example-16-320.jpg)

![Column Statistics
• Optimizer also uses
– Density
• Not stored in dictionary (old one was, new one no)
• Used for unpopular value selectivity
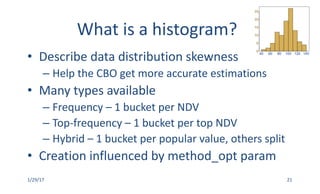
– Histogram
• [ALL|DBA|USER]_TAB_COLS.LOW_VALUE
• [ALL|DBA|USER]_TAB_COLS.HIGH_VALUE
• [ALL|DBA|USER]_TAB_HISTOGRAMS
• Used for popular value selectivity
1/29/17 20](https://image.slidesharecdn.com/oraclestatisticsbyexample-170129154227/85/Oracle-statistics-by-example-20-320.jpg)
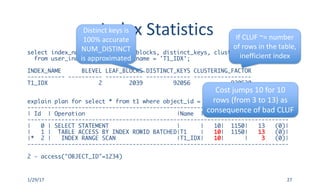
![Index Statistics
• Optimizer uses
– Blevel
• [ALL|DBA|USER]_INDEXES.BLEVEL
• Used to estimate how expensive is to locate first leaf
– Number of leaf blocks (LB)
• [ALL|DBA|USER]_INDEXES.LEAF_BLOCKS
• Used to estimate how many index leaf blocks to read
– Clustering Factor (CLUF)
• [ALL|DBA|USER]_INDEXES.CLUSTERING_FACTOR
• Used to estimate how many table blocks to read
– Distinct Keys (DK)
• [ALL|DBA|USER]_INDEXES.DISTINCT_KEYS
• Used to help with data correlation
1/29/17 25](https://image.slidesharecdn.com/oraclestatisticsbyexample-170129154227/85/Oracle-statistics-by-example-25-320.jpg)


The document discusses the importance of statistics in Oracle's cost-based optimizer (CBO) for generating optimal execution plans for SQL queries. It emphasizes that better statistics lead to improved performance and outlines how to collect, analyze, and maintain these statistics using tools like dbms_stats, including details on types of statistics relevant to tables and indexes. Furthermore, it highlights various factors impacting the quality of statistics, such as data distribution and the use of histograms, and provides examples of how improper statistics can affect query performance.