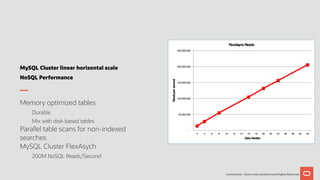
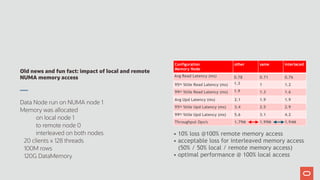
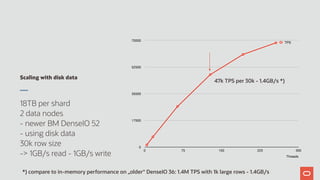
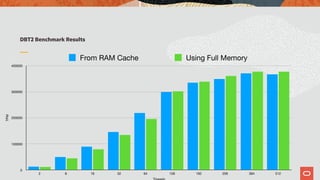
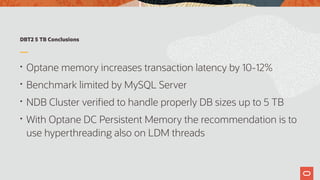
Linear scale with MySQL Cluster
MySQL Cluster linear horizontal scale
NoSQL Performance
Confidential – Oracle Internal/Restricted/Highly Restricted
Memory optimized tables
Durable
Mix with disk-based tables
Parallel table scans for non-indexed
searches
MySQL Cluster FlexAsych
200M NoSQL Reads/Second
!-!!!!
!50,000,000!!
!100,000,000!!
!150,000,000!!
!200,000,000!!
!250,000,000!!
2! 4! 6! 8! 10! 12! 14! 16! 18! 20! 22! 24! 26! 28! 30! 32!
Reads!per!second!
Data!Nodes!
FlexAsync!Reads!
Confidential – Oracle Internal/Restricted/Highly Restricted
MySQL Cluster linear horizontal scale
SQL Performance
Memory optimized tables
Durable
Mix with disk-based tables
Massively concurrent OLTP
Distributed Joins for analytics
Parallel table scans for non-indexed searches
MySQL Cluster DBT2 BM
2.5M SQL Statements/Second
!-!!!!
!500,000!!
!1,000,000!!
!1,500,000!!
!2,000,000!!
!2,500,000!!
!3,000,000!!
2! 4! 6! 8! 10! 12! 14! 16!
SQL!Statements/sec!
Data!Nodes!
DBT2!SQL!Statements!per!Second!
NDB as a key value store - using SQL
YCSB and MySQL Cluster set-up
• MySQL Server on BM.Standard
2 Server instances per host
• Data Nodes on DenseIO
full duplication of data, 2 replicas
strong consistent across both replicas
ACID (read committed)
• YCSB
JDBC driver, standard SQL used
competitors use NoSQL API
unmodified downloaded binaries version 0.15.0, co-
located with MySQL Server
1k byte rows, 10 columns (default config), uniform
distribution
YCSB

JDBC
YCSB

JDBC
NUMA0 NUMA1
BM36.Standard instance
YCSB

JDBC
YCSB

JDBC
NUMA0 NUMA1
BM36.Standard instance
…
BM.DenseIO instances, 1 data node / instance
Product Nodes TPS/OPS
32 227k
2 275k
3 715k
6 1.6M
8 1.6M
2 1.4M
4 2.8M
YCSB Results
YCSB : Yahoo Cloud Serving Benchmark 

Developed at Yahoo for Cloud Scale workloads

Widely used to compare scale-out databases, NoSQL
databases, and (non-durable) in-memory data grids 

A series of workload types are defined: 

Workload A: 50% reads, 50% Updates 

The YCSB Client cannot be changed

DB Vendors implement the DB Client interface in Java 

The version and exact configuration matters 

MySQL uses SQL via JDBC! Numbers based on best results published by
respective vendor.
Linear scale
• YCSB 0.15.0
1kB records, uniform distribution
• 2 and 4 data nodes on BM DenseIO X5 36 core

in single Availability Domain
• 8 data nodes X5 36 core BM DenseIO across 2 ADs
adding 400us network latency
• Best throughput and latency on market
1M
2M
3M
4M
2

(1 AD)
4
(1 AD)
8
(2 ADs)
1.4M
2.8M
3.7M
Transactionspersecond
Nodes
replication factor 2, strong consistency, ACID
Scaling number of rows
Number of rows in
cluster has no
performance
impact!
Configuration
(threads per client)
300M rows
128 threads x 10 clients
600M rows
128 threads x 10 clients
95th %tile Read Latency 0.9 ms 0.9 ms
99th %tile Read Latency 1 ms 1 ms
95th %tile Update Latency 1.7 ms 1.7 ms
99th %tile Update Latency 2 ms 2 ms
Throughput Ops/s 1.26M 1.25M
1M
2M
3M
Transactionpersecond
2 ms
4 ms
Same Throughput & Latency
Old news and fun fact: impact of local and remote
NUMA memory access
Data Node run on NUMA node 1
Memory was allocated
on local node 1
to remote node 0
interleaved on both nodes
20 clients x 128 threads
100M rows
120G DataMemory
• 10% loss @100% remote memory access
• acceptable loss for interleaved memory access 

(50% / 50% local / remote memory access)
• optimal performance @ 100% local access
Configuration
Memory Node
other same interlaced
Avg Read Latency (ms) 0.78 0.71 0.76
95th %tile Read Latency (ms) 1.3 1 1.2
99th %tile Read Latency (ms) 1.9 1.3 1.6
Avg Upd Latency (ms) 2.1 1.9 1.9
95th %tile Upd Latency (ms) 3.4 2.5 2.9
99th %tile Upd Latency (ms) 5.6 3.1 4.2
Throughput Ops/s 1.79M 1.99M 1.94M
Scaling with disk data
18TB per shard
2 data nodes
- newer BM DenseIO 52
- using disk data
30k row size
-> 1GB/s read - 1GB/s write
0
17500
35000
52500
70000
Threads
0 75 150 225 300
TPS
47k TPS per 30k - 1.4GB/s *)
*) compare to in-memory performance on „older“ DenseIO 36: 1.4M TPS with 1k large rows - 1.4GB/s
Confidential – Oracle Internal/Restricted/Highly Restricted
Hadoop (HopsFS) 

with NDB Cluster
NameNodes
Leader
HDFS Client
DataNodes
hops.io
ClusterJ
Small
Files
Confidential – Oracle Internal/Restricted/Highly Restricted
MySQL Cluster Linear Scaleability
Scaling Reads
and Writes
20x improvement!
HopsFS Hadoop name nodes on NDB Cluster
- Spotify workload
*) Data from LogicalClocks
Faster SQL with parallel query
TPC-H Improvement in 8.0.20 vs 7.6/7.5
PercentageimprovementwithNDB8.0.20
1
10
100
1000
10000
Q2 Q3 Q4 Q5 Q6 Q7 Q8 Q9 Q10 Q11 Q12 Q13 Q14 Q15 Q16 Q17 Q18 Q19 Q20 Q21 Q22
Improvements 8.0.20 vs 7.5.16 Improvements 8.0.20 vs 7.6.12
Data Node
Multiple Threads per data node
Parallel execution of
… multiple queries from …
… multiple users on …
… multiple MySQL Servers
Communication with signals
Goal: minimize context switching
NIC
Main thread
Local
Data
Managers
Receive
Send
Disk/SSD IO
DataMemory
(RAM)
Lock free multi core VM
• Data is partitioned inside the data nodes
• Communication asynchronously, event driven
on cluster’s VM
• No group communication - instead using
Distributed row locks
Non-blocking 2-phase commit
NIC
Main thread
Local
Data
Managers
Receive
Send
Disk/SSD IO
DataMemory
(RAM)
Queries in multithreaded NDB Virtual Machine
• Even a single query from MySQL Server executed in parallel
DataMemory
(RAM)
QUERY …
Massive parallel system executing parallel queries
Receive Send
Transaction Data Manager
Data Node Data Node
Receive Send
Transaction Data Manager
Data distribution awareness
• Key-value with hash on
primary key
• Complemented by
ordered in-memory-
optimised T-Tree
indexes for fast
searches
For PK operations
NDB data partition
is simply calculated
PK Service Data
739 Instagram xxx
Consolidated view of distributed data
• Clients and MySQL
Servers see a
consolidated view of
the distributed data
• Joins are pushed down
to data nodes
• Parallel cross-shard
execution in the data
nodes
• Result consolidation in
MySQL Server
Consolidated view of distributed data
Btw, cross-shard foreign keys supported!
Parallel cross-partition queries
• Parallel execution on the
data nodes and within
data nodes
• 64 cpus per node
leveraged
• parallelizes single queries
• 144 data nodes 

x 32 partitions 

= 4608! CPUs
+ 32 other processing
threads per node
• automatic batching, event
driven and asynchronous
PK Service Data
253 Tiktok xxx
892 Snapchat xxx
253 Discord xxx
739 Instagram xxx
Parallel cross-partition queries
$ SELECT * FROM services
LEFT JOIN data USING(service)
Data Nodes
Service Data
Snapchat xxx
PK Service
892 Snapchat
PK Service Data
892 Snapchat xxx
… … …
Parallel execution of
single queries
on the data nodes
and within data nodes
+
TPC-H
Analytics benchmark
TPC-H Latency - effect of parallelism within data node
Percentagechange12LDMsvs6LDMs
-25
0
25
50
75
100
TPC-H Queries
Q2 Q3 Q4 Q5 Q6 Q7 Q8 Q9 Q10 Q11 Q12 Q13 Q14 Q15 Q16 Q17 Q18 Q19 Q20 Q21 Q22
12LDM vs 6 LDM
TPC-H queries - NDB vs InnoDB
2-node always-consistent redundant
NDB in-memory vs standalone InnoDB
• benefits of parallel query in NDB
• NDB network and replicas 

vs InnoDB local memory
• disclaimer: InnoDB not tuned
TPC-H NDB vs InnoDB
2-node HA fully-replicated NDB
compared to standalone local InnoDB
PercentagedifferenceNDBvsInnoDB
-1500
0
1500
3000
4500
6000
TPC-H Queries
Q2 Q3 *) Q4 Q5 Q6 Q7 Q8 *) Q9 Q10 Q11 Q12 Q13 Q14 Q15 Q16 Q17 Q18 Q19 Q20 Q21 Q22
NDB vs InnoDB (used with grain of salt)
DBT2
OLTP benchmark
- simulating wholesale parts supplier
- fair usage implementation of TPC-C
- quite old but great for testing OLTP
1 warehouse = 500k rows
DBT2 Scenario 1 - comparing cluster setups
• Up to 6 Data Nodes on 

DenseIO BareMetal, 52 CPU cores
• 15 MySQL Server Nodes on 

Bare Metal, 36 CPU cores
DBT2 - comparing cluster setups
3 different configurations
- 2 replica in 1 node group
- 3 replica in 2 node groups
- 2 replica in 3 node groups
0
1.250.000
2.500.000
3.750.000
5.000.000
0 3000 6000 9000 12000
DBT2 2 Replicas, 1 Node Group DBT2 2 Replicas, 3 Node Groups
DBT2 3 Replica, 2 Node Groups
Connections
DBT2 Scenario 2 - Persistent Memory
• 1 Data Node
• Intel Xeon Platinum 8260L @2.40 GHz
• 24 cores
• 6 TByte Intel Optane DC Persistent Memory
• 768 GB RAM
• Persistent Memory used in Memory mode
Picture: https://www.intel.com/content/www/us/en/architecture-and-technology/optane-dc-persistent-memory.html
DBT2 Loading 5TB warehouse data
• Parallel LOAD DATA INFILE in 32 threads
• > 2 warehouses loaded per second
• 1 warehouse = 500.000 rows
• => More than 1 M Inserts per second
• 45.000 warehouses in about 8 hours
• Number of warehouses limited by 5.9 TB SSD for REDO log and
checkpoint data, could load roughly 53.000 warehouses with a larger SSD
DBT2 Benchmark run
• DBT2 defaults to use the same number of warehouses as
threads
• Default behaviour with 512 threads in this setup means: 

all data accesses finds data in DRAM cache (768 G in size)
• DBT2 altered mode: 

warehouse is random 

benchmark will cause misses in DRAM cache
DBT2 Benchmark Results
TPM
0
100000
200000
300000
400000
2 8 16 32 64 128 192 256 384 512
From RAM Cache Using Full Memory
DBT2 5 TB Conclusions
• Optane memory increases transaction latency by 10-12%
• Benchmark limited by MySQL Server
• NDB Cluster verified to handle properly DB sizes up to 5 TB
• With Optane DC Persistent Memory the recommendation is to
use hyperthreading also on LDM threads
Thank You
Bernd Ocklin
Snr Director
MySQL Cluster Development

MySQL NDB Cluster 8.0 SQL faster than NoSQL

  • 2.
    Linear scale withMySQL Cluster
  • 3.
    MySQL Cluster linearhorizontal scale NoSQL Performance Confidential – Oracle Internal/Restricted/Highly Restricted Memory optimized tables Durable Mix with disk-based tables Parallel table scans for non-indexed searches MySQL Cluster FlexAsych 200M NoSQL Reads/Second !-!!!! !50,000,000!! !100,000,000!! !150,000,000!! !200,000,000!! !250,000,000!! 2! 4! 6! 8! 10! 12! 14! 16! 18! 20! 22! 24! 26! 28! 30! 32! Reads!per!second! Data!Nodes! FlexAsync!Reads!
  • 4.
    Confidential – OracleInternal/Restricted/Highly Restricted MySQL Cluster linear horizontal scale SQL Performance Memory optimized tables Durable Mix with disk-based tables Massively concurrent OLTP Distributed Joins for analytics Parallel table scans for non-indexed searches MySQL Cluster DBT2 BM 2.5M SQL Statements/Second !-!!!! !500,000!! !1,000,000!! !1,500,000!! !2,000,000!! !2,500,000!! !3,000,000!! 2! 4! 6! 8! 10! 12! 14! 16! SQL!Statements/sec! Data!Nodes! DBT2!SQL!Statements!per!Second!
  • 5.
    NDB as akey value store - using SQL
  • 6.
    YCSB and MySQLCluster set-up • MySQL Server on BM.Standard 2 Server instances per host • Data Nodes on DenseIO full duplication of data, 2 replicas strong consistent across both replicas ACID (read committed) • YCSB JDBC driver, standard SQL used competitors use NoSQL API unmodified downloaded binaries version 0.15.0, co- located with MySQL Server 1k byte rows, 10 columns (default config), uniform distribution YCSB
 JDBC YCSB
 JDBC NUMA0 NUMA1 BM36.Standard instance YCSB
 JDBC YCSB
 JDBC NUMA0 NUMA1 BM36.Standard instance … BM.DenseIO instances, 1 data node / instance
  • 7.
    Product Nodes TPS/OPS 32227k 2 275k 3 715k 6 1.6M 8 1.6M 2 1.4M 4 2.8M YCSB Results YCSB : Yahoo Cloud Serving Benchmark Developed at Yahoo for Cloud Scale workloads Widely used to compare scale-out databases, NoSQL databases, and (non-durable) in-memory data grids A series of workload types are defined: Workload A: 50% reads, 50% Updates The YCSB Client cannot be changed DB Vendors implement the DB Client interface in Java The version and exact configuration matters MySQL uses SQL via JDBC! Numbers based on best results published by respective vendor.
  • 8.
    Linear scale • YCSB0.15.0 1kB records, uniform distribution • 2 and 4 data nodes on BM DenseIO X5 36 core
 in single Availability Domain • 8 data nodes X5 36 core BM DenseIO across 2 ADs adding 400us network latency • Best throughput and latency on market 1M 2M 3M 4M 2
 (1 AD) 4 (1 AD) 8 (2 ADs) 1.4M 2.8M 3.7M Transactionspersecond Nodes replication factor 2, strong consistency, ACID
  • 9.
    Scaling number ofrows Number of rows in cluster has no performance impact! Configuration (threads per client) 300M rows 128 threads x 10 clients 600M rows 128 threads x 10 clients 95th %tile Read Latency 0.9 ms 0.9 ms 99th %tile Read Latency 1 ms 1 ms 95th %tile Update Latency 1.7 ms 1.7 ms 99th %tile Update Latency 2 ms 2 ms Throughput Ops/s 1.26M 1.25M 1M 2M 3M Transactionpersecond 2 ms 4 ms Same Throughput & Latency
  • 10.
    Old news andfun fact: impact of local and remote NUMA memory access Data Node run on NUMA node 1 Memory was allocated on local node 1 to remote node 0 interleaved on both nodes 20 clients x 128 threads 100M rows 120G DataMemory • 10% loss @100% remote memory access • acceptable loss for interleaved memory access 
 (50% / 50% local / remote memory access) • optimal performance @ 100% local access Configuration Memory Node other same interlaced Avg Read Latency (ms) 0.78 0.71 0.76 95th %tile Read Latency (ms) 1.3 1 1.2 99th %tile Read Latency (ms) 1.9 1.3 1.6 Avg Upd Latency (ms) 2.1 1.9 1.9 95th %tile Upd Latency (ms) 3.4 2.5 2.9 99th %tile Upd Latency (ms) 5.6 3.1 4.2 Throughput Ops/s 1.79M 1.99M 1.94M
  • 11.
    Scaling with diskdata 18TB per shard 2 data nodes - newer BM DenseIO 52 - using disk data 30k row size -> 1GB/s read - 1GB/s write 0 17500 35000 52500 70000 Threads 0 75 150 225 300 TPS 47k TPS per 30k - 1.4GB/s *) *) compare to in-memory performance on „older“ DenseIO 36: 1.4M TPS with 1k large rows - 1.4GB/s
  • 12.
    Confidential – OracleInternal/Restricted/Highly Restricted Hadoop (HopsFS) 
 with NDB Cluster NameNodes Leader HDFS Client DataNodes hops.io ClusterJ Small Files
  • 13.
    Confidential – OracleInternal/Restricted/Highly Restricted MySQL Cluster Linear Scaleability Scaling Reads and Writes 20x improvement! HopsFS Hadoop name nodes on NDB Cluster - Spotify workload *) Data from LogicalClocks
  • 14.
    Faster SQL withparallel query
  • 15.
    TPC-H Improvement in8.0.20 vs 7.6/7.5 PercentageimprovementwithNDB8.0.20 1 10 100 1000 10000 Q2 Q3 Q4 Q5 Q6 Q7 Q8 Q9 Q10 Q11 Q12 Q13 Q14 Q15 Q16 Q17 Q18 Q19 Q20 Q21 Q22 Improvements 8.0.20 vs 7.5.16 Improvements 8.0.20 vs 7.6.12
  • 16.
    Data Node Multiple Threadsper data node Parallel execution of … multiple queries from … … multiple users on … … multiple MySQL Servers Communication with signals Goal: minimize context switching NIC Main thread Local Data Managers Receive Send Disk/SSD IO DataMemory (RAM)
  • 17.
    Lock free multicore VM • Data is partitioned inside the data nodes • Communication asynchronously, event driven on cluster’s VM • No group communication - instead using Distributed row locks Non-blocking 2-phase commit NIC Main thread Local Data Managers Receive Send Disk/SSD IO DataMemory (RAM)
  • 18.
    Queries in multithreadedNDB Virtual Machine • Even a single query from MySQL Server executed in parallel DataMemory (RAM) QUERY …
  • 19.
    Massive parallel systemexecuting parallel queries Receive Send Transaction Data Manager Data Node Data Node Receive Send Transaction Data Manager
  • 20.
    Data distribution awareness •Key-value with hash on primary key • Complemented by ordered in-memory- optimised T-Tree indexes for fast searches For PK operations NDB data partition is simply calculated PK Service Data 739 Instagram xxx
  • 21.
    Consolidated view ofdistributed data • Clients and MySQL Servers see a consolidated view of the distributed data • Joins are pushed down to data nodes • Parallel cross-shard execution in the data nodes • Result consolidation in MySQL Server Consolidated view of distributed data Btw, cross-shard foreign keys supported!
  • 22.
    Parallel cross-partition queries •Parallel execution on the data nodes and within data nodes • 64 cpus per node leveraged • parallelizes single queries • 144 data nodes 
 x 32 partitions 
 = 4608! CPUs + 32 other processing threads per node • automatic batching, event driven and asynchronous PK Service Data 253 Tiktok xxx 892 Snapchat xxx 253 Discord xxx 739 Instagram xxx
  • 23.
    Parallel cross-partition queries $SELECT * FROM services LEFT JOIN data USING(service) Data Nodes Service Data Snapchat xxx PK Service 892 Snapchat PK Service Data 892 Snapchat xxx … … … Parallel execution of single queries on the data nodes and within data nodes +
  • 24.
  • 25.
    TPC-H Latency -effect of parallelism within data node Percentagechange12LDMsvs6LDMs -25 0 25 50 75 100 TPC-H Queries Q2 Q3 Q4 Q5 Q6 Q7 Q8 Q9 Q10 Q11 Q12 Q13 Q14 Q15 Q16 Q17 Q18 Q19 Q20 Q21 Q22 12LDM vs 6 LDM
  • 26.
    TPC-H queries -NDB vs InnoDB 2-node always-consistent redundant NDB in-memory vs standalone InnoDB • benefits of parallel query in NDB • NDB network and replicas 
 vs InnoDB local memory • disclaimer: InnoDB not tuned
  • 27.
    TPC-H NDB vsInnoDB 2-node HA fully-replicated NDB compared to standalone local InnoDB PercentagedifferenceNDBvsInnoDB -1500 0 1500 3000 4500 6000 TPC-H Queries Q2 Q3 *) Q4 Q5 Q6 Q7 Q8 *) Q9 Q10 Q11 Q12 Q13 Q14 Q15 Q16 Q17 Q18 Q19 Q20 Q21 Q22 NDB vs InnoDB (used with grain of salt)
  • 28.
    DBT2 OLTP benchmark - simulatingwholesale parts supplier - fair usage implementation of TPC-C - quite old but great for testing OLTP 1 warehouse = 500k rows
  • 29.
    DBT2 Scenario 1- comparing cluster setups • Up to 6 Data Nodes on 
 DenseIO BareMetal, 52 CPU cores • 15 MySQL Server Nodes on 
 Bare Metal, 36 CPU cores
  • 30.
    DBT2 - comparingcluster setups 3 different configurations - 2 replica in 1 node group - 3 replica in 2 node groups - 2 replica in 3 node groups 0 1.250.000 2.500.000 3.750.000 5.000.000 0 3000 6000 9000 12000 DBT2 2 Replicas, 1 Node Group DBT2 2 Replicas, 3 Node Groups DBT2 3 Replica, 2 Node Groups Connections
  • 31.
    DBT2 Scenario 2- Persistent Memory • 1 Data Node • Intel Xeon Platinum 8260L @2.40 GHz • 24 cores • 6 TByte Intel Optane DC Persistent Memory • 768 GB RAM • Persistent Memory used in Memory mode Picture: https://www.intel.com/content/www/us/en/architecture-and-technology/optane-dc-persistent-memory.html
  • 32.
    DBT2 Loading 5TBwarehouse data • Parallel LOAD DATA INFILE in 32 threads • > 2 warehouses loaded per second • 1 warehouse = 500.000 rows • => More than 1 M Inserts per second • 45.000 warehouses in about 8 hours • Number of warehouses limited by 5.9 TB SSD for REDO log and checkpoint data, could load roughly 53.000 warehouses with a larger SSD
  • 33.
    DBT2 Benchmark run •DBT2 defaults to use the same number of warehouses as threads • Default behaviour with 512 threads in this setup means: 
 all data accesses finds data in DRAM cache (768 G in size) • DBT2 altered mode: 
 warehouse is random 
 benchmark will cause misses in DRAM cache
  • 34.
    DBT2 Benchmark Results TPM 0 100000 200000 300000 400000 28 16 32 64 128 192 256 384 512 From RAM Cache Using Full Memory
  • 35.
    DBT2 5 TBConclusions • Optane memory increases transaction latency by 10-12% • Benchmark limited by MySQL Server • NDB Cluster verified to handle properly DB sizes up to 5 TB • With Optane DC Persistent Memory the recommendation is to use hyperthreading also on LDM threads
  • 36.
    Thank You Bernd Ocklin SnrDirector MySQL Cluster Development