Download as PDF, PPTX


![Interface overview01
dataegret.com
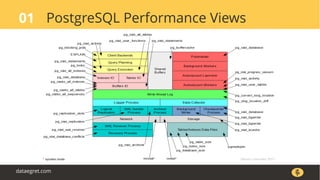
pgcenter: 2017-04-05 17:40:28, load average: 1.59, 0.74, 0.42 conn1 [ok]: /run/postgresql:5433 postgres@postg (ver: 10devel, up 2 days 20:29:27)
%cpu: 14.3 us, 3.9 sy, 0.0 ni, 45.8 id, 36.0 wa, 0.0 hi, 0.0 si, 0.0 st activity: 8/100 conns, 0/0 prepared, 1 idle, 0 idle_xact, 2 active, 6 waiting, 0 others
MiB mem: 7836 total, 1582 free, 3910 used, 2344 buff/cached autovacuum: 0/3 workers/max, 0 manual, 0 wraparound, 00:00:00 vac_maxtime
MiB swap: 5119 total, 5088 free, 31 used, 26/0 dirty/writeback statements: 7050 stmt/s, 0.123 stmt_avgtime, 00:00:00 xact_maxtime, 00:00:00 prep_maxtime
user database t_all_t t_read_t t_write_t t_cpu_t all_t read_t write_t cpu_t calls queryid query
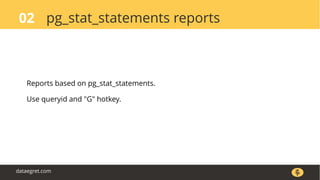
postgres pgbench 00:05:31 00:00:00 00:00:00 00:05:31 510 0 0 510 1006 08393211ce UPDATE pgbench_accounts SET abalance = abalance + $N WHERE aid = $N
postgres pgbench 00:00:09 00:00:00 00:00:00 00:00:09 14 0 0 14 1005 7c5345de88 UPDATE pgbench_branches SET bbalance = bbalance + $N WHERE bid = $N
postgres pgbench 00:00:07 00:00:00 00:00:00 00:00:07 14 0 0 14 1005 2cdaf0baaf UPDATE pgbench_tellers SET tbalance = tbalance + $N WHERE tid = $N
postgres pgbench 00:00:04 00:00:00 00:00:00 00:00:04 10 0 0 10 1005 5f72672d89 SELECT abalance FROM pgbench_accounts WHERE aid = $N
postgres pgbench 00:00:04 00:00:00 00:00:00 00:00:04 0 0 0 0 0 1097fe4e1b copy pgbench_accounts from stdin
postgres pgbench 00:00:03 00:00:00 00:00:00 00:00:03 0 0 0 0 0 3065f1faff SELECT datname, xact_commit AS commit, xact_rollback AS rollback, b
postgres pgbench 00:00:02 00:00:00 00:00:00 00:00:02 7 0 0 7 1005 f1f154154f INSERT INTO pgbench_history (tid, bid, aid, delta, mtime) VALUES ($
postgres postgres 00:00:02 00:00:00 00:00:00 00:00:02 9 0 0 9 1 9f21a96353 SELECT a.rolname AS user, d.datname AS database, date_trunc($N, rou
postgres postgres 00:00:01 00:00:00 00:00:00 00:00:01 0 0 0 0 0 b0cfaf67a8 create database pgbench
postgres postgres 00:00:01 00:00:00 00:00:00 00:00:01 0 0 0 0 0 6441d14dc3 SELECT datname, xact_commit AS commit, xact_rollback AS rollback, b
Device: rrqm/s wrqm/s r/s w/s rMB/s wMB/s avgrq-sz avgqu-sz await r_await w_await %util
sda: 0.00 0.00 0.00 0.00 0.00 0.00 0.00 0.00 0.00 0.00 0.00 0.00
sda1: 0.00 0.00 0.00 0.00 0.00 0.00 0.00 0.00 0.00 0.00 0.00 0.00
sda2: 0.00 0.00 0.00 0.00 0.00 0.00 0.00 0.00 0.00 0.00 0.00 0.00
sdb: 0.00 6.86 0.00 288.24 0.00 2.69 19.13 0.82 2.82 0.00 2.82 82.06
sdb1: 0.00 0.00 0.00 0.00 0.00 0.00 0.00 0.00 0.00 0.00 0.00 0.00
sdb2: 0.00 6.86 0.00 284.31 0.00 2.69 19.39 0.11 0.39 0.00 0.39 10.98
dm-0: 0.00 0.00 0.00 0.00 0.00 0.00 0.00 0.00 0.00 0.00 0.00 0.00
dm-1: 0.00 0.00 0.00 0.00 0.00 0.00 0.00 0.00 0.00 0.00 0.00 0.00
dm-2: 0.00 0.00 0.00 293.14 0.00 2.68 18.70 1.66 5.62 0.00 5.62 82.16](https://image.slidesharecdn.com/lesovsky-pg-troubleshooting-with-pgcenter-170526161152/85/Troubleshooting-PostgreSQL-with-pgCenter-8-320.jpg)
![Interface overview01
dataegret.com
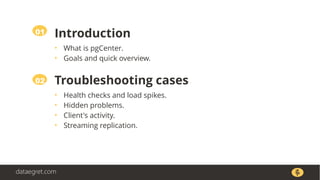
pgcenter: 2017-04-05 17:40:28, load average: 1.59, 0.74, 0.42 conn1 [ok]: /run/postgresql:5433 postgres@postg (ver: 10devel, up 2 days 20:29:27)
%cpu: 14.3 us, 3.9 sy, 0.0 ni, 45.8 id, 36.0 wa, 0.0 hi, 0.0 si, 0.0 st activity: 8/100 conns, 0/0 prepared, 1 idle, 0 idle_xact, 2 active, 6 waiting, 0 others
MiB mem: 7836 total, 1582 free, 3910 used, 2344 buff/cached autovacuum: 0/3 workers/max, 0 manual, 0 wraparound, 00:00:00 vac_maxtime
MiB swap: 5119 total, 5088 free, 31 used, 26/0 dirty/writeback statements: 7050 stmt/s, 0.123 stmt_avgtime, 00:00:00 xact_maxtime, 00:00:00 prep_maxtime
user database t_all_t t_read_t t_write_t t_cpu_t all_t read_t write_t cpu_t calls queryid query
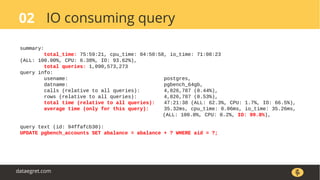
postgres pgbench 00:05:31 00:00:00 00:00:00 00:05:31 510 0 0 510 1006 08393211ce UPDATE pgbench_accounts SET abalance = abalance + $N WHERE aid = $N
postgres pgbench 00:00:09 00:00:00 00:00:00 00:00:09 14 0 0 14 1005 7c5345de88 UPDATE pgbench_branches SET bbalance = bbalance + $N WHERE bid = $N
postgres pgbench 00:00:07 00:00:00 00:00:00 00:00:07 14 0 0 14 1005 2cdaf0baaf UPDATE pgbench_tellers SET tbalance = tbalance + $N WHERE tid = $N
postgres pgbench 00:00:04 00:00:00 00:00:00 00:00:04 10 0 0 10 1005 5f72672d89 SELECT abalance FROM pgbench_accounts WHERE aid = $N
postgres pgbench 00:00:04 00:00:00 00:00:00 00:00:04 0 0 0 0 0 1097fe4e1b copy pgbench_accounts from stdin
postgres pgbench 00:00:03 00:00:00 00:00:00 00:00:03 0 0 0 0 0 3065f1faff SELECT datname, xact_commit AS commit, xact_rollback AS rollback, b
postgres pgbench 00:00:02 00:00:00 00:00:00 00:00:02 7 0 0 7 1005 f1f154154f INSERT INTO pgbench_history (tid, bid, aid, delta, mtime) VALUES ($
postgres postgres 00:00:02 00:00:00 00:00:00 00:00:02 9 0 0 9 1 9f21a96353 SELECT a.rolname AS user, d.datname AS database, date_trunc($N, rou
postgres postgres 00:00:01 00:00:00 00:00:00 00:00:01 0 0 0 0 0 b0cfaf67a8 create database pgbench
postgres postgres 00:00:01 00:00:00 00:00:00 00:00:01 0 0 0 0 0 6441d14dc3 SELECT datname, xact_commit AS commit, xact_rollback AS rollback, b
Device: rrqm/s wrqm/s r/s w/s rMB/s wMB/s avgrq-sz avgqu-sz await r_await w_await %util
sda: 0.00 0.00 0.00 0.00 0.00 0.00 0.00 0.00 0.00 0.00 0.00 0.00
sda1: 0.00 0.00 0.00 0.00 0.00 0.00 0.00 0.00 0.00 0.00 0.00 0.00
sda2: 0.00 0.00 0.00 0.00 0.00 0.00 0.00 0.00 0.00 0.00 0.00 0.00
sdb: 0.00 6.86 0.00 288.24 0.00 2.69 19.13 0.82 2.82 0.00 2.82 82.06
sdb1: 0.00 0.00 0.00 0.00 0.00 0.00 0.00 0.00 0.00 0.00 0.00 0.00
sdb2: 0.00 6.86 0.00 284.31 0.00 2.69 19.39 0.11 0.39 0.00 0.39 10.98
dm-0: 0.00 0.00 0.00 0.00 0.00 0.00 0.00 0.00 0.00 0.00 0.00 0.00
dm-1: 0.00 0.00 0.00 0.00 0.00 0.00 0.00 0.00 0.00 0.00 0.00 0.00
dm-2: 0.00 0.00 0.00 293.14 0.00 2.68 18.70 1.66 5.62 0.00 5.62 82.16](https://image.slidesharecdn.com/lesovsky-pg-troubleshooting-with-pgcenter-170526161152/85/Troubleshooting-PostgreSQL-with-pgCenter-9-320.jpg)
![Interface overview01
dataegret.com
pgcenter: 2017-04-05 17:40:28, load average: 1.59, 0.74, 0.42 conn1 [ok]: /run/postgresql:5433 postgres@postg (ver: 10devel, up 2 days 20:29:27)
%cpu: 14.3 us, 3.9 sy, 0.0 ni, 45.8 id, 36.0 wa, 0.0 hi, 0.0 si, 0.0 st activity: 8/100 conns, 0/0 prepared, 1 idle, 0 idle_xact, 2 active, 6 waiting, 0 others
MiB mem: 7836 total, 1582 free, 3910 used, 2344 buff/cached autovacuum: 0/3 workers/max, 0 manual, 0 wraparound, 00:00:00 vac_maxtime
MiB swap: 5119 total, 5088 free, 31 used, 26/0 dirty/writeback statements: 7050 stmt/s, 0.123 stmt_avgtime, 00:00:00 xact_maxtime, 00:00:00 prep_maxtime
user database t_all_t t_read_t t_write_t t_cpu_t all_t read_t write_t cpu_t calls queryid query
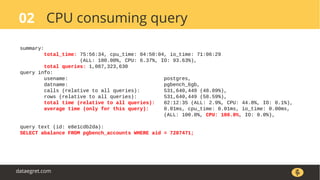
postgres pgbench 00:05:31 00:00:00 00:00:00 00:05:31 510 0 0 510 1006 08393211ce UPDATE pgbench_accounts SET abalance = abalance + $N WHERE aid = $N
postgres pgbench 00:00:09 00:00:00 00:00:00 00:00:09 14 0 0 14 1005 7c5345de88 UPDATE pgbench_branches SET bbalance = bbalance + $N WHERE bid = $N
postgres pgbench 00:00:07 00:00:00 00:00:00 00:00:07 14 0 0 14 1005 2cdaf0baaf UPDATE pgbench_tellers SET tbalance = tbalance + $N WHERE tid = $N
postgres pgbench 00:00:04 00:00:00 00:00:00 00:00:04 10 0 0 10 1005 5f72672d89 SELECT abalance FROM pgbench_accounts WHERE aid = $N
postgres pgbench 00:00:04 00:00:00 00:00:00 00:00:04 0 0 0 0 0 1097fe4e1b copy pgbench_accounts from stdin
postgres pgbench 00:00:03 00:00:00 00:00:00 00:00:03 0 0 0 0 0 3065f1faff SELECT datname, xact_commit AS commit, xact_rollback AS rollback, b
postgres pgbench 00:00:02 00:00:00 00:00:00 00:00:02 7 0 0 7 1005 f1f154154f INSERT INTO pgbench_history (tid, bid, aid, delta, mtime) VALUES ($
postgres postgres 00:00:02 00:00:00 00:00:00 00:00:02 9 0 0 9 1 9f21a96353 SELECT a.rolname AS user, d.datname AS database, date_trunc($N, rou
postgres postgres 00:00:01 00:00:00 00:00:00 00:00:01 0 0 0 0 0 b0cfaf67a8 create database pgbench
postgres postgres 00:00:01 00:00:00 00:00:00 00:00:01 0 0 0 0 0 6441d14dc3 SELECT datname, xact_commit AS commit, xact_rollback AS rollback, b
Device: rrqm/s wrqm/s r/s w/s rMB/s wMB/s avgrq-sz avgqu-sz await r_await w_await %util
sda: 0.00 0.00 0.00 0.00 0.00 0.00 0.00 0.00 0.00 0.00 0.00 0.00
sda1: 0.00 0.00 0.00 0.00 0.00 0.00 0.00 0.00 0.00 0.00 0.00 0.00
sda2: 0.00 0.00 0.00 0.00 0.00 0.00 0.00 0.00 0.00 0.00 0.00 0.00
sdb: 0.00 6.86 0.00 288.24 0.00 2.69 19.13 0.82 2.82 0.00 2.82 82.06
sdb1: 0.00 0.00 0.00 0.00 0.00 0.00 0.00 0.00 0.00 0.00 0.00 0.00
sdb2: 0.00 6.86 0.00 284.31 0.00 2.69 19.39 0.11 0.39 0.00 0.39 10.98
dm-0: 0.00 0.00 0.00 0.00 0.00 0.00 0.00 0.00 0.00 0.00 0.00 0.00
dm-1: 0.00 0.00 0.00 0.00 0.00 0.00 0.00 0.00 0.00 0.00 0.00 0.00
dm-2: 0.00 0.00 0.00 293.14 0.00 2.68 18.70 1.66 5.62 0.00 5.62 82.16](https://image.slidesharecdn.com/lesovsky-pg-troubleshooting-with-pgcenter-170526161152/85/Troubleshooting-PostgreSQL-with-pgCenter-10-320.jpg)
![Interface overview01
dataegret.com
pgcenter: 2017-04-05 17:40:28, load average: 1.59, 0.74, 0.42 conn1 [ok]: /run/postgresql:5433 postgres@postg (ver: 10devel, up 2 days 20:29:27)
%cpu: 14.3 us, 3.9 sy, 0.0 ni, 45.8 id, 36.0 wa, 0.0 hi, 0.0 si, 0.0 st activity: 8/100 conns, 0/0 prepared, 1 idle, 0 idle_xact, 2 active, 6 waiting, 0 others
MiB mem: 7836 total, 1582 free, 3910 used, 2344 buff/cached autovacuum: 0/3 workers/max, 0 manual, 0 wraparound, 00:00:00 vac_maxtime
MiB swap: 5119 total, 5088 free, 31 used, 26/0 dirty/writeback statements: 7050 stmt/s, 0.123 stmt_avgtime, 00:00:00 xact_maxtime, 00:00:00 prep_maxtime
user database t_all_t t_read_t t_write_t t_cpu_t all_t read_t write_t cpu_t calls queryid query
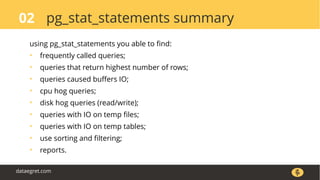
postgres pgbench 00:05:31 00:00:00 00:00:00 00:05:31 510 0 0 510 1006 08393211ce UPDATE pgbench_accounts SET abalance = abalance + $N WHERE aid = $N
postgres pgbench 00:00:09 00:00:00 00:00:00 00:00:09 14 0 0 14 1005 7c5345de88 UPDATE pgbench_branches SET bbalance = bbalance + $N WHERE bid = $N
postgres pgbench 00:00:07 00:00:00 00:00:00 00:00:07 14 0 0 14 1005 2cdaf0baaf UPDATE pgbench_tellers SET tbalance = tbalance + $N WHERE tid = $N
postgres pgbench 00:00:04 00:00:00 00:00:00 00:00:04 10 0 0 10 1005 5f72672d89 SELECT abalance FROM pgbench_accounts WHERE aid = $N
postgres pgbench 00:00:04 00:00:00 00:00:00 00:00:04 0 0 0 0 0 1097fe4e1b copy pgbench_accounts from stdin
postgres pgbench 00:00:03 00:00:00 00:00:00 00:00:03 0 0 0 0 0 3065f1faff SELECT datname, xact_commit AS commit, xact_rollback AS rollback, b
postgres pgbench 00:00:02 00:00:00 00:00:00 00:00:02 7 0 0 7 1005 f1f154154f INSERT INTO pgbench_history (tid, bid, aid, delta, mtime) VALUES ($
postgres postgres 00:00:02 00:00:00 00:00:00 00:00:02 9 0 0 9 1 9f21a96353 SELECT a.rolname AS user, d.datname AS database, date_trunc($N, rou
postgres postgres 00:00:01 00:00:00 00:00:00 00:00:01 0 0 0 0 0 b0cfaf67a8 create database pgbench
postgres postgres 00:00:01 00:00:00 00:00:00 00:00:01 0 0 0 0 0 6441d14dc3 SELECT datname, xact_commit AS commit, xact_rollback AS rollback, b
Device: rrqm/s wrqm/s r/s w/s rMB/s wMB/s avgrq-sz avgqu-sz await r_await w_await %util
sda: 0.00 0.00 0.00 0.00 0.00 0.00 0.00 0.00 0.00 0.00 0.00 0.00
sda1: 0.00 0.00 0.00 0.00 0.00 0.00 0.00 0.00 0.00 0.00 0.00 0.00
sda2: 0.00 0.00 0.00 0.00 0.00 0.00 0.00 0.00 0.00 0.00 0.00 0.00
sdb: 0.00 6.86 0.00 288.24 0.00 2.69 19.13 0.82 2.82 0.00 2.82 82.06
sdb1: 0.00 0.00 0.00 0.00 0.00 0.00 0.00 0.00 0.00 0.00 0.00 0.00
sdb2: 0.00 6.86 0.00 284.31 0.00 2.69 19.39 0.11 0.39 0.00 0.39 10.98
dm-0: 0.00 0.00 0.00 0.00 0.00 0.00 0.00 0.00 0.00 0.00 0.00 0.00
dm-1: 0.00 0.00 0.00 0.00 0.00 0.00 0.00 0.00 0.00 0.00 0.00 0.00
dm-2: 0.00 0.00 0.00 293.14 0.00 2.68 18.70 1.66 5.62 0.00 5.62 82.16](https://image.slidesharecdn.com/lesovsky-pg-troubleshooting-with-pgcenter-170526161152/85/Troubleshooting-PostgreSQL-with-pgCenter-11-320.jpg)
![Interface overview01
dataegret.com
pgcenter: 2017-04-05 17:40:28, load average: 1.59, 0.74, 0.42 conn1 [ok]: /run/postgresql:5433 postgres@postg (ver: 10devel, up 2 days 20:29:27)
%cpu: 14.3 us, 3.9 sy, 0.0 ni, 45.8 id, 36.0 wa, 0.0 hi, 0.0 si, 0.0 st activity: 8/100 conns, 0/0 prepared, 1 idle, 0 idle_xact, 2 active, 6 waiting, 0 others
MiB mem: 7836 total, 1582 free, 3910 used, 2344 buff/cached autovacuum: 0/3 workers/max, 0 manual, 0 wraparound, 00:00:00 vac_maxtime
MiB swap: 5119 total, 5088 free, 31 used, 26/0 dirty/writeback statements: 7050 stmt/s, 0.123 stmt_avgtime, 00:00:00 xact_maxtime, 00:00:00 prep_maxtime
user database t_all_t t_read_t t_write_t t_cpu_t all_t read_t write_t cpu_t calls queryid query
postgres pgbench 00:05:31 00:00:00 00:00:00 00:05:31 510 0 0 510 1006 08393211ce UPDATE pgbench_accounts SET abalance = abalance + $N WHERE aid = $N
postgres pgbench 00:00:09 00:00:00 00:00:00 00:00:09 14 0 0 14 1005 7c5345de88 UPDATE pgbench_branches SET bbalance = bbalance + $N WHERE bid = $N
postgres pgbench 00:00:07 00:00:00 00:00:00 00:00:07 14 0 0 14 1005 2cdaf0baaf UPDATE pgbench_tellers SET tbalance = tbalance + $N WHERE tid = $N
postgres pgbench 00:00:04 00:00:00 00:00:00 00:00:04 10 0 0 10 1005 5f72672d89 SELECT abalance FROM pgbench_accounts WHERE aid = $N
postgres pgbench 00:00:04 00:00:00 00:00:00 00:00:04 0 0 0 0 0 1097fe4e1b copy pgbench_accounts from stdin
postgres pgbench 00:00:03 00:00:00 00:00:00 00:00:03 0 0 0 0 0 3065f1faff SELECT datname, xact_commit AS commit, xact_rollback AS rollback, b
postgres pgbench 00:00:02 00:00:00 00:00:00 00:00:02 7 0 0 7 1005 f1f154154f INSERT INTO pgbench_history (tid, bid, aid, delta, mtime) VALUES ($
postgres postgres 00:00:02 00:00:00 00:00:00 00:00:02 9 0 0 9 1 9f21a96353 SELECT a.rolname AS user, d.datname AS database, date_trunc($N, rou
postgres postgres 00:00:01 00:00:00 00:00:00 00:00:01 0 0 0 0 0 b0cfaf67a8 create database pgbench
postgres postgres 00:00:01 00:00:00 00:00:00 00:00:01 0 0 0 0 0 6441d14dc3 SELECT datname, xact_commit AS commit, xact_rollback AS rollback, b
Device: rrqm/s wrqm/s r/s w/s rMB/s wMB/s avgrq-sz avgqu-sz await r_await w_await %util
sda: 0.00 0.00 0.00 0.00 0.00 0.00 0.00 0.00 0.00 0.00 0.00 0.00
sda1: 0.00 0.00 0.00 0.00 0.00 0.00 0.00 0.00 0.00 0.00 0.00 0.00
sda2: 0.00 0.00 0.00 0.00 0.00 0.00 0.00 0.00 0.00 0.00 0.00 0.00
sdb: 0.00 6.86 0.00 288.24 0.00 2.69 19.13 0.82 2.82 0.00 2.82 82.06
sdb1: 0.00 0.00 0.00 0.00 0.00 0.00 0.00 0.00 0.00 0.00 0.00 0.00
sdb2: 0.00 6.86 0.00 284.31 0.00 2.69 19.39 0.11 0.39 0.00 0.39 10.98
dm-0: 0.00 0.00 0.00 0.00 0.00 0.00 0.00 0.00 0.00 0.00 0.00 0.00
dm-1: 0.00 0.00 0.00 0.00 0.00 0.00 0.00 0.00 0.00 0.00 0.00 0.00
dm-2: 0.00 0.00 0.00 293.14 0.00 2.68 18.70 1.66 5.62 0.00 5.62 82.16](https://image.slidesharecdn.com/lesovsky-pg-troubleshooting-with-pgcenter-170526161152/85/Troubleshooting-PostgreSQL-with-pgCenter-12-320.jpg)

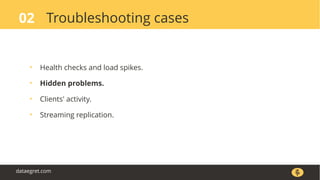
![Health checks and load spikes02
dataegret.com
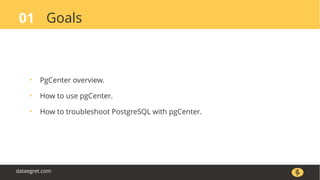
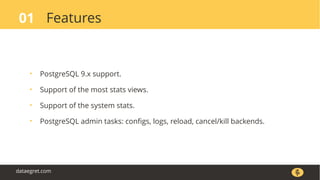
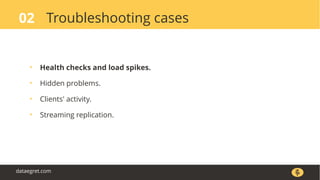
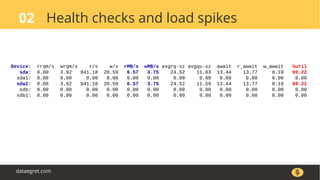
pgcenter: 2017-04-07 21:50:36, load average: 4.14, 0.98, 0.46 conn1 [ok]: /var/run/postgresql:5432 postgres@p (ver: 9.6.2, up 1 day 04:02:57)
%cpu: 2.9 us, 0.7 sy, 0.0 ni, 11.4 id, 85.0 wa, 0.0 hi, 0.0 si, 0.0 st activity: 13/100 conns, 0/0 prepared, 0 idle, 0 idle_xact, 13 active, 0 waiting, 0 others
MiB mem: 32124 total, 6228 free, 25464 used, 432 buff/cached autovacuum: 0/3 workers/max, 0 manual, 0 wraparound, 00:00:00 vac_maxtime
MiB swap: 15257 total, 15257 free, 0 used, 1/0 dirty/writeback statements: 3519 stmt/s, 0.263 stmt_avgtime, 00:00:00 xact_maxtime, 00:00:00 prep_maxtime
datname commit rollback reads hits returned fetched inserts updates deletes conflicts deadlocks tmp_files tmp_bytes read_t write_t
pgbench_64gb 0 0 0 0 0 0 0 0 0 0 0 0 0 0 0
pgbench_6gb 2 0 0 69 999 11 0 0 0 0 0 0 0 0 0
postgres 6 0 0 0 0 0 0 0 0 0 0 0 0 0 0
template0 0 0 0 0 0 0 0 0 0 0 0 0 0 0 0
Device: rrqm/s wrqm/s r/s w/s rMB/s wMB/s avgrq-sz avgqu-sz await r_await w_await %util
sda: 0.00 3.92 841.18 20.59 6.57 3.75 24.52 11.63 13.44 13.77 0.19 99.22
sda1: 0.00 0.00 0.00 0.00 0.00 0.00 0.00 0.00 0.00 0.00 0.00 0.00
sda2: 0.00 3.92 841.18 20.59 6.57 3.75 24.52 11.59 13.44 13.77 0.19 99.22
sdb: 0.00 0.00 0.00 0.00 0.00 0.00 0.00 0.00 0.00 0.00 0.00 0.00
sdb1: 0.00 0.00 0.00 0.00 0.00 0.00 0.00 0.00 0.00 0.00 0.00 0.00](https://image.slidesharecdn.com/lesovsky-pg-troubleshooting-with-pgcenter-170526161152/85/Troubleshooting-PostgreSQL-with-pgCenter-19-320.jpg)
![Health checks and load spikes02
dataegret.com
conn1 [ok]: /var/run/postgresql:5432 postgres@p (ver: 9.6.2, up 1 day 04:02:57)
activity: 13/100 conns, 0/0 prepared, 0 idle, 0 idle_xact, 13 active, 0 waiting, 0 others
autovacuum: 0/3 workers/max, 0 manual, 0 wraparound, 00:00:00 vac_maxtime
statements: 3519 stmt/s, 0.263 stmt_avgtime, 00:00:00 xact_maxtime, 00:00:00 prep_maxtime
s deletes conflicts deadlocks tmp_files tmp_bytes read_t write_t
0 0 0 0 0 0 0
0 0 0 0 0 0 0
0 0 0 0 0 0 0
0 0 0 0 0 0 0](https://image.slidesharecdn.com/lesovsky-pg-troubleshooting-with-pgcenter-170526161152/85/Troubleshooting-PostgreSQL-with-pgCenter-21-320.jpg)
![Health checks and load spikes02
dataegret.com
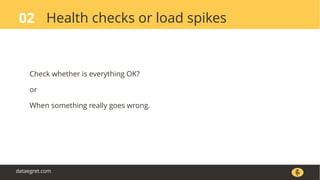
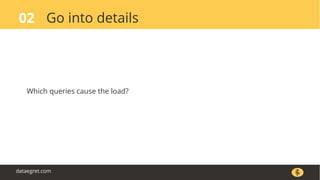
pgcenter: 2017-04-07 21:50:36, load average: 4.14, 0.98, 0.46 conn1 [ok]: /var/run/postgresql:5432 postgres@p (ver: 9.6.2, up 1 day 04:02:57)
%cpu: 2.9 us, 0.7 sy, 0.0 ni, 11.4 id, 85.0 wa, 0.0 hi, 0.0 si, 0.0 st activity: 13/100 conns, 0/0 prepared, 0 idle, 0 idle_xact, 13 active, 0 waiting, 0 others
MiB mem: 32124 total, 6228 free, 25464 used, 432 buff/cached autovacuum: 0/3 workers/max, 0 manual, 0 wraparound, 00:00:00 vac_maxtime
MiB swap: 15257 total, 15257 free, 0 used, 1/0 dirty/writeback statements: 3519 stmt/s, 0.263 stmt_avgtime, 00:00:00 xact_maxtime, 00:00:00 prep_maxtime
user database t_all_t t_read_t t_write_t t_cpu_t all_t read_t write_t cpu_t calls queryid query
postgres pgbench_64gb 47:38:04 47:33:07 00:00:00 00:04:57 7868 7855 0 12 405 94ffafcb30 UPDATE pgbench_accounts SET abalance = abalance + ? WHERE aid =
postgres pgbench_64gb 23:51:51 23:48:08 00:00:00 00:03:42 5 0 0 6 405 111df3ad65 SELECT abalance FROM pgbench_accounts WHERE aid = ?;
postgres pgbench_6gb 02:14:23 00:02:45 00:00:00 02:11:38 0 0 0 0 0 e8e1cdb2da SELECT abalance FROM pgbench_accounts WHERE aid = 7287471;
postgres pgbench_64gb 00:01:31 00:00:18 00:00:00 00:01:13 6 0 0 6 405 45b6b13d62 UPDATE pgbench_tellers SET tbalance = tbalance + ? WHERE tid = ?
postgres pgbench_6gb 01:07:36 00:00:16 00:00:00 01:07:19 0 0 0 0 0 192353e099 UPDATE pgbench_accounts SET abalance = abalance + ? WHERE aid =
postgres pgbench_64gb 00:01:22 00:00:08 00:00:00 00:01:13 6 0 0 6 405 e192b43faf UPDATE pgbench_branches SET bbalance = bbalance + ? WHERE bid =
okagent pgbench_6gb 00:00:00 00:00:00 00:00:00 00:00:00 0 0 0 0 0 f67e66660a select * from pg_stat_user_tables s limit ?
postgres pgbench_6gb 00:00:00 00:00:00 00:00:00 00:00:00 0 0 0 0 0 f6241e76ed vacuum pgbench_branches
postgres pgbench_64gb 00:00:00 00:00:00 00:00:00 00:00:00 0 0 0 0 0 eaf8d3d459 truncate pgbench_history
postgres pgbench_64gb 00:00:42 00:00:00 00:00:00 00:00:42 4 0 0 3 405 e7cc060768 INSERT INTO pgbench_history (tid, bid, aid, delta, mtime) VALUES
postgres pgbench_6gb 00:30:17 00:00:00 00:00:00 00:30:17 0 0 0 0 0 e7766dd7c6 UPDATE pgbench_branches SET bbalance = bbalance + ? WHERE bid =
okagent pgbench_64gb 00:00:02 00:00:00 00:00:00 00:00:02 0 0 0 0 0 de77700d35 SELECT schemaname, relname, indexrelname, coalesce(pg_relation_
okagent pgbench_64gb 00:00:02 00:00:00 00:00:00 00:00:02 0 0 0 0 0 d1bcc9180b SELECT schemaname, relname, coalesce(heap_blks_read,?) as heap_
postgres pgbench_64gb 00:00:00 00:00:00 00:00:00 00:00:00 0 0 0 0 0 d101ae1052 vacuum pgbench_branches](https://image.slidesharecdn.com/lesovsky-pg-troubleshooting-with-pgcenter-170526161152/85/Troubleshooting-PostgreSQL-with-pgCenter-25-320.jpg)
![Health checks and load spikes02
dataegret.com
oad average: 4.14, 0.98, 0.46 conn1 [ok]: /var/run/postgresql:5432 postgres@p (ver: 9.6.2, up 1 day 04:02:57)
ni, 11.4 id, 85.0 wa, 0.0 hi, 0.0 si, 0.0 st activity: 13/100 conns, 0/0 prepared, 0 idle, 0 idle_xact, 13 active, 0 waiting, 0 others
ree, 25464 used, 432 buff/cached autovacuum: 0/3 workers/max, 0 manual, 0 wraparound, 00:00:00 vac_maxtime
ree, 0 used, 1/0 dirty/writeback statements: 3519 stmt/s, 0.263 stmt_avgtime, 00:00:00 xact_maxtime, 00:00:00 prep_maxtime
t_read_t t_write_t t_cpu_t all_t read_t write_t cpu_t calls queryid query
47:33:07 00:00:00 00:04:57 7868 7855 0 12 405 94ffafcb30 UPDATE pgbench_accounts SET abalance = abalance + ? WHERE aid =
23:48:08 00:00:00 00:03:42 5 0 0 6 405 111df3ad65 SELECT abalance FROM pgbench_accounts WHERE aid = ?;
00:02:45 00:00:00 02:11:38 0 0 0 0 0 e8e1cdb2da SELECT abalance FROM pgbench_accounts WHERE aid = 7287471;
00:00:18 00:00:00 00:01:13 6 0 0 6 405 45b6b13d62 UPDATE pgbench_tellers SET tbalance = tbalance + ? WHERE tid = ?
00:00:16 00:00:00 01:07:19 0 0 0 0 0 192353e099 UPDATE pgbench_accounts SET abalance = abalance + ? WHERE aid =
00:00:08 00:00:00 00:01:13 6 0 0 6 405 e192b43faf UPDATE pgbench_branches SET bbalance = bbalance + ? WHERE bid =
00:00:00 00:00:00 00:00:00 0 0 0 0 0 f67e66660a select * from pg_stat_user_tables s limit ?
00:00:00 00:00:00 00:00:00 0 0 0 0 0 f6241e76ed vacuum pgbench_branches
00:00:00 00:00:00 00:00:00 0 0 0 0 0 eaf8d3d459 truncate pgbench_history
00:00:00 00:00:00 00:00:42 4 0 0 3 405 e7cc060768 INSERT INTO pgbench_history (tid, bid, aid, delta, mtime) VALUES
00:00:00 00:00:00 00:30:17 0 0 0 0 0 e7766dd7c6 UPDATE pgbench_branches SET bbalance = bbalance + ? WHERE bid =
00:00:00 00:00:00 00:00:02 0 0 0 0 0 de77700d35 SELECT schemaname, relname, indexrelname, coalesce(pg_relation_
00:00:00 00:00:00 00:00:02 0 0 0 0 0 d1bcc9180b SELECT schemaname, relname, coalesce(heap_blks_read,?) as heap_
00:00:00 00:00:00 00:00:00 0 0 0 0 0 d101ae1052 vacuum pgbench_branches](https://image.slidesharecdn.com/lesovsky-pg-troubleshooting-with-pgcenter-170526161152/85/Troubleshooting-PostgreSQL-with-pgCenter-26-320.jpg)
![Health checks and load spikes02
dataegret.com
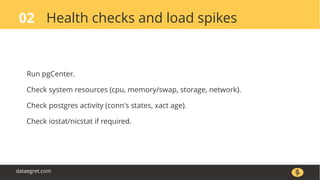
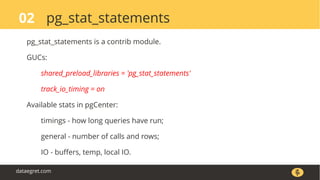
pgcenter: 2017-04-07 21:52:54, load average: 10.65, 4.65, 1.89 conn1 [ok]: /var/run/postgresql:5432 postgres@p (ver: 9.6.2, up 1 day 04:05:15)
%cpu: 77.4 us, 9.6 sy, 0.0 ni, 12.9 id, 0.0 wa, 0.0 hi, 0.0 si, 0.0 st activity: 73/100 conns, 0/0 prepared, 12 idle, 0 idle_xact, 61 active, 0 waiting, 0 others
MiB mem: 32124 total, 215 free, 25469 used, 6440 buff/cached autovacuum: 0/3 workers/max, 0 manual, 0 wraparound, 00:00:00 vac_maxtime
MiB swap: 15257 total, 15257 free, 0 used, 0/0 dirty/writeback statements: 76074 stmt/s, 0.263 stmt_avgtime, 00:00:00 xact_maxtime, 00:00:00 prep_maxtime
user database t_all_t t_read_t t_write_t t_cpu_t all_t read_t write_t cpu_t calls queryid query
postgres pgbench_6gb 02:14:30 00:02:45 00:00:00 02:11:45 909 0 0 909 63551 e8e1cdb2da SELECT abalance FROM pgbench_accounts WHERE aid = 7287471;
postgres pgbench_6gb 01:07:36 00:00:16 00:00:00 01:07:19 0 0 0 0 0 192353e099 UPDATE pgbench_accounts SET abalance = abalance + ? WHERE aid =
postgres pgbench_6gb 00:30:17 00:00:00 00:00:00 00:30:17 0 0 0 0 0 e7766dd7c6 UPDATE pgbench_branches SET bbalance = bbalance + ? WHERE bid =
postgres pgbench_6gb 00:29:07 00:00:00 00:00:00 00:29:07 0 0 0 0 0 5372cff023 UPDATE pgbench_tellers SET tbalance = tbalance + ? WHERE tid = ?
postgres pgbench_6gb 00:16:05 00:00:00 00:00:00 00:16:05 0 0 0 0 0 7a4d34a918 INSERT INTO pgbench_history (tid, bid, aid, delta, mtime) VALUES
postgres pgbench_64gb 47:40:16 47:35:18 00:00:00 00:04:57 0 0 0 0 0 94ffafcb30 UPDATE pgbench_accounts SET abalance = abalance + ? WHERE aid =
postgres pgbench_64gb 23:51:51 23:48:08 00:00:00 00:03:42 0 0 0 0 0 111df3ad65 SELECT abalance FROM pgbench_accounts WHERE aid = ?;
postgres pgbench_64gb 00:01:22 00:00:08 00:00:00 00:01:13 0 0 0 0 0 e192b43faf UPDATE pgbench_branches SET bbalance = bbalance + ? WHERE bid =
postgres pgbench_64gb 00:01:31 00:00:18 00:00:00 00:01:13 0 0 0 0 0 45b6b13d62 UPDATE pgbench_tellers SET tbalance = tbalance + ? WHERE tid = ?
postgres pgbench_64gb 00:00:42 00:00:00 00:00:00 00:00:42 0 0 0 0 0 e7cc060768 INSERT INTO pgbench_history (tid, bid, aid, delta, mtime) VALUES
postgres pgbench_6gb 00:00:41 00:00:00 00:00:00 00:00:41 0 0 0 0 0 7cbfcd7045 END;
postgres pgbench_6gb 00:00:35 00:00:00 00:00:00 00:00:35 0 0 0 0 0 250dbbb915 BEGIN;
Device: rrqm/s wrqm/s r/s w/s rMB/s wMB/s avgrq-sz avgqu-sz await r_await w_await %util
sda: 0.00 0.00 0.00 28.71 0.00 0.22 16.00 0.00 0.00 0.00 0.00 0.00
sda1: 0.00 0.00 0.00 0.00 0.00 0.00 0.00 0.00 0.00 0.00 0.00 0.00
sda2: 0.00 0.00 0.00 28.71 0.00 0.22 16.00 0.00 0.00 0.00 0.00 0.00
sdb: 0.00 0.99 17.82 0.00 0.15 0.00 16.89 0.00 0.22 0.22 0.00 0.40
sdb1: 0.00 0.99 17.82 0.00 0.15 0.00 16.89 0.00 0.22 0.22 0.00 0.40](https://image.slidesharecdn.com/lesovsky-pg-troubleshooting-with-pgcenter-170526161152/85/Troubleshooting-PostgreSQL-with-pgCenter-28-320.jpg)
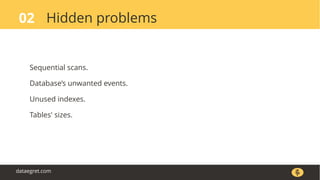
![Sequential scans02
dataegret.com
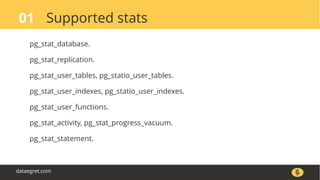
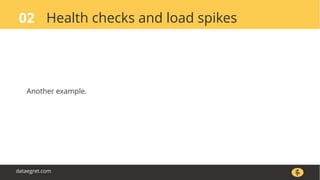
pgcenter: 2017-04-08 11:10:14, load average: 3.09, 1.03, 0.37 conn1 [ok]: /var/run/postgresql:5432
%cpu: 91.8 us, 0.2 sy, 0.0 ni, 8.0 id, 0.0 wa, 0.0 hi, 0.0 si, 0.0 st activity: 12/100 conns, 0/0 prepa
MiB mem: 32124 total, 291 free, 25471 used, 6362 buff/cached autovacuum: 0/3 workers/max, 0 man
MiB swap: 15257 total, 15257 free, 0 used, 0/0 dirty/writeback statements: 0 stmt/s, 0.000 stmt_a
relation seq_scan seq_read idx_scan idx_fetch inserts updates deletes hot_updates live dead
public.ycsb_metrics 43 43000000 129 4397052 0 0 0 0 0 0
public.pgbench_tellers 0 0 0 0 0 0 0 0 0 0
public.pgbench_history 0 0 0 0 0 0 0 0 0 0
public.pgbench_branches 0 0 0 0 0 0 0 0 0 0
public.pgbench_accounts 0 0 0 0 0 0 0 0 0 0](https://image.slidesharecdn.com/lesovsky-pg-troubleshooting-with-pgcenter-170526161152/85/Troubleshooting-PostgreSQL-with-pgCenter-36-320.jpg)
![Sequential scans02
dataegret.com
pgcenter: 2017-04-08 11:10:50, load average: 6.73, 2.17, 0.78 conn1 [ok]: /var/run/postgresql:5432
%cpu: 91.6 us, 0.2 sy, 0.0 ni, 8.3 id, 0.0 wa, 0.0 hi, 0.0 si, 0.0 st activity: 12/100 conns, 0/0 prepa
MiB mem: 32124 total, 290 free, 25471 used, 6363 buff/cached autovacuum: 0/3 workers/max, 0 man
MiB swap: 15257 total, 15257 free, 0 used, 0/0 dirty/writeback statements: 0 stmt/s, 0.000 stmt_a
relation heap_read heap_hit idx_read idx_hit toast_read toast_hit tidx_read tidx_hit
public.ycsb_metrics 0 7675872 0 93752 0 0 0 0
public.pgbench_tellers 0 0 0 0 0 0 0 0
public.pgbench_history 0 0 0 0 0 0 0 0
public.pgbench_branches 0 0 0 0 0 0 0 0
public.pgbench_accounts 0 0 0 0 0 0 0 0](https://image.slidesharecdn.com/lesovsky-pg-troubleshooting-with-pgcenter-170526161152/85/Troubleshooting-PostgreSQL-with-pgCenter-37-320.jpg)
![Sequential scans02
dataegret.com
pgcenter: 2017-04-08 11:13:02, load average: 10.66, 5.43, 2.18 conn1 [ok]: /var/run/postgresql:5432 postgres@p (ver: 9.6.2, up 1 day
%cpu: 91.9 us, 0.3 sy, 0.0 ni, 7.8 id, 0.0 wa, 0.0 hi, 0.0 si, 0.0 st activity: 12/100 conns, 0/0 prepared, 0 idle, 0 idle_xact, 12 active,
MiB mem: 32124 total, 286 free, 25475 used, 6363 buff/cached autovacuum: 0/3 workers/max, 0 manual, 0 wraparound, 00:00:00
MiB swap: 15257 total, 15257 free, 0 used, 0/0 dirty/writeback statements: 160 stmt/s, 0.253 stmt_avgtime, 00:00:00 xact_maxtime, 00:00:00
user database t_calls t_rows calls rows queryid query
postgres pgbench_6gb 11191 11186446 38 38292 3702386801 select id,inserted_at,severity,payload from ycsb_metrics where ycsb_sensor = ?;
postgres pgbench_6gb 11220 1122000 38 3800 e55c44ee4a select id,ycsb_sensor,extra1 from ycsb_metrics where severity = ? order by inserted_at
postgres pgbench_6gb 11221 1122010 38 3800 18d47af42e select id,inserted_at,severity,payload,extra1,extra2,extra3 from ycsb_metrics where
postgres pgbench_6gb 54 6425 1 119 3cadff41ef SELECT a.rolname AS user, d.datname AS database, sum(p.calls) AS t_calls, sum(p.rows)
postgres pgbench_6gb 11224 11224 39 39 65087e0adb select ycsb_sensor,inserted_at,severity,payload from ycsb_metrics where id = ?;](https://image.slidesharecdn.com/lesovsky-pg-troubleshooting-with-pgcenter-170526161152/85/Troubleshooting-PostgreSQL-with-pgCenter-38-320.jpg)
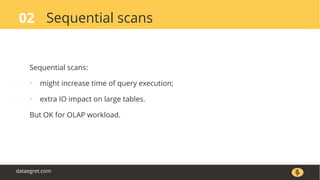
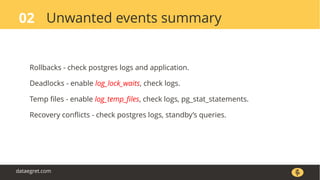
![Unwanted events02
dataegret.com
pgcenter: 2017-04-08 11:40:07, load average: 10.56, 4.80, 2.28 conn1 [ok]: /var/run/postgresql:5432 postgres@p (ver: 9.6.2, up 1 day
%cpu: 91.9 us, 2.6 sy, 0.0 ni, 5.5 id, 0.0 wa, 0.0 hi, 0.0 si, 0.0 st activity: 12/100 conns, 0/0 prepared, 7 idle, 0 idle_xact, 5 active,
MiB mem: 32124 total, 267 free, 25475 used, 6382 buff/cached autovacuum: 0/3 workers/max, 0 manual, 0 wraparound, 00:00:00
MiB swap: 15257 total, 15257 free, 0 used, 0/0 dirty/writeback statements: 3535 stmt/s, 0.255 stmt_avgtime, 00:00:00 xact_maxtime,
datname commit rollback reads hits returned fetched inserts updates deletes conflicts deadlocks tmp_files tmp_bytes read_t write_t
pgbench_64gb 0 0 0 0 0 0 0 0 0 0 0 0 0 0 0
pgbench_6gb 154 37 0 918112 40826627 3826627 22 1 0 0 0 0 0 0 0
postgres 0 0 0 0 0 0 0 0 0 0 0 0 0 0 0
template0 2 0 0 69 978 11 0 0 0 0 0 0 0 0 0
template1 0 0 0 0 0 0 0 0 0 0 0 0 0 0 0](https://image.slidesharecdn.com/lesovsky-pg-troubleshooting-with-pgcenter-170526161152/85/Troubleshooting-PostgreSQL-with-pgCenter-40-320.jpg)
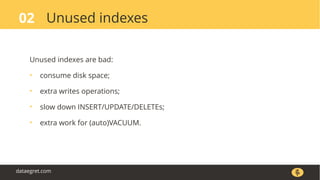
![Unused indexes02
dataegret.com
pgcenter: 2017-04-08 11:45:20, load average: 0.09, 2.08, 1.87 conn1 [ok]: /var/run/postgresql:5432 postgre
%cpu: 0.2 us, 0.0 sy, 0.0 ni, 99.8 id, 0.0 wa, 0.0 hi, 0.0 si, 0.0 st activity: 1/100 conns, 0/0 prepared, 0
MiB mem: 32124 total, 282 free, 25462 used, 6380 buff/cached autovacuum: 0/3 workers/max, 0 manual, 0
MiB swap: 15257 total, 15257 free, 0 used, 0/0 dirty/writeback statements: 6 stmt/s, 0.255 stmt_avgtime,
relation index idx_scan idx_tup_read idx_tup_fetch idx_read idx_hit
public.ycsb_metrics ycsb_metrics_ycsb_sensor_idx 0 0 0 0 0
public.ycsb_metrics ycsb_metrics_severity_idx 0 0 0 0 0
public.ycsb_metrics ycsb_metrics_pkey 0 0 0 0 0
public.ycsb_metrics ycsb_metrics_inserted_at_idx 0 0 0 0 0
public.pgbench_tellers pgbench_tellers_pkey 0 0 0 0 0
public.pgbench_branches pgbench_branches_pkey 0 0 0 0 0
public.pgbench_accounts pgbench_accounts_pkey 0 0 0 0 0](https://image.slidesharecdn.com/lesovsky-pg-troubleshooting-with-pgcenter-170526161152/85/Troubleshooting-PostgreSQL-with-pgCenter-43-320.jpg)
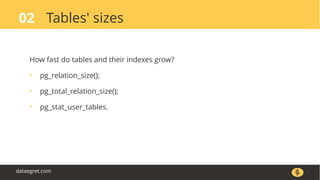
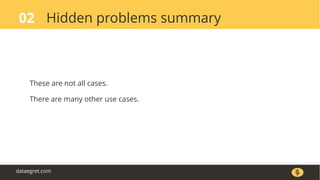
![Clients' activity02
dataegret.com
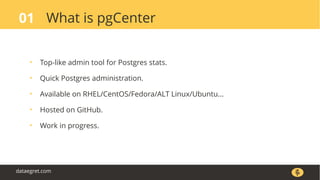
pgcenter: 2017-04-08 14:02:32, load average: 12.65, 10.19, 5.50 conn1 [ok]: /var/run/postgresql:5432 postgres@p (ver: 9.6.2, up 1 day 20:14:53)
%cpu: 69.0 us, 10.5 sy, 0.0 ni, 20.3 id, 0.2 wa, 0.0 hi, 0.0 si, 0.0 st activity: 11/100 conns, 0/0 prepared, 0 idle, 0 idle_xact, 11 active, 3 waiting, 0 others
MiB mem: 32124 total, 224 free, 25466 used, 6434 buff/cached autovacuum: 0/3 workers/max, 0 manual, 0 wraparound, 00:00:00 vac_maxtime
MiB swap: 15257 total, 15257 free, 0 used, 1/0 dirty/writeback statements: 80598 stmt/s, 0.246 stmt_avgtime, 00:00:00 xact_maxtime, 00:00:00 prep_maxtime
pid cl_addr cl_port datname usename state wait_etype wait_event xact_age query_age change_age query
21304 -1 pgbench_6gb postgres active 00:00:00 00:00:00 00:00:00 UPDATE pgbench_accounts SET abalance = abalance + 2099 WH
21303 -1 pgbench_6gb postgres active 00:00:00 00:00:00 00:00:00 UPDATE pgbench_accounts SET abalance = abalance + 1822 WH
21302 -1 pgbench_6gb postgres active 00:00:00 00:00:00 00:00:00 UPDATE pgbench_accounts SET abalance = abalance + 1989 WH
21301 -1 pgbench_6gb postgres active 00:00:00 00:00:00 00:00:00 UPDATE pgbench_accounts SET abalance = abalance + 2305 WH
21300 -1 pgbench_6gb postgres active LWLockNamed XidGenLock 00:00:00 00:00:00 00:00:00 UPDATE pgbench_accounts SET abalance = abalance + 762 WHE
21299 -1 pgbench_6gb postgres active 00:00:00 00:00:00 00:00:00 UPDATE pgbench_accounts SET abalance = abalance + 771 WHE
21298 -1 pgbench_6gb postgres active LWLockTranche buffer_content 00:00:00 00:00:00 00:00:00 UPDATE pgbench_accounts SET abalance = abalance + 4219 WH
21297 -1 pgbench_6gb postgres active 00:00:00 00:00:00 00:00:00 UPDATE pgbench_accounts SET abalance = abalance + -2077 W
21296 -1 pgbench_6gb postgres active 00:00:00 00:00:00 00:00:00 UPDATE pgbench_accounts SET abalance = abalance + -2311 W
21295 -1 pgbench_6gb postgres active LWLockNamed XidGenLock 00:00:00 00:00:00 00:00:00 UPDATE pgbench_accounts SET abalance = abalance + 4555 WH](https://image.slidesharecdn.com/lesovsky-pg-troubleshooting-with-pgcenter-170526161152/85/Troubleshooting-PostgreSQL-with-pgCenter-49-320.jpg)
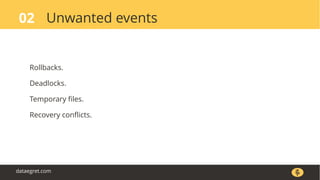
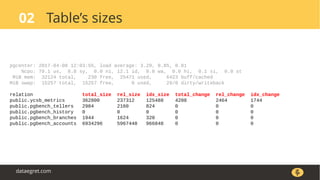
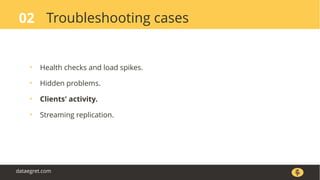
![pg_stat_replication & co02
dataegret.com
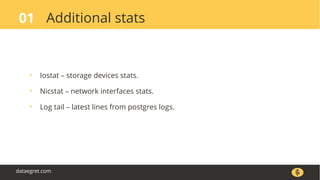
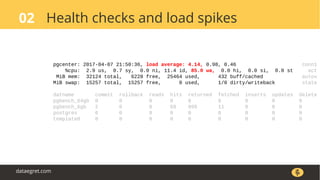
pgcenter: 2017-04-08 14:13:49, load average: 0.04, 3.10, 4.61 conn1 [ok]: /var/run/postgresql:5432 postgres@p
%cpu: 0.0 us, 0.1 sy, 0.0 ni, 99.9 id, 0.0 wa, 0.0 hi, 0.0 si, 0.0 st activity: 1/100 conns, 0/0 prepared, 0 idle,
MiB mem: 32124 total, 232 free, 25461 used, 6431 buff/cached autovacuum: 0/3 workers/max, 0 manual, 0 wra
MiB swap: 15257 total, 15257 free, 0 used, 0/0 dirty/writeback statements: 6 stmt/s, 0.241 stmt_avgtime, 00:
client user name state mode xlog pending write flush replay total_lag xact_age time_age
10.6.6.9 replica walreceiver streaming async 2485 0 0 0 410480 410480 524824 00:02:14
10.6.6.7 replica walreceiver streaming async 2485 0 0 0 0 0
10.6.6.6 replica walreceiver streaming async 2485 0 0 0 128 128 14 00:00:01](https://image.slidesharecdn.com/lesovsky-pg-troubleshooting-with-pgcenter-170526161152/85/Troubleshooting-PostgreSQL-with-pgCenter-53-320.jpg)


PgCenter is a tool for monitoring and troubleshooting PostgreSQL. It provides a graphical interface to view key performance metrics and statuses. Some of its main features include displaying server health, load, memory and disk usage, statement performance, replication status and more. It aims to help PostgreSQL administrators quickly check the health of their databases and identify potential problems.