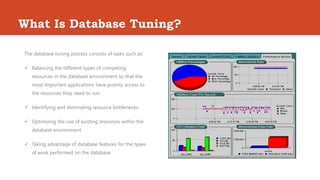
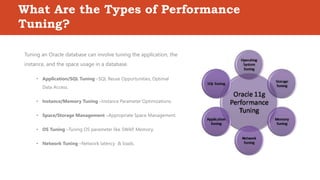
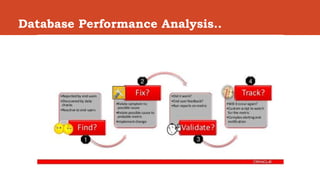
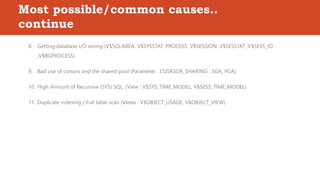
The document discusses Oracle database performance tuning. It covers identifying and resolving performance issues through tools like AWR and ASH reports. Common causes of performance problems include wait events, old statistics, incorrect execution plans, and I/O issues. The document recommends collecting specific data when analyzing problems and provides references and scripts for further tuning tasks.
4. What Is Database Tuning?
The database tuning process consists of tasks such as:
Balancing the different types of competing
resources in the database environment so that the
most important applications have priority access to
the resources they need to run.
Identifying and eliminating resource bottlenecks.
Optimizing the use of existing resources within the
database environment.
Taking advantage of database features for the types
of work performed on the database.
5. What Are the Types of Performance
Tuning?
Tuning an Oracle database can involve tuning the application, the
instance, and the space usage in a database.
• Application/SQL Tuning –SQL Reuse Opportunities, Optimal
Data Access.
• Instance/Memory Tuning –Instance Parameter Optimizations.
• Space/Storage Management –Appropriate Space Management.
• OS Tuning –Tuning OS parameter like SWAP, Memory.
• Network Tuning –Network latency & loads.
7. What data needs to be collect
1. Since when you are facing this slowness issue ?
2. Is the slowness persistent or does it varies based on the time of the day?
3. Is it happening with any specific user/s or across the globe ?
4. Is the complete application slow or issue with any specific module/operation/job ?
5. If it is with any specific module/operation/job then what queries are associated with this ? What actually it does ?
6. if its query specific, do we have the explain plan when it was working fine?
7. Is it newly added or old module/operation/job ?
8. What is its previous completion/response time ?
9. What is the current completion/response time ?
8. What data needs to be collect
10. Is there any changes happened at application/database/server level in recent past? If yes what kind of changes done ?
11. Is only one job/query slow or the entire database slow:
12. List of all tables used in your job:
13. Good Time (1 hour duration when the job was running fine):
14. Bad time (1 hour duration when the job was running the slowest):
15. After when has the issue started occurring, any particular date or database change or event ?
16. Will you be able to replicate the issue on the database at our will ?
17. Any select queries you can provide which are running slow ?
18. Have you connected with any other team. If yes, any findings from their side ?
10. Query Processing..
Oracle 10g+ uses something called the CBO (Cost-Based Optimizer) which determines the most efficient way to execute a
SQL statement after considering many factors related to the objects referenced and the conditions specified in the query.
This determination is an important step in the processing of any SQL statement and can greatly affect execution time.
A SQL statement can be executed in many different ways, including the following:
Full table scans
Index scans
Nested loops
Hash joins
The output from the optimizer is a plan that describes an optimum method of execution. The CBO formulates this plan
based on statistics. A combination of correct index-usage and decent statistics is key for well-performing queries.
Sometimes the CBO can make decisions that seem incorrect — this may be as a result of stale or inaccurate statistics.
11. Locating Slow Queries
Finding the guilty SQL is the first step in solving the issue. There are many approaches to this. Chances are if you
have a performance problem you already know the offending SQL.
The following are some simple ways of finding resource-intensive SQL.
1. Obtaining the Execution Plan
2. Enterprise Manager
3. AWR Views
4. ASH Reports
5. Real Time SQL Monitoring(SQL Trace)
12. Xplan for SQL
Plan hash value: 454993881
--------------------------------------------------------------------------------------------
| Id | Operation | Name | Rows | Bytes | Cost (%CPU)| Time |
--------------------------------------------------------------------------------------------
| 0 | SELECT STATEMENT | | 2 | 176 | 13 (16)| 00:00:01 |
| 1 | NESTED LOOPS | | 2 | 176 | 13 (16)| 00:00:01 |
|* 2 | HASH JOIN | | 1 | 65 | 11 (19)| 00:00:01 |
|* 3 | TABLE ACCESS FULL | PS_DEPT_TBL | 330 | 14850 | 6 (0)| 00:00:01 |
| 4 | VIEW | VW_SQ_1 | 660 | 13200 | 4 (25)| 00:00:01 |
| 5 | HASH GROUP BY | | 660 | 13860 | 4 (25)| 00:00:01 |
|* 6 | INDEX FAST FULL SCAN | PS1DEPT_TBL | 660 | 13860 | 3 (0)| 00:00:01 |
| 7 | TABLE ACCESS BY INDEX ROWID| PS_NAMES | 2 | 46 | 2 (0)| 00:00:01 |
|* 8 | INDEX RANGE SCAN | PS_NAMES | 2 | | 1 (0)| 00:00:01 |
--------------------------------------------------------------------------------------------
Predicate Information (identified by operation id):
---------------------------------------------------
2 - access("D"."EFFDT"="VW_COL_1" AND SYS_OP_DESCEND("D"."EFFDT")=SYS_OP_DESCEND(
"VW_COL_1") AND "SETID"="D"."SETID" AND "DEPTID"="D"."DEPTID")
3 - filter("D"."EFF_STATUS"='A')
6 - filter(SYS_OP_UNDESCEND(SYS_OP_DESCEND("EFFDT"))<=SYSDATE@! AND
SYS_OP_DESCEND("EFFDT")>=SYS_OP_DESCEND(SYSDATE@!))
8 - access("N"."EMPLID"="D"."MANAGER_ID")
13. Xplan comparision
SQL_ID bxu9sk3q91trn
--------------------
INSERT INTO TMP_ACTSEARCH1 (ACTIVITY_PK) SELECT ACT.ACTIVITY_PK FROM
TBL_TMX_ACTIVITY ACT WHERE CONTAINS(ACT.ACTIVITYDESC, :B1 ) > 0
Plan hash value: 2274164979
--------------------------------------------------------------------------------------
| Id | Operation | Name | Rows | Bytes | Cost (%CPU)| Time |
--------------------------------------------------------------------------------------
| 0 | INSERT STATEMENT | | | | 379K(100)| |
| 1 | TABLE ACCESS FULL| TBL_TMX_ACTIVITY | 1 | 74 | 379K (8)| 00:00:30 |
--------------------------------------------------------------------------------------
SQL_ID bxu9sk3q91trn
--------------------
INSERT INTO TMP_ACTSEARCH1 (ACTIVITY_PK) SELECT ACT.ACTIVITY_PK FROM
TBL_TMX_ACTIVITY ACT WHERE CONTAINS(ACT.ACTIVITYDESC, :B1 ) > 0
Plan hash value: 4216380757
--------------------------------------------------------------------------------------
| Id | Operation | Name | Rows | Bytes | Cost (%CPU)|
--------------------------------------------------------------------------------------
| 0 | INSERT STATEMENT | | | | 1 (100)|
| 1 | TABLE ACCESS BY INDEX ROWID| TBL_TMX_ACTIVITY | 1 | 73 | 0 (0)|
| 2 | DOMAIN INDEX | FT_TABLE_RAJLCU1R | | | 0 (0)|
--------------------------------------------------------------------------------------
14. Most possible/common causes..
There are many approaches to this finding issue and its possible solutions.
The following are some simple ways of possible causes.
1. Wait Events / Resource contention (Views: V$SESSION, V$LOCK, V$SQLTEXT, V$ACTIVE_SESSION_HISTORY,
V$SESSION_WAIT_HISTORY, GV$SESSION_WAIT)
2. Large number of long running scripts other than problematic one ( Views : V$SESSION, V$PROCESS)
3. Multiple Active & Inactive sessions counts. (Views : V$SESSION)
4. Old object(table/index/sys) statistics (Views : DBA_TAB_STATISTICS, DBA_IND_STATISTICS)
5. Incorrect optimization/execution plan(utility : dbms_xplan)
6. Fragmentation (Views : V$DBA_SEGMENTS, V$DBA_TABLES)
15. Most possible/common causes..
continue
8. Getting database I/O wrong (V$SQLAREA, V$SYSSTAT, PROCESS ,V$SESSION ,V$SESSTAT ,V$SESS_IO
,V$BGPROCESS)
9. Bad use of cursors and the shared pool (Parameter : CUSRSOR_SHARING , SGA, PGA)
10. High Amount of Recursive (SYS) SQL. (View : V$SYS_TIME_MODEL, V$SESS_TIME_MODEL)
11. Duplicate indexing / Full table scan (Views : V$OBJECT_USAGE, V$OBJECT_VIEW)
17. Some useful scripts..
Here are the links for all scripts mentioned in this document:
Blocking/Waiting Sessions
Detect long running scripts
Index Usage
Locks and inactive sessions
Hit ratio and CPU usage
Tablespace utilization
Disk I/O