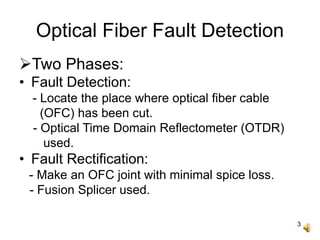
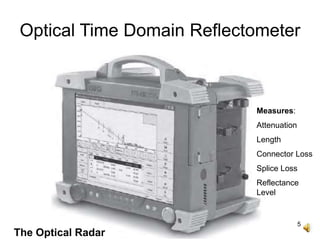
1
Optical Time Domain
Reflectometry
MEC
2
Contents
• Introduction.
• Backscatter Measurement.
• Optical Power and Power Ratio.
• Backscatter Plot.
• Dead Zone.
• Polarisation Noise.
• Polarisation OTDR.
• OTDR Drawbacks.
3
Optical Fiber Fault Detection
Two Phases:
• Fault Detection:
- Locate the place where optical fiber cable
(OFC) has been cut.
- Optical Time Domain Reflectometer (OTDR)
used.
• Fault Rectification:
- Make an OFC joint with minimal spice loss.
- Fusion Splicer used.
4
OTDR
• Wide application in both laboratory and the
field.
• Called backscatter measurement method.
• Backscattering method first described by
Barnoski and Jensen.
• Nondestructive - does not require the
cutting back of the fiber.
• Require access to one end of the optical
link only.
5
Optical Time Domain Reflectometer
The Optical Radar
Measures:
Attenuation
Length
Connector Loss
Splice Loss
Reflectance
Level
6
OTDR Building Blocks
• Optical Source and Receiver.
• Data Acquisition Module.
• Central Processing Unit.
• Information Storage Unit.
- Internal Memory.
- External Disk.
• Display.
7
OTDR
• Measurement of attenuation on an optical
link down its entire length.
• Gives information on length dependence of
the link loss.
• When attenuation on the link varies with
length, averaged loss information is
inadequate.
• OTDR measures splice & connector losses
and the rotation of any faults on the link.
8
OTDR
• Measurement and analysis of the fraction
of light reflected back within the numerical
aperture due to Rayleigh scattering.
• Possible to determine backscattered
optical power from a point along the link
length in relation to the forward optical
power at that point.
9
Backscatter Measurement
10
Backscatter Measurement
• For location-dependent attenuation values.
• Gives overall picture of optical loss down
the link.
• Light pulse launched in the forward
direction from an injection laser.
• Use of directional coupler or a system of
external lenses with a beam splitter.
• Backscattered light detected using an
avalanche photodiode receiver.
• Received signal swamped with noise.
11
Backscatter Measurement
• Received optical signal power at a very low
level compared with the forward power at
that point by some 45 to 60 dB.
• Integrator averages over a number of
measurements, improves received SNR.
• Integrator output fed through a logarithmic
amplifier.
• Averaged measurements for successive
points within the fiber plotted on a chart
recorder.
12
Backscattered Optical Power
• Backscattered optical power as a function
of time:
Pi - optical power launched into the fiber, S -
fraction of captured optical power, γR -
Rayleigh scattering coefficient (backscatter
loss per unit length), Wo - input optical pulse
width, vg - group velocity in the fiber, γ –
fiber attenuation coefficient per unit length.
13
Captured Optical Power
• Fraction of captured optical power is the ratio
of the solid acceptance angle for the fiber to
the total solid angle.
• For step index fibers, fraction of captured
optical power:
• S for a graded index fiber a factor of 2/3
lower than for a step index fiber with the
same numerical aperture.
14
Power Ratio
• Power Ratio
• Substitute for S
• Group velocity
• Hence,
15
Backscatter Plot
16
Backscatter Plot
• Initial pulse caused
by reflection and
backscatter from
the input coupler.
• Long tail due to
distributed
Rayleigh
scattering from the
input pulse as it
travels down the
link.
↓
17
Backscatter Plot
• Pulse due to
discrete reflection
from a fiber joint.
• A discontinuity due
to excessive loss at
a fiber imperfection
or fault.
• Pulse due to
Fresnel reflection
incurred at the
output end face.
↓
↓
↓
18
Back Scatter Plot
• Fresnel Reflection and Rayleigh Scattering
produce backscatter plot.
• Fresnel Reflection when light enters a
medium having a different refractive index.
• Reflected Power:
P0 – incident power, nfiber & nair – refractive
indices of fiber and air.
• Perfect fiber reflects about 4% of incident
power.
2
0P ( )
n nfiber air
n nfiber airref P


19
Backscatter Plot
• Attenuation per unit length for the fiber by
computing the slope of the curve over the
length required.
• Location and insertion losses of joints
and/or faults obtained from the power drop
at the respective positions on the link.
• Overall link length determined from the
time difference between reflections from
the fiber input and output end faces.
20
Backscatter Plot
• Measurement of splice or connector loss.
• Measurement of splice or connector return
loss.
• OTDR measurement based on operating
parameters (i.e. wavelength or band, data
transmission rate etc.).
• Dynamic range - total optical loss that
optical time domain reflectometer can
analyze.
21
Locating Fiber Fault
• For a time difference of t, Fiber Length:
n1- core refractive index.
Light travels a length L from source to the
break point and then returns, hence a
factor 2 is included.
12
ct
L
n

22
OTDR
• Software to enable fast manipulation of the
measured data.
• Instant calculation of optical power link
budget.
• Generation of comprehensive reports.
• OTDR traces used to determine ORL in an
optical fiber network.
23
OTDR Performance Parameters
Dynamic Range:
• difference between initial backscattered power
level at the front end connector and the noise
level after around 3 minutes of measurement
time.
• expressed in dB of one way fiber loss.
• provides information on maximum fiber loss
that can be measured.
• denotes time required to measure a given fiber
loss.
• ranks OTDR capabilities.
24
OTDR Performance Parameters
Measurement Range:
• maximum allowable attenuation between
OTDR and the event that still enables accurate
measurement.
• capability of identifying events such as splice
points, connection points or fiber breaks.
Tradeoff between dynamic range and
resolution.
• Small pulse width for high spatial resolution.
• Small pulse width reduces SNR, lowers dynamic
range.
25
Dead Zone
• Strong optical reflection from a reflective
event reaches OTDR, saturates detection
circuit for specific time period (converted
to distance in the instrument) till recovery,
continues to measure backscattering
accurately again.
• Certain portion of fiber link following the
reflective event cannot be displayed by the
instrument.
26
Polarisation Noise
• Exhibited by single-mode fiber optical time
domain reflectometers.
• State of polarization of backscattered light
dependent on distance of backscattering
fiber element from the input fiber end.
• Amplitude fluctuation in the backscattered
light.
• Employed to measure the evolution of
polarization (Polarisation OTDR).
27
Polarisation Noise
• Reduction of polarization noise necessary
in single-mode OTDR instrument.
• Reduction using polarization-independent
acousto-optic deflector or a polarization
scrambler.
• POTDR for measurement of PMD on a
fiber link.
• POTDR to ensure uniform distribution of
PMD along the fiber during manufacturing.
28
POTDR
• POTDR comprises a conventional OTDR
instrument, polarization controller,
polarization analyzer and pulsed laser.
• Employs a narrow band external cavity
laser or DFB laser (i.e. with pulse width ≤ 10
ns) for high spatial resolution with respect to
the frequency-dependent distortions due to
PMD.
• POTDR to monitor levels of PMD when
fabricating dispersion-compensating fibers.
29
POTDR
Output signal power characteristic
Block schematic
POTDR can identify the levels of PMD on the fiber link
Measured on NZ-DSF
High PMD (solid circles)
Medium PMD (solid boxes)
Normal PMD (asterisks)
30
POTDR
• Fiber under test connected to POTDR using
an optical circulator or fiber coupler.
• Pulses sent through optical circulator towards
fiber under test.
• Instrument performs measurements from the
state of polarization (SOP) of backscattered
field.
• Polarization controller & polarization analyzer
to determine SOP and degree of polarization
(DOP) for optical signals.
• Polarization analyzer provides data to plot
OTDR traces.
31
Some OTDR Drawbacks
• Time Consuming.
- fault shows variation with increasing
distance.
- time to localise the place of actual fault.
• System Inefficiency.
- one fault may lead to escape of optical
signal.
- first fault to be rectified before other
faults can be detected.
32
Some OTDR Drawbacks
• Labour Cost.
- trained manpower required.
• Fading of accuracy and precision.
- variation in measured distance with
increasing length.
- uncertainty in fault localisation.
33
Thank You

Optical time domain reflectometry

  • 1.
  • 2.
    2 Contents • Introduction. • BackscatterMeasurement. • Optical Power and Power Ratio. • Backscatter Plot. • Dead Zone. • Polarisation Noise. • Polarisation OTDR. • OTDR Drawbacks.
  • 3.
    3 Optical Fiber FaultDetection Two Phases: • Fault Detection: - Locate the place where optical fiber cable (OFC) has been cut. - Optical Time Domain Reflectometer (OTDR) used. • Fault Rectification: - Make an OFC joint with minimal spice loss. - Fusion Splicer used.
  • 4.
    4 OTDR • Wide applicationin both laboratory and the field. • Called backscatter measurement method. • Backscattering method first described by Barnoski and Jensen. • Nondestructive - does not require the cutting back of the fiber. • Require access to one end of the optical link only.
  • 5.
    5 Optical Time DomainReflectometer The Optical Radar Measures: Attenuation Length Connector Loss Splice Loss Reflectance Level
  • 6.
    6 OTDR Building Blocks •Optical Source and Receiver. • Data Acquisition Module. • Central Processing Unit. • Information Storage Unit. - Internal Memory. - External Disk. • Display.
  • 7.
    7 OTDR • Measurement ofattenuation on an optical link down its entire length. • Gives information on length dependence of the link loss. • When attenuation on the link varies with length, averaged loss information is inadequate. • OTDR measures splice & connector losses and the rotation of any faults on the link.
  • 8.
    8 OTDR • Measurement andanalysis of the fraction of light reflected back within the numerical aperture due to Rayleigh scattering. • Possible to determine backscattered optical power from a point along the link length in relation to the forward optical power at that point.
  • 9.
  • 10.
    10 Backscatter Measurement • Forlocation-dependent attenuation values. • Gives overall picture of optical loss down the link. • Light pulse launched in the forward direction from an injection laser. • Use of directional coupler or a system of external lenses with a beam splitter. • Backscattered light detected using an avalanche photodiode receiver. • Received signal swamped with noise.
  • 11.
    11 Backscatter Measurement • Receivedoptical signal power at a very low level compared with the forward power at that point by some 45 to 60 dB. • Integrator averages over a number of measurements, improves received SNR. • Integrator output fed through a logarithmic amplifier. • Averaged measurements for successive points within the fiber plotted on a chart recorder.
  • 12.
    12 Backscattered Optical Power •Backscattered optical power as a function of time: Pi - optical power launched into the fiber, S - fraction of captured optical power, γR - Rayleigh scattering coefficient (backscatter loss per unit length), Wo - input optical pulse width, vg - group velocity in the fiber, γ – fiber attenuation coefficient per unit length.
  • 13.
    13 Captured Optical Power •Fraction of captured optical power is the ratio of the solid acceptance angle for the fiber to the total solid angle. • For step index fibers, fraction of captured optical power: • S for a graded index fiber a factor of 2/3 lower than for a step index fiber with the same numerical aperture.
  • 14.
    14 Power Ratio • PowerRatio • Substitute for S • Group velocity • Hence,
  • 15.
  • 16.
    16 Backscatter Plot • Initialpulse caused by reflection and backscatter from the input coupler. • Long tail due to distributed Rayleigh scattering from the input pulse as it travels down the link. ↓
  • 17.
    17 Backscatter Plot • Pulsedue to discrete reflection from a fiber joint. • A discontinuity due to excessive loss at a fiber imperfection or fault. • Pulse due to Fresnel reflection incurred at the output end face. ↓ ↓ ↓
  • 18.
    18 Back Scatter Plot •Fresnel Reflection and Rayleigh Scattering produce backscatter plot. • Fresnel Reflection when light enters a medium having a different refractive index. • Reflected Power: P0 – incident power, nfiber & nair – refractive indices of fiber and air. • Perfect fiber reflects about 4% of incident power. 2 0P ( ) n nfiber air n nfiber airref P  
  • 19.
    19 Backscatter Plot • Attenuationper unit length for the fiber by computing the slope of the curve over the length required. • Location and insertion losses of joints and/or faults obtained from the power drop at the respective positions on the link. • Overall link length determined from the time difference between reflections from the fiber input and output end faces.
  • 20.
    20 Backscatter Plot • Measurementof splice or connector loss. • Measurement of splice or connector return loss. • OTDR measurement based on operating parameters (i.e. wavelength or band, data transmission rate etc.). • Dynamic range - total optical loss that optical time domain reflectometer can analyze.
  • 21.
    21 Locating Fiber Fault •For a time difference of t, Fiber Length: n1- core refractive index. Light travels a length L from source to the break point and then returns, hence a factor 2 is included. 12 ct L n 
  • 22.
    22 OTDR • Software toenable fast manipulation of the measured data. • Instant calculation of optical power link budget. • Generation of comprehensive reports. • OTDR traces used to determine ORL in an optical fiber network.
  • 23.
    23 OTDR Performance Parameters DynamicRange: • difference between initial backscattered power level at the front end connector and the noise level after around 3 minutes of measurement time. • expressed in dB of one way fiber loss. • provides information on maximum fiber loss that can be measured. • denotes time required to measure a given fiber loss. • ranks OTDR capabilities.
  • 24.
    24 OTDR Performance Parameters MeasurementRange: • maximum allowable attenuation between OTDR and the event that still enables accurate measurement. • capability of identifying events such as splice points, connection points or fiber breaks. Tradeoff between dynamic range and resolution. • Small pulse width for high spatial resolution. • Small pulse width reduces SNR, lowers dynamic range.
  • 25.
    25 Dead Zone • Strongoptical reflection from a reflective event reaches OTDR, saturates detection circuit for specific time period (converted to distance in the instrument) till recovery, continues to measure backscattering accurately again. • Certain portion of fiber link following the reflective event cannot be displayed by the instrument.
  • 26.
    26 Polarisation Noise • Exhibitedby single-mode fiber optical time domain reflectometers. • State of polarization of backscattered light dependent on distance of backscattering fiber element from the input fiber end. • Amplitude fluctuation in the backscattered light. • Employed to measure the evolution of polarization (Polarisation OTDR).
  • 27.
    27 Polarisation Noise • Reductionof polarization noise necessary in single-mode OTDR instrument. • Reduction using polarization-independent acousto-optic deflector or a polarization scrambler. • POTDR for measurement of PMD on a fiber link. • POTDR to ensure uniform distribution of PMD along the fiber during manufacturing.
  • 28.
    28 POTDR • POTDR comprisesa conventional OTDR instrument, polarization controller, polarization analyzer and pulsed laser. • Employs a narrow band external cavity laser or DFB laser (i.e. with pulse width ≤ 10 ns) for high spatial resolution with respect to the frequency-dependent distortions due to PMD. • POTDR to monitor levels of PMD when fabricating dispersion-compensating fibers.
  • 29.
    29 POTDR Output signal powercharacteristic Block schematic POTDR can identify the levels of PMD on the fiber link Measured on NZ-DSF High PMD (solid circles) Medium PMD (solid boxes) Normal PMD (asterisks)
  • 30.
    30 POTDR • Fiber undertest connected to POTDR using an optical circulator or fiber coupler. • Pulses sent through optical circulator towards fiber under test. • Instrument performs measurements from the state of polarization (SOP) of backscattered field. • Polarization controller & polarization analyzer to determine SOP and degree of polarization (DOP) for optical signals. • Polarization analyzer provides data to plot OTDR traces.
  • 31.
    31 Some OTDR Drawbacks •Time Consuming. - fault shows variation with increasing distance. - time to localise the place of actual fault. • System Inefficiency. - one fault may lead to escape of optical signal. - first fault to be rectified before other faults can be detected.
  • 32.
    32 Some OTDR Drawbacks •Labour Cost. - trained manpower required. • Fading of accuracy and precision. - variation in measured distance with increasing length. - uncertainty in fault localisation.
  • 33.