This document discusses techniques for measuring various optical fiber properties including:
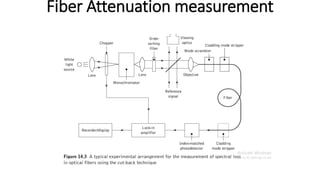
- Attenuation using the cut-back method by comparing output power measurements of original and shortened fiber lengths.
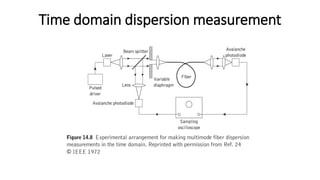
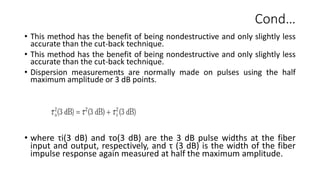
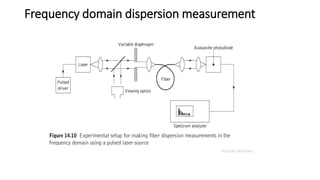
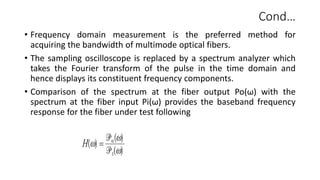
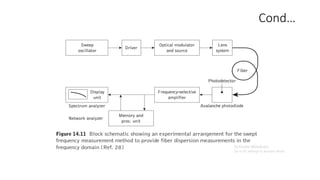
- Dispersion in the time domain using an oscilloscope to measure pulse broadening, and in the frequency domain using a spectrum analyzer.
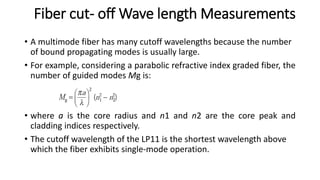
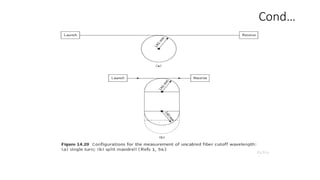
- Cutoff wavelength by increasing the signal wavelength until the LP11 mode is undetectable.
- Fiber diameter using microscopy techniques.
The key methods involve launching light into fibers and analyzing output power or pulse characteristics to determine attenuation, dispersion, and other metrics.