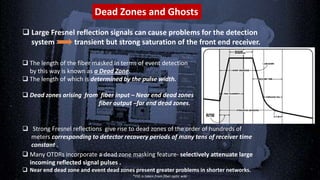
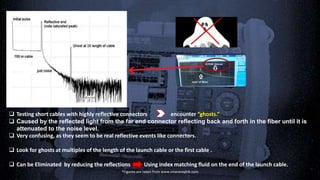
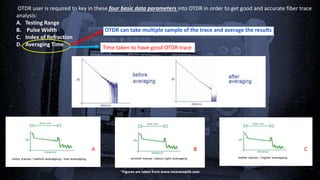
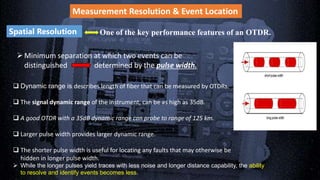
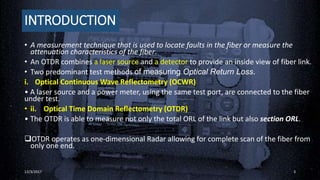
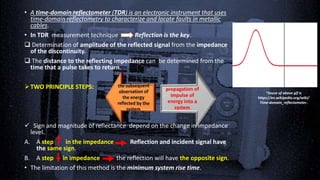
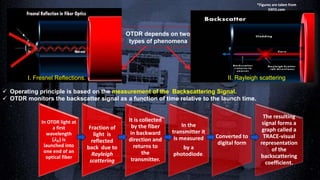
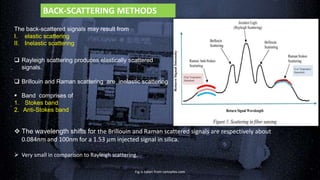
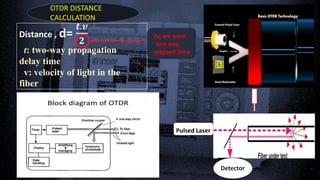
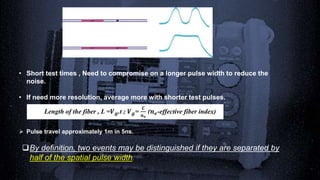
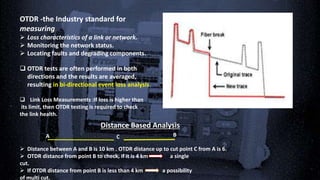
BY: PREMASHIS KUMAR
2016MSPH005
FIBER OPTICS COURSE
SUBMITTED TO:
DR. RAJNEESH KUMAR VERMA
DEAD ZONE
AND GHOST
TRACE
ANALYSIS
RESOLUTION
AND PULSE
WIDTH
BASIC
WORKING
PRINCIPLE
USES AND
CONCLUSION
INTRODUC-
TION
CONTENTS
INTRODUCTION
• A measurement technique that is used to locate faults in the fiber or measure the
attenuation characteristics of the fiber.
• An OTDR combines a laser source and a detector to provide an inside view of fiber link.
• Two predominant test methods of measuring Optical Return Loss.
i. Optical Continuous Wave Reflectometry (OCWR)
• A laser source and a power meter, using the same test port, are connected to the fiber
under test.
• ii. Optical Time Domain Reflectometry (OTDR)
• The OTDR is able to measure not only the total ORL of the link but also section ORL.
OTDR operates as one-dimensional Radar allowing for complete scan of the fiber from
only one end.
12/3/2017 3
• A time-domain reflectometer (TDR) is an electronic instrument that uses
time-domain reflectometry to characterize and locate faults in metallic
cables.
• In TDR measurement technique Reflection is the key.
 Determination of amplitude of the reflected signal from the impedance
of the discontinuity.
 The distance to the reflecting impedance can be determined from the
time that a pulse takes to return.
TWO PRINCIPLE STEPS:
 Sign and magnitude of reflectance depend on the change in impedance
level.
A. A step in the impedance Reflection and incident signal have
the same sign.
B. A step in impedance the reflection will have the opposite sign.
• The limitation of this method is the minimum system rise time.
*Souce of above gif is
https://en.wikipedia.org/wiki/
Time-domain_reflectometer.
OTDR depends on two
types of phenomena
 Operating principle is based on the measurement of the Backscattering Signal.
 OTDR monitors the backscatter signal as a function of time relative to the launch time.
I. Fresnel Reflections. II. Rayleigh scattering
In OTDR light at
a first
wavelength
(𝝀 𝟎) is
launched into
one end of an
optical fiber
Fraction of
light is
reflected
back due to
Rayleigh
scattering
It is collected
by the fiber
in backward
direction and
returns to
the
transmitter.
In the
transmitter it
is measured
by a
photodiode.
Converted to
digital form
The resulting
signal forms a
graph called a
TRACE-visual
representation
of the
backscattering
coefficient.
*Figures are taken from
EXFO.com
The back-scattered signals may result from
I. elastic scattering
II. Inelastic scattering
 Rayleigh scattering produces elastically scattered
signals.
 Brillouin and Raman scattering are inelastic scattering
.
 Band comprises of
1. Stokes band
2. Anti-Stokes band
 The wavelength shifts for the Brillouin and Raman scattered signals are respectively about
0.084nm and 100nm for a 1.53 𝜇m injected signal in silica.
 Very small in comparison to Rayleigh scattering.
Fig is taken from optoplex.com
BACK-SCATTERING METHODS
Distance , d=
𝒕.𝒗
𝟐
t: two-way propagation
delay time
v: velocity of light in the
fiber
OTDR DISTANCE
CALCULATION
As we want
one way
elapsed time
Pulsed LaserPulsed Laser
DetectorDetector
The received backscattered optical power as a function of time ‘t’ is given
by:
𝑷𝒊 - optical power launched into the fiber.
S - fraction of captured optical power.
𝜸 𝑹- Rayleigh scattering coefficient.
𝑾 𝟎 - input optical pulse width.
𝑽 𝒈 - group velocity in fiber.
𝜶- attenuation coefficient per unit length for the
fiber.
OTDR output is expressed in dB relative to the launched power.
The directly measured loss is then halved electronically before plotting the output
trace.
Events in OTDR Traces
 Decaying signal associated with the fiber losses
 Abrupt drops in the backscatter
signal on the trace
Losses due to the presence
of non reflective elements-
o fused coupler
components
o tight bends
o splices.
 Presence of large return pulses
Arise from Fresnel
reflections
 A drop in the background signal
interruptions at
connectors,
non-fiber components
termination
breaks.
 These features on the OTDR signal Events.
 Location and loss associated with them can be obtained directly from the trace.
*Figures are taken from JDSU India's website
FIG:Example of an OTDR trace
Back Reflection = -67.5 dB
Total Loss = 0.250 dB
Back Reflection = -32.5 dB
Total Loss = 4.87 dB
1.CLEAN
CONNECTION
3.DIRTY
CONNECTION
FIG: illustration of a significant decrease in signal performance at dirty connectors
*Figures are taken from JDSU India's website
Dead Zones and Ghosts
 Large Fresnel reflection signals can cause problems for the detection
system transient but strong saturation of the front end receiver.
 The length of the fiber masked in terms of event detection
by this way is known as a Dead Zone.
 The length of which is determined by the pulse width.
 Dead zones arising from fiber input – Near end dead zones
fiber output –far end dead zones.
 Many OTDRs incorporate a dead zone masking feature- selectively attenuate large
incoming reflected signal pulses .
 Near end dead zone and event dead zones present greater problems in shorter networks.
 Strong Fresnel reflections give rise to dead zones of the order of hundreds of
meters corresponding to detector recovery periods of many tens of receiver time
constant .
*FIG is taken from fiber optic wiki
 Testing short cables with highly reflective connectors encounter “ghosts.”
 Caused by the reflected light from the far end connector reflecting back and forth in the fiber until it is
attenuated to the noise level.
 Very confusing, as they seem to be real reflective events like connectors.
 Look for ghosts at multiples of the length of the launch cable or the first cable .
 Can be Eliminated by reducing the reflections Using index matching fluid on the end of the launch cable.
*Figures are taken from www.sinaranoptik.com
OTDR user is required to key in these four basic data parameters into OTDR in order to get good and accurate fiber trace
analysis:
A. Testing Range
B. Pulse Width OTDR can take multiple sample of the trace and average the results.
C. Index of Refraction
D. Averaging Time
Time taken to have good OTDR trace
A B C
*Figures are taken from www.sinaranoptik.com
Measurement Resolution & Event Location
Spatial Resolution One of the key performance features of an OTDR.
Minimum separation at which two events can be
distinguished determined by the pulse width.
 Dynamic range is describes length of fiber that can be measured by OTDRs.
 The signal dynamic range of the instrument, can be as high as 35dB.
 A good OTDR with a 35dB dynamic range can probe to range of 125 km.
 Larger pulse width provides larger dynamic range.
 The shorter pulse width is useful for locating any faults that may otherwise be
hidden in longer pulse width.
 While the longer pulses yield traces with less noise and longer distance capability, the ability
to resolve and identify events becomes less.
• Short test times , Need to compromise on a longer pulse width to reduce the
noise.
• If need more resolution, average more with shorter test pulses.
Length of the fiber , L =𝑽 𝒈.t ; 𝑽 𝒈=
𝑪
𝒏 𝒆
(𝒏 𝒆-effective fiber index)
 Pulse travel approximately 1m in 5ns.
By definition, two events may be distinguished if they are separated by
half of the spatial pulse width.
OTDR -the Industry standard for
measuring
 Loss characteristics of a link or network.
 Monitoring the network status.
 Locating faults and degrading components.
 OTDR tests are often performed in both
directions and the results are averaged,
resulting in bi-directional event loss analysis.
 Link Loss Measurements :If loss is higher than
its limit, then OTDR testing is required to check
the link health.
Distance Based Analysis
 Distance between A and B is 10 km . OTDR distance up to cut point C from A is 6.
 OTDR distance from point B to check, if it is 4 km a single
cut.
 If OTDR distance from point B is less than 4 km a possibility
of multi cut.
A BC
OTDR-OPTICAL TIME DOMAIN REFLECTOMETER

OTDR-OPTICAL TIME DOMAIN REFLECTOMETER

  • 1.
    BY: PREMASHIS KUMAR 2016MSPH005 FIBEROPTICS COURSE SUBMITTED TO: DR. RAJNEESH KUMAR VERMA
  • 2.
    DEAD ZONE AND GHOST TRACE ANALYSIS RESOLUTION ANDPULSE WIDTH BASIC WORKING PRINCIPLE USES AND CONCLUSION INTRODUC- TION CONTENTS
  • 3.
    INTRODUCTION • A measurementtechnique that is used to locate faults in the fiber or measure the attenuation characteristics of the fiber. • An OTDR combines a laser source and a detector to provide an inside view of fiber link. • Two predominant test methods of measuring Optical Return Loss. i. Optical Continuous Wave Reflectometry (OCWR) • A laser source and a power meter, using the same test port, are connected to the fiber under test. • ii. Optical Time Domain Reflectometry (OTDR) • The OTDR is able to measure not only the total ORL of the link but also section ORL. OTDR operates as one-dimensional Radar allowing for complete scan of the fiber from only one end. 12/3/2017 3
  • 4.
    • A time-domainreflectometer (TDR) is an electronic instrument that uses time-domain reflectometry to characterize and locate faults in metallic cables. • In TDR measurement technique Reflection is the key.  Determination of amplitude of the reflected signal from the impedance of the discontinuity.  The distance to the reflecting impedance can be determined from the time that a pulse takes to return. TWO PRINCIPLE STEPS:  Sign and magnitude of reflectance depend on the change in impedance level. A. A step in the impedance Reflection and incident signal have the same sign. B. A step in impedance the reflection will have the opposite sign. • The limitation of this method is the minimum system rise time. *Souce of above gif is https://en.wikipedia.org/wiki/ Time-domain_reflectometer.
  • 5.
    OTDR depends ontwo types of phenomena  Operating principle is based on the measurement of the Backscattering Signal.  OTDR monitors the backscatter signal as a function of time relative to the launch time. I. Fresnel Reflections. II. Rayleigh scattering In OTDR light at a first wavelength (𝝀 𝟎) is launched into one end of an optical fiber Fraction of light is reflected back due to Rayleigh scattering It is collected by the fiber in backward direction and returns to the transmitter. In the transmitter it is measured by a photodiode. Converted to digital form The resulting signal forms a graph called a TRACE-visual representation of the backscattering coefficient. *Figures are taken from EXFO.com
  • 6.
    The back-scattered signalsmay result from I. elastic scattering II. Inelastic scattering  Rayleigh scattering produces elastically scattered signals.  Brillouin and Raman scattering are inelastic scattering .  Band comprises of 1. Stokes band 2. Anti-Stokes band  The wavelength shifts for the Brillouin and Raman scattered signals are respectively about 0.084nm and 100nm for a 1.53 𝜇m injected signal in silica.  Very small in comparison to Rayleigh scattering. Fig is taken from optoplex.com BACK-SCATTERING METHODS
  • 7.
    Distance , d= 𝒕.𝒗 𝟐 t:two-way propagation delay time v: velocity of light in the fiber OTDR DISTANCE CALCULATION As we want one way elapsed time Pulsed LaserPulsed Laser DetectorDetector
  • 8.
    The received backscatteredoptical power as a function of time ‘t’ is given by: 𝑷𝒊 - optical power launched into the fiber. S - fraction of captured optical power. 𝜸 𝑹- Rayleigh scattering coefficient. 𝑾 𝟎 - input optical pulse width. 𝑽 𝒈 - group velocity in fiber. 𝜶- attenuation coefficient per unit length for the fiber. OTDR output is expressed in dB relative to the launched power. The directly measured loss is then halved electronically before plotting the output trace.
  • 9.
    Events in OTDRTraces  Decaying signal associated with the fiber losses  Abrupt drops in the backscatter signal on the trace Losses due to the presence of non reflective elements- o fused coupler components o tight bends o splices.  Presence of large return pulses Arise from Fresnel reflections  A drop in the background signal interruptions at connectors, non-fiber components termination breaks.  These features on the OTDR signal Events.  Location and loss associated with them can be obtained directly from the trace.
  • 10.
    *Figures are takenfrom JDSU India's website FIG:Example of an OTDR trace
  • 11.
    Back Reflection =-67.5 dB Total Loss = 0.250 dB Back Reflection = -32.5 dB Total Loss = 4.87 dB 1.CLEAN CONNECTION 3.DIRTY CONNECTION FIG: illustration of a significant decrease in signal performance at dirty connectors *Figures are taken from JDSU India's website
  • 12.
    Dead Zones andGhosts  Large Fresnel reflection signals can cause problems for the detection system transient but strong saturation of the front end receiver.  The length of the fiber masked in terms of event detection by this way is known as a Dead Zone.  The length of which is determined by the pulse width.  Dead zones arising from fiber input – Near end dead zones fiber output –far end dead zones.  Many OTDRs incorporate a dead zone masking feature- selectively attenuate large incoming reflected signal pulses .  Near end dead zone and event dead zones present greater problems in shorter networks.  Strong Fresnel reflections give rise to dead zones of the order of hundreds of meters corresponding to detector recovery periods of many tens of receiver time constant . *FIG is taken from fiber optic wiki
  • 13.
     Testing shortcables with highly reflective connectors encounter “ghosts.”  Caused by the reflected light from the far end connector reflecting back and forth in the fiber until it is attenuated to the noise level.  Very confusing, as they seem to be real reflective events like connectors.  Look for ghosts at multiples of the length of the launch cable or the first cable .  Can be Eliminated by reducing the reflections Using index matching fluid on the end of the launch cable. *Figures are taken from www.sinaranoptik.com
  • 14.
    OTDR user isrequired to key in these four basic data parameters into OTDR in order to get good and accurate fiber trace analysis: A. Testing Range B. Pulse Width OTDR can take multiple sample of the trace and average the results. C. Index of Refraction D. Averaging Time Time taken to have good OTDR trace A B C *Figures are taken from www.sinaranoptik.com
  • 15.
    Measurement Resolution &Event Location Spatial Resolution One of the key performance features of an OTDR. Minimum separation at which two events can be distinguished determined by the pulse width.  Dynamic range is describes length of fiber that can be measured by OTDRs.  The signal dynamic range of the instrument, can be as high as 35dB.  A good OTDR with a 35dB dynamic range can probe to range of 125 km.  Larger pulse width provides larger dynamic range.  The shorter pulse width is useful for locating any faults that may otherwise be hidden in longer pulse width.  While the longer pulses yield traces with less noise and longer distance capability, the ability to resolve and identify events becomes less.
  • 16.
    • Short testtimes , Need to compromise on a longer pulse width to reduce the noise. • If need more resolution, average more with shorter test pulses. Length of the fiber , L =𝑽 𝒈.t ; 𝑽 𝒈= 𝑪 𝒏 𝒆 (𝒏 𝒆-effective fiber index)  Pulse travel approximately 1m in 5ns. By definition, two events may be distinguished if they are separated by half of the spatial pulse width.
  • 17.
    OTDR -the Industrystandard for measuring  Loss characteristics of a link or network.  Monitoring the network status.  Locating faults and degrading components.  OTDR tests are often performed in both directions and the results are averaged, resulting in bi-directional event loss analysis.  Link Loss Measurements :If loss is higher than its limit, then OTDR testing is required to check the link health. Distance Based Analysis  Distance between A and B is 10 km . OTDR distance up to cut point C from A is 6.  OTDR distance from point B to check, if it is 4 km a single cut.  If OTDR distance from point B is less than 4 km a possibility of multi cut. A BC

Editor's Notes