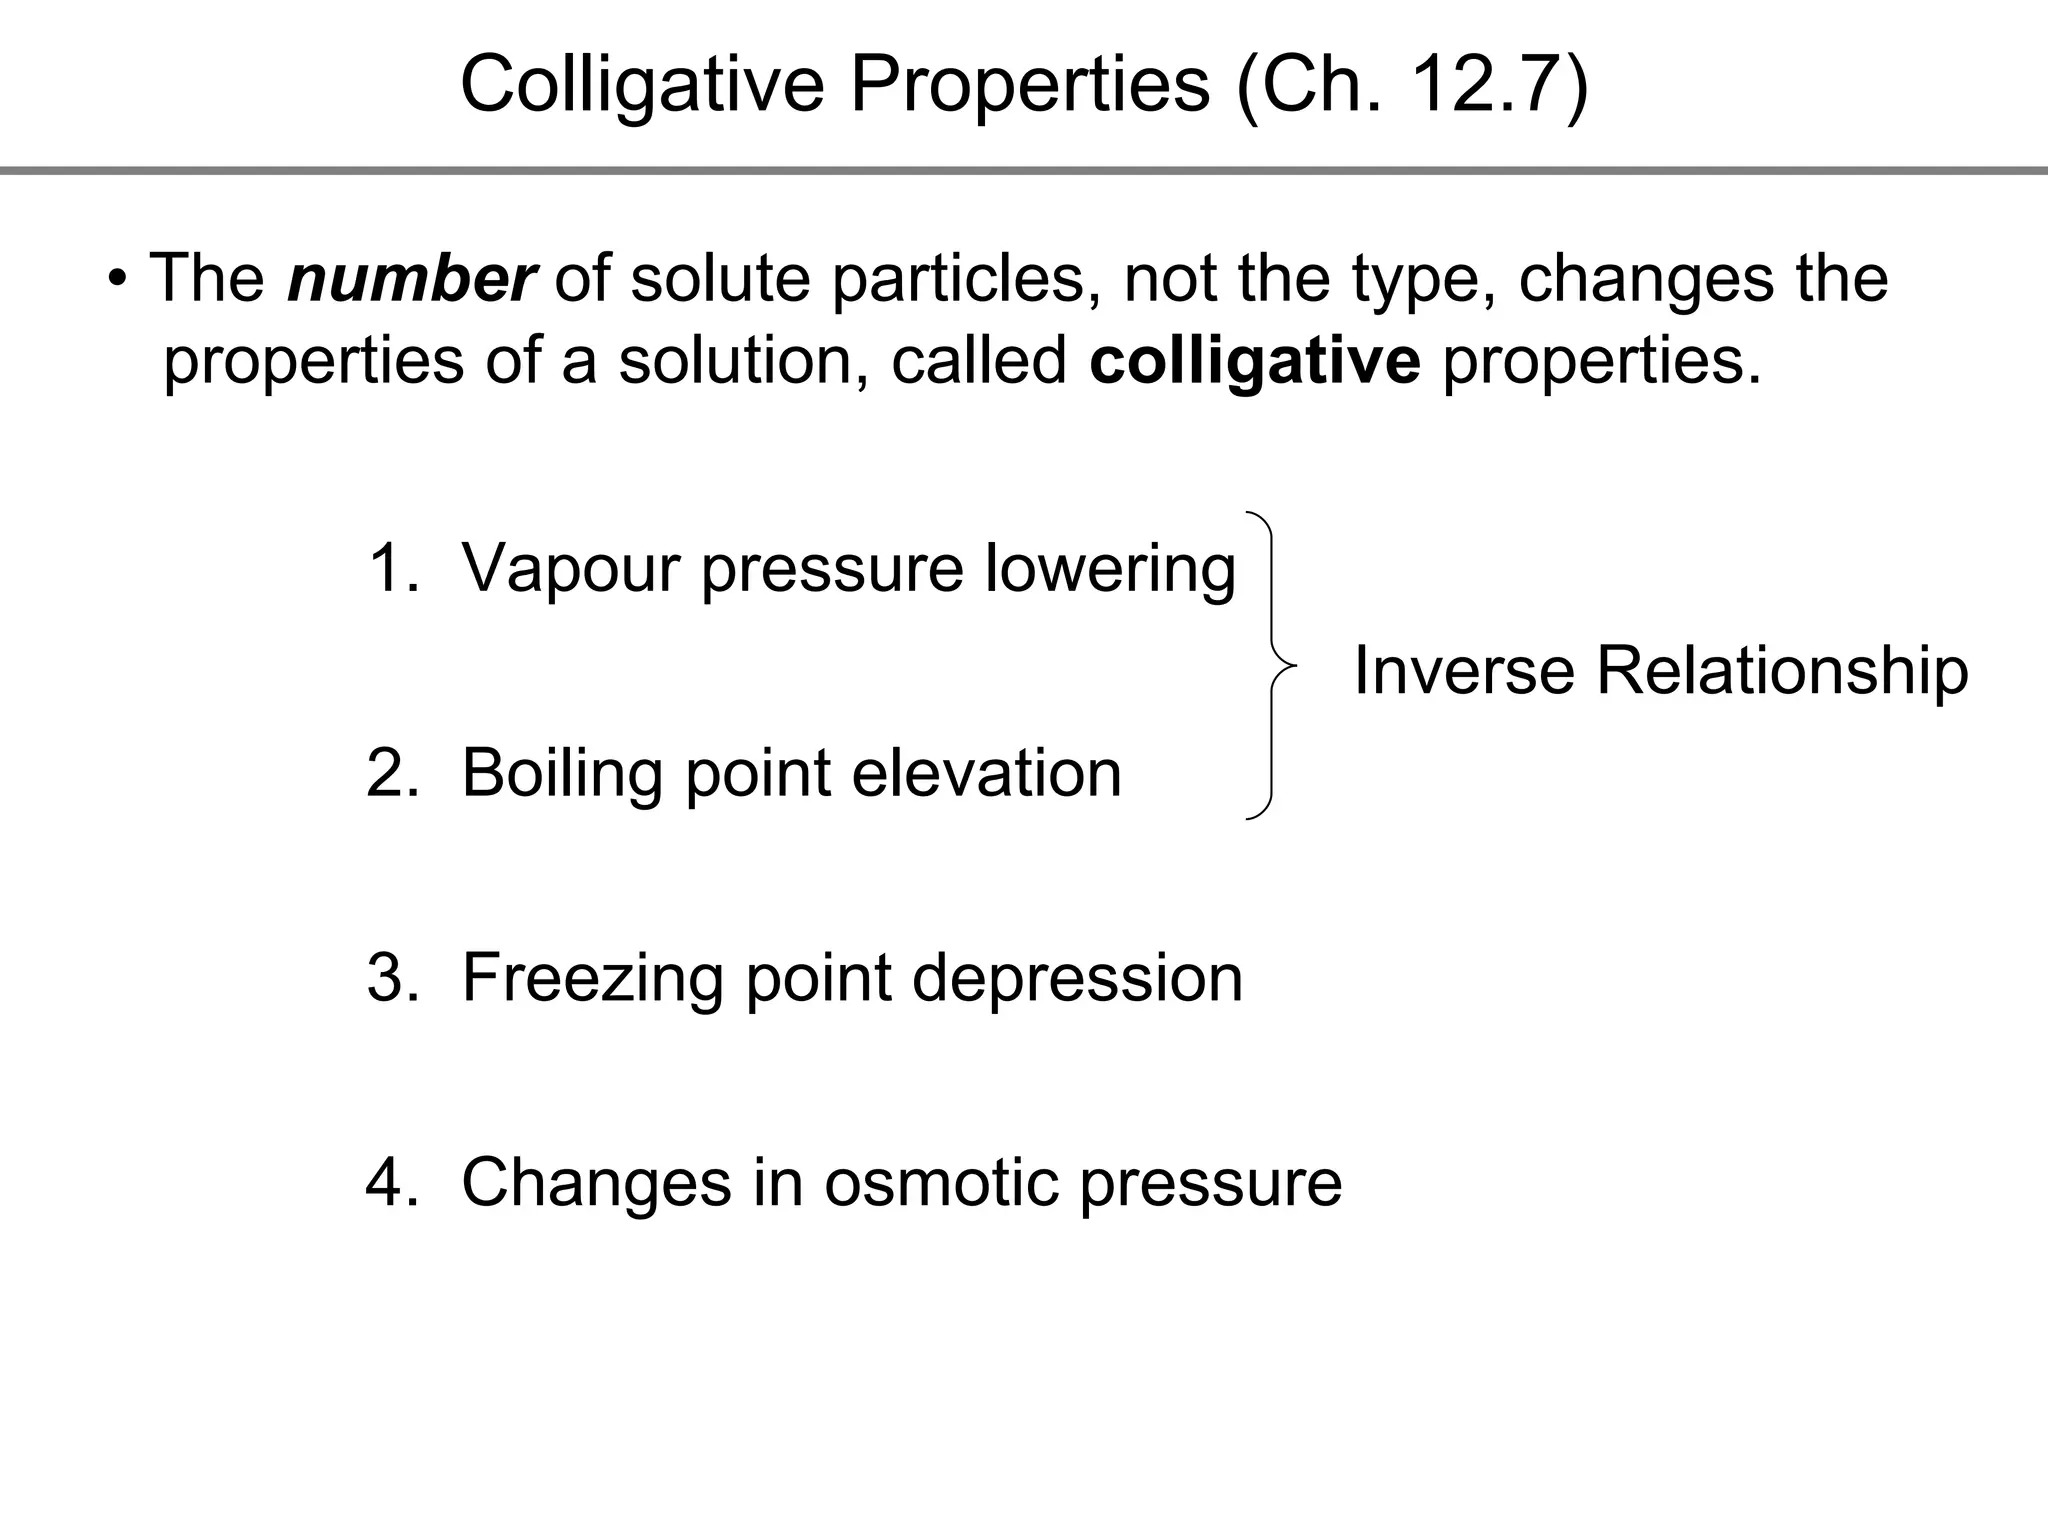
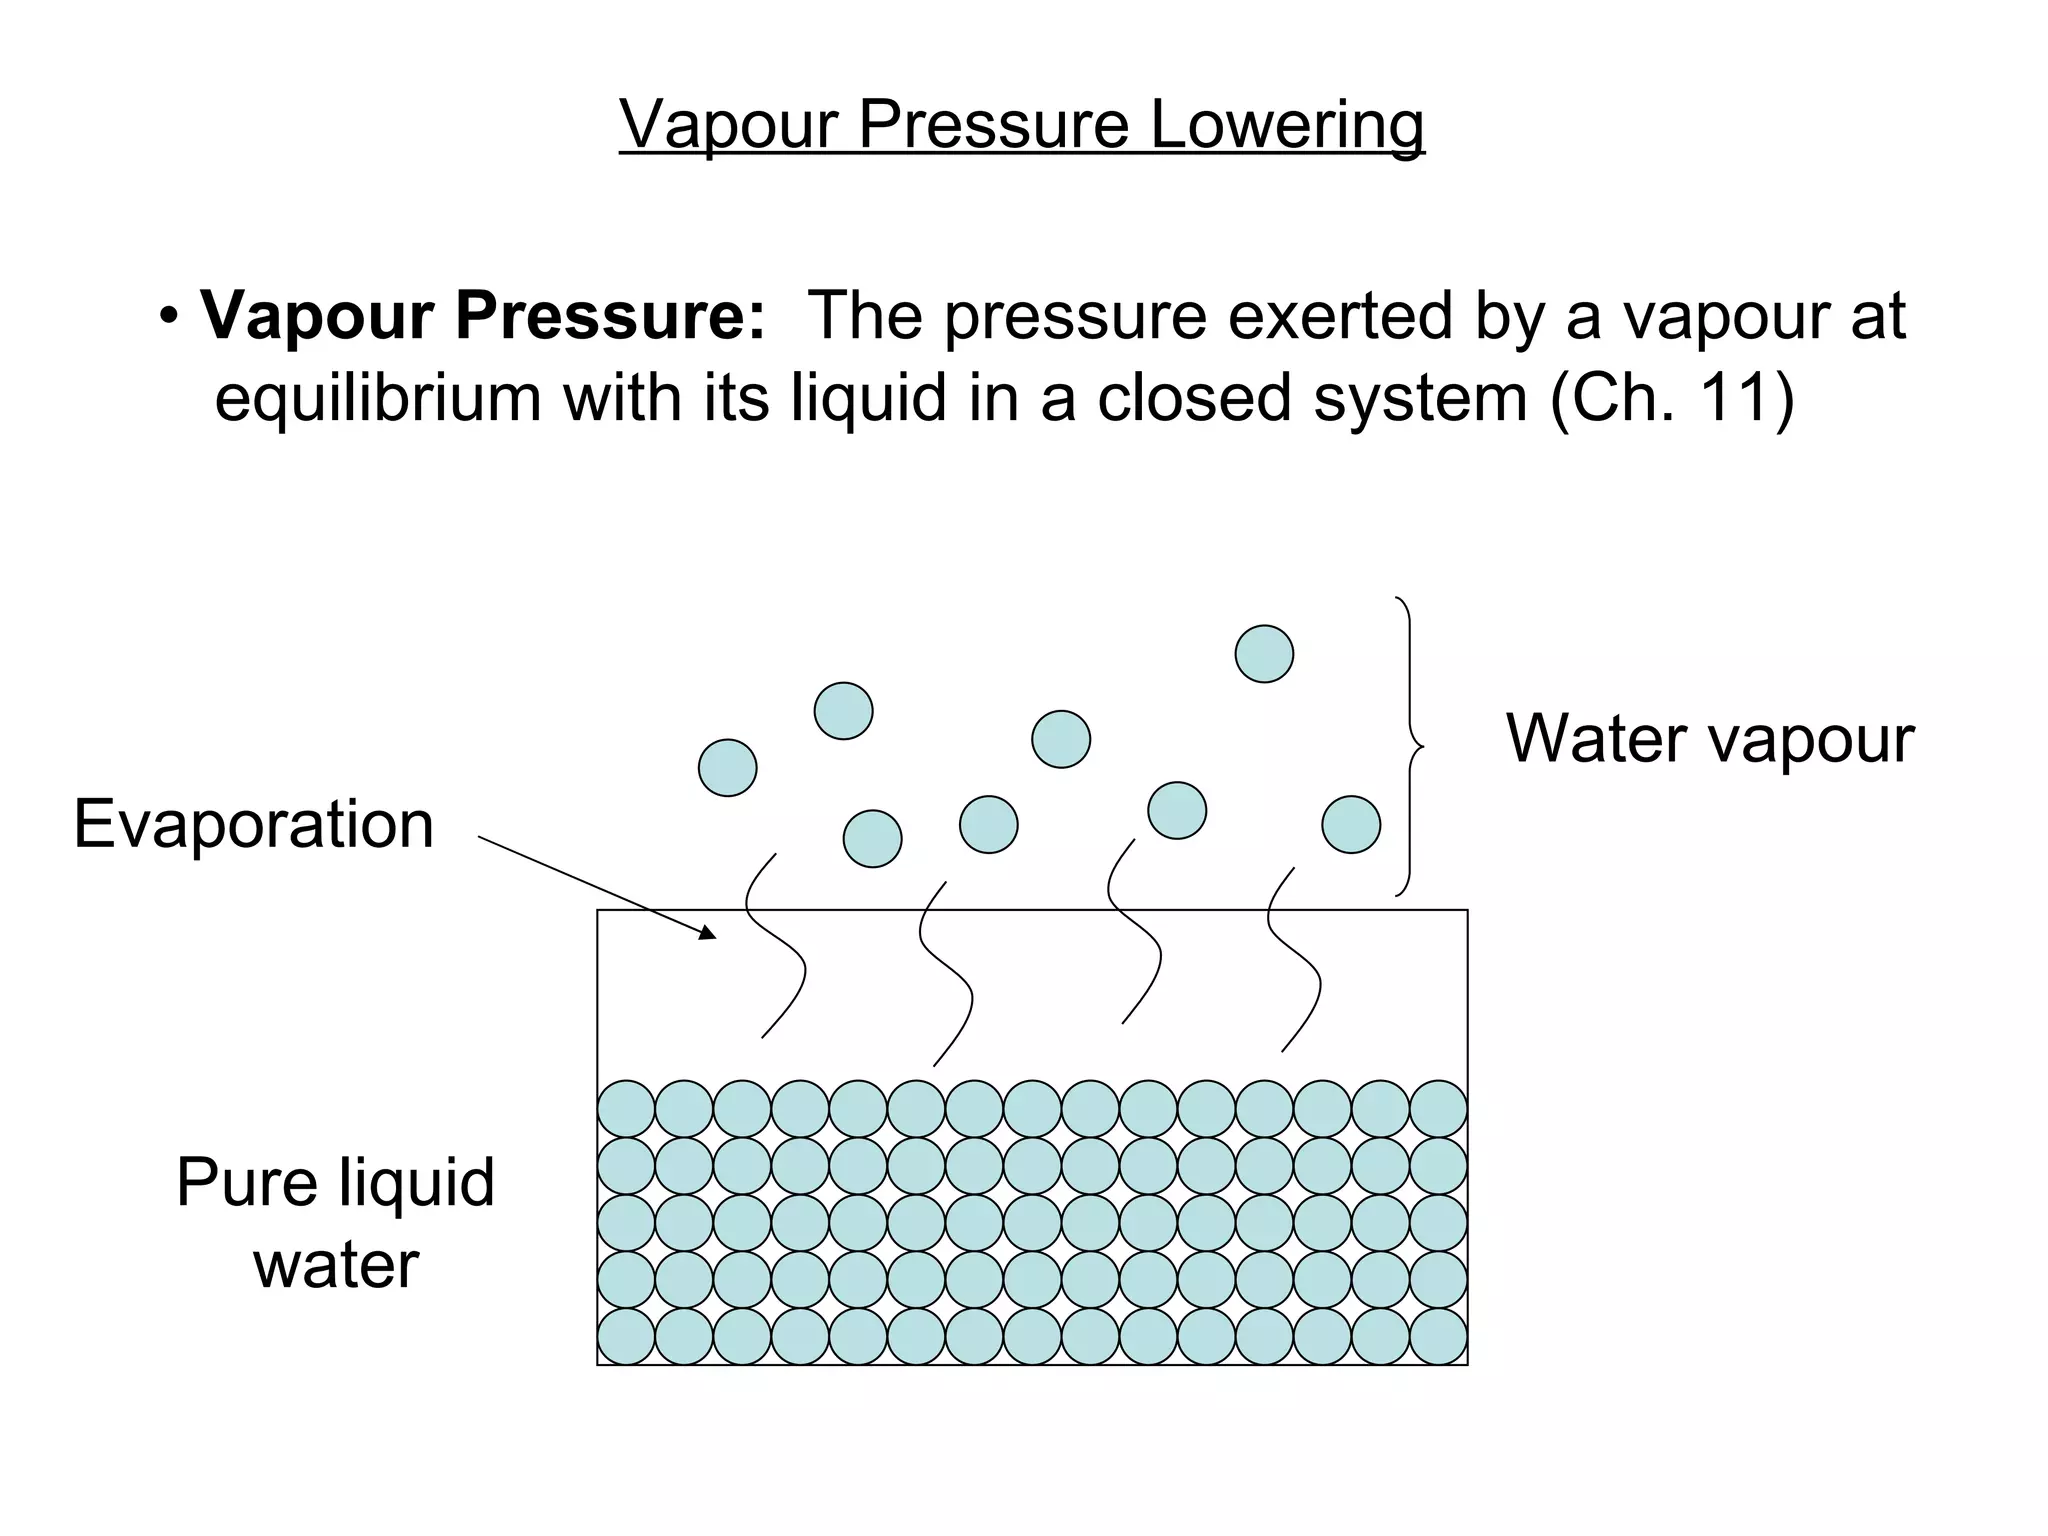
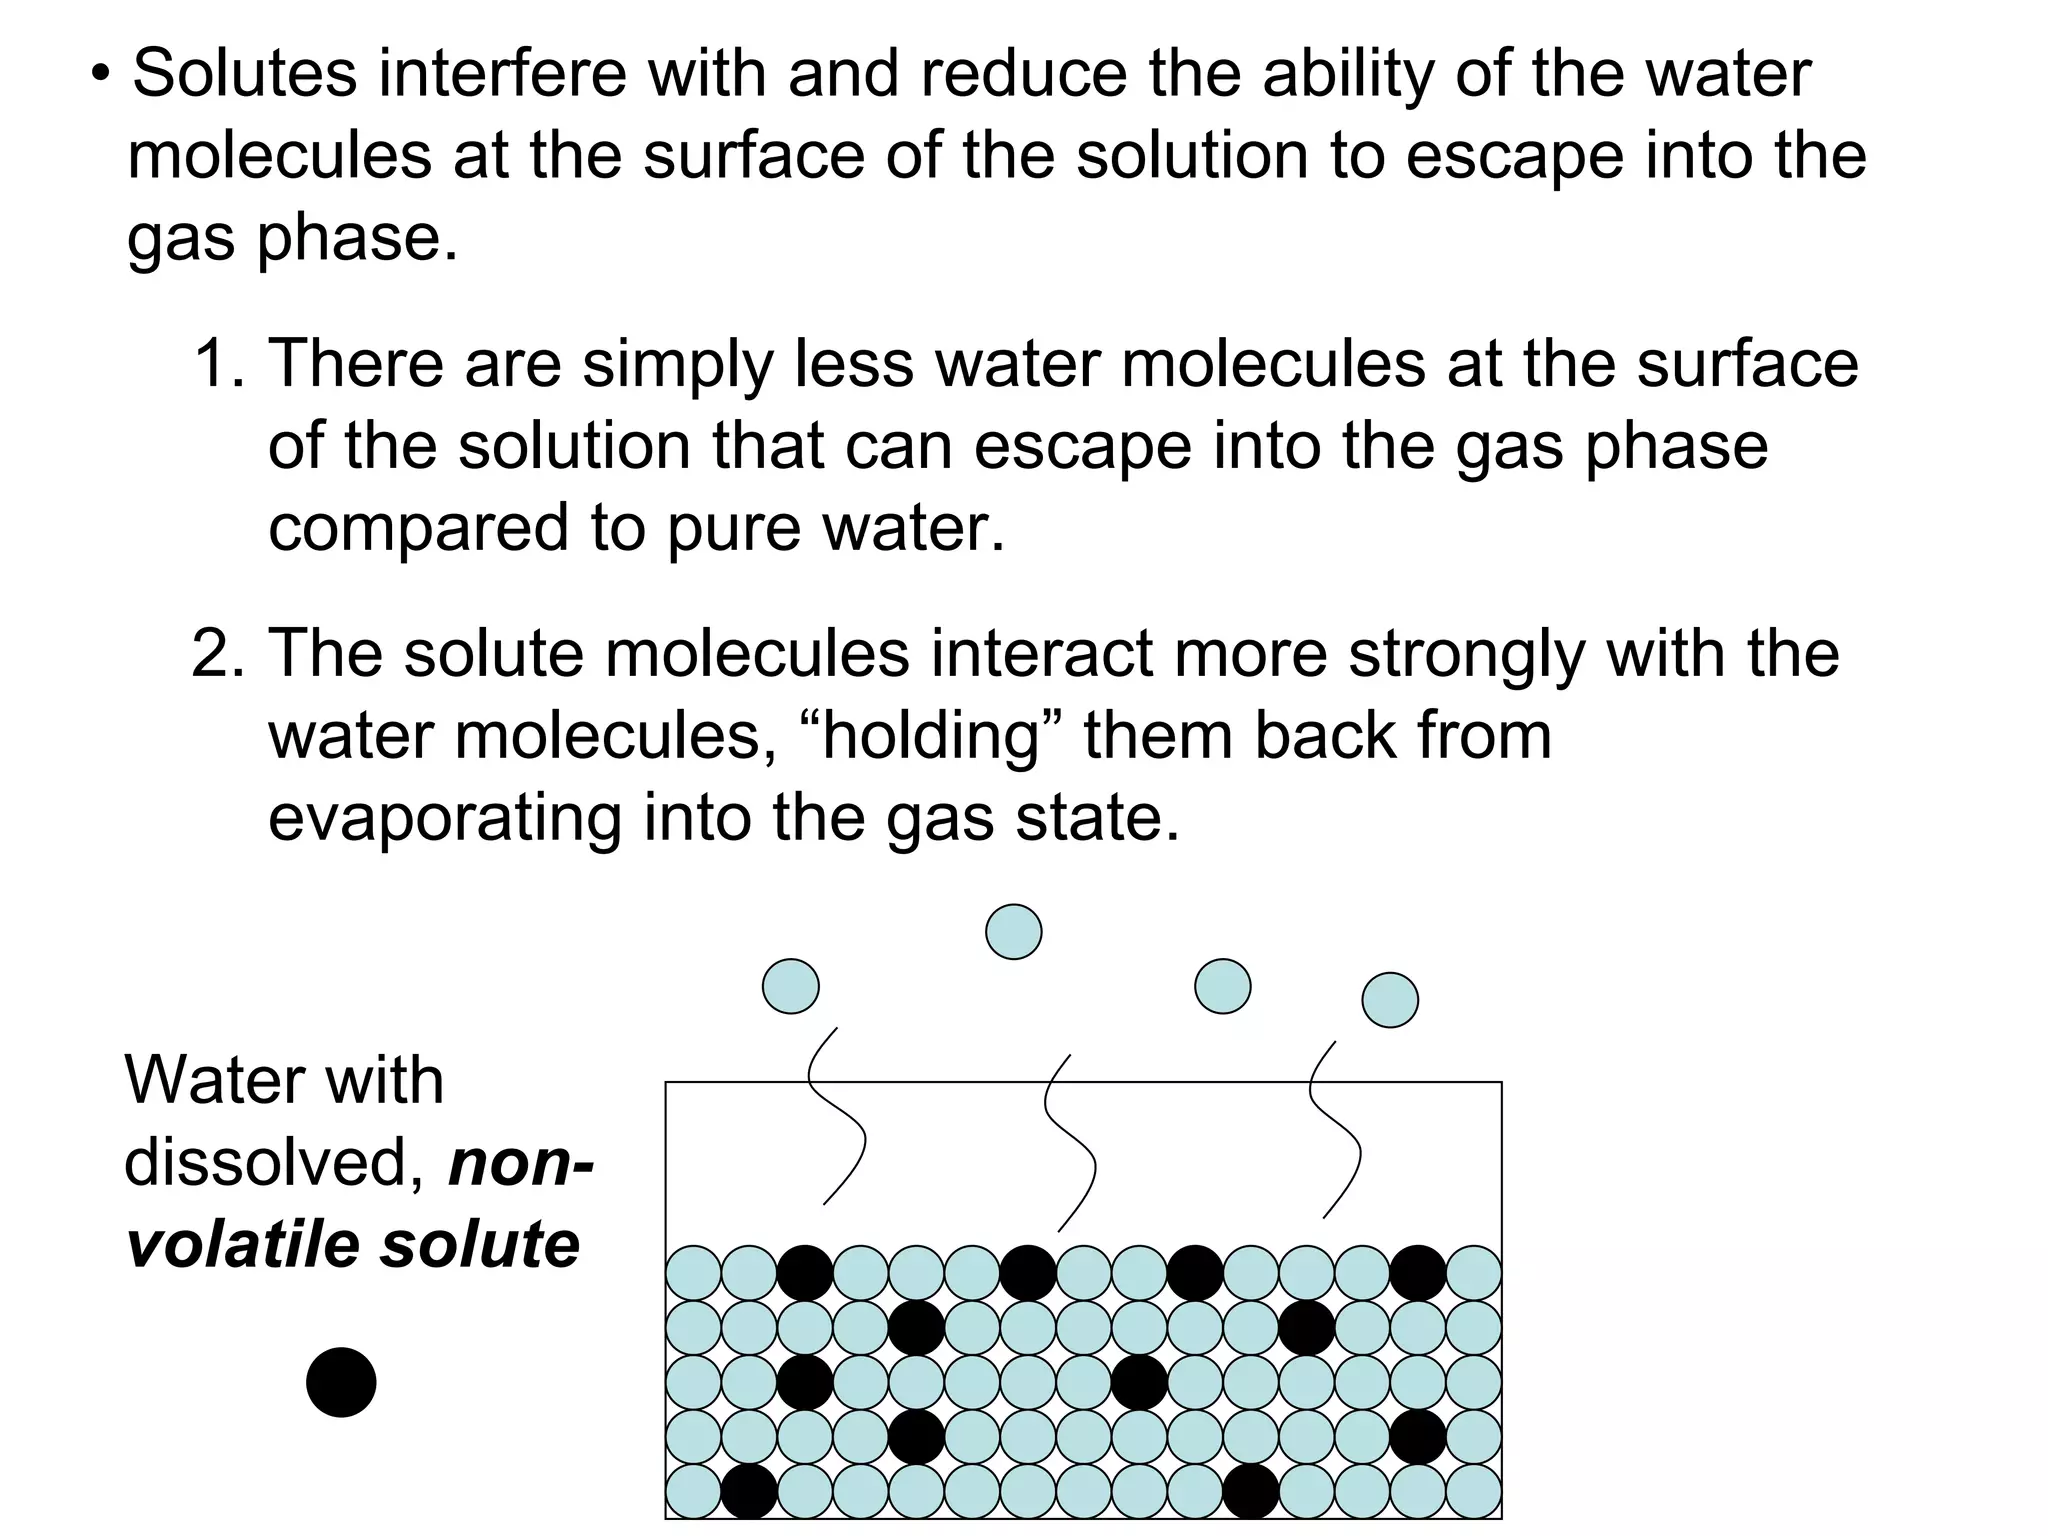
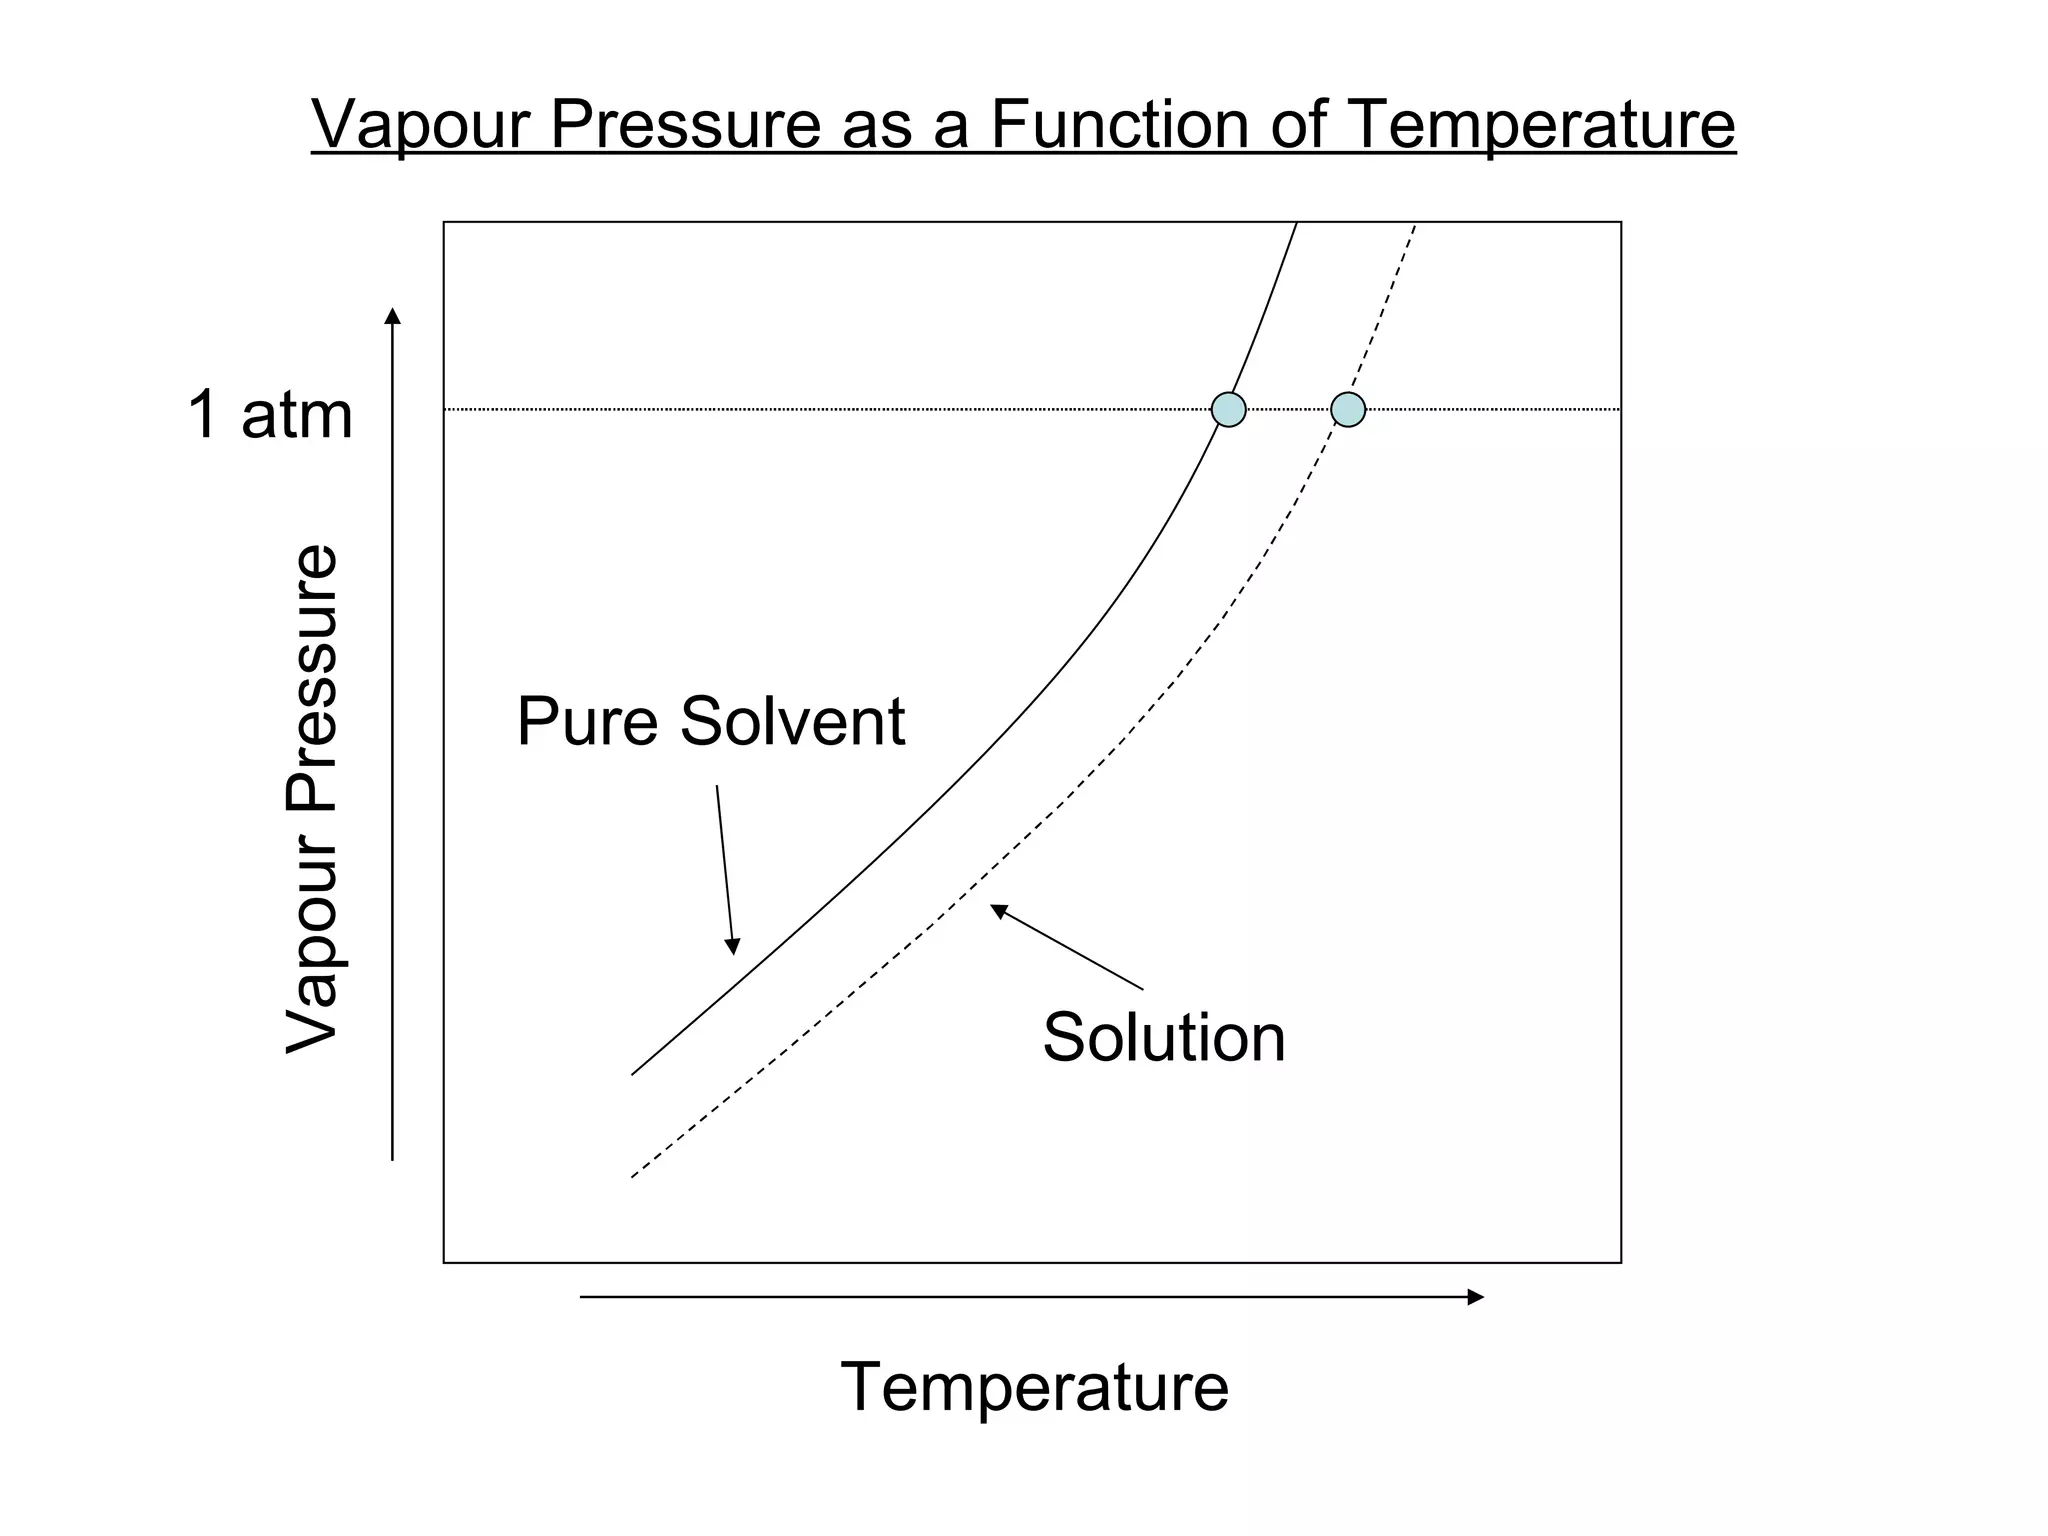
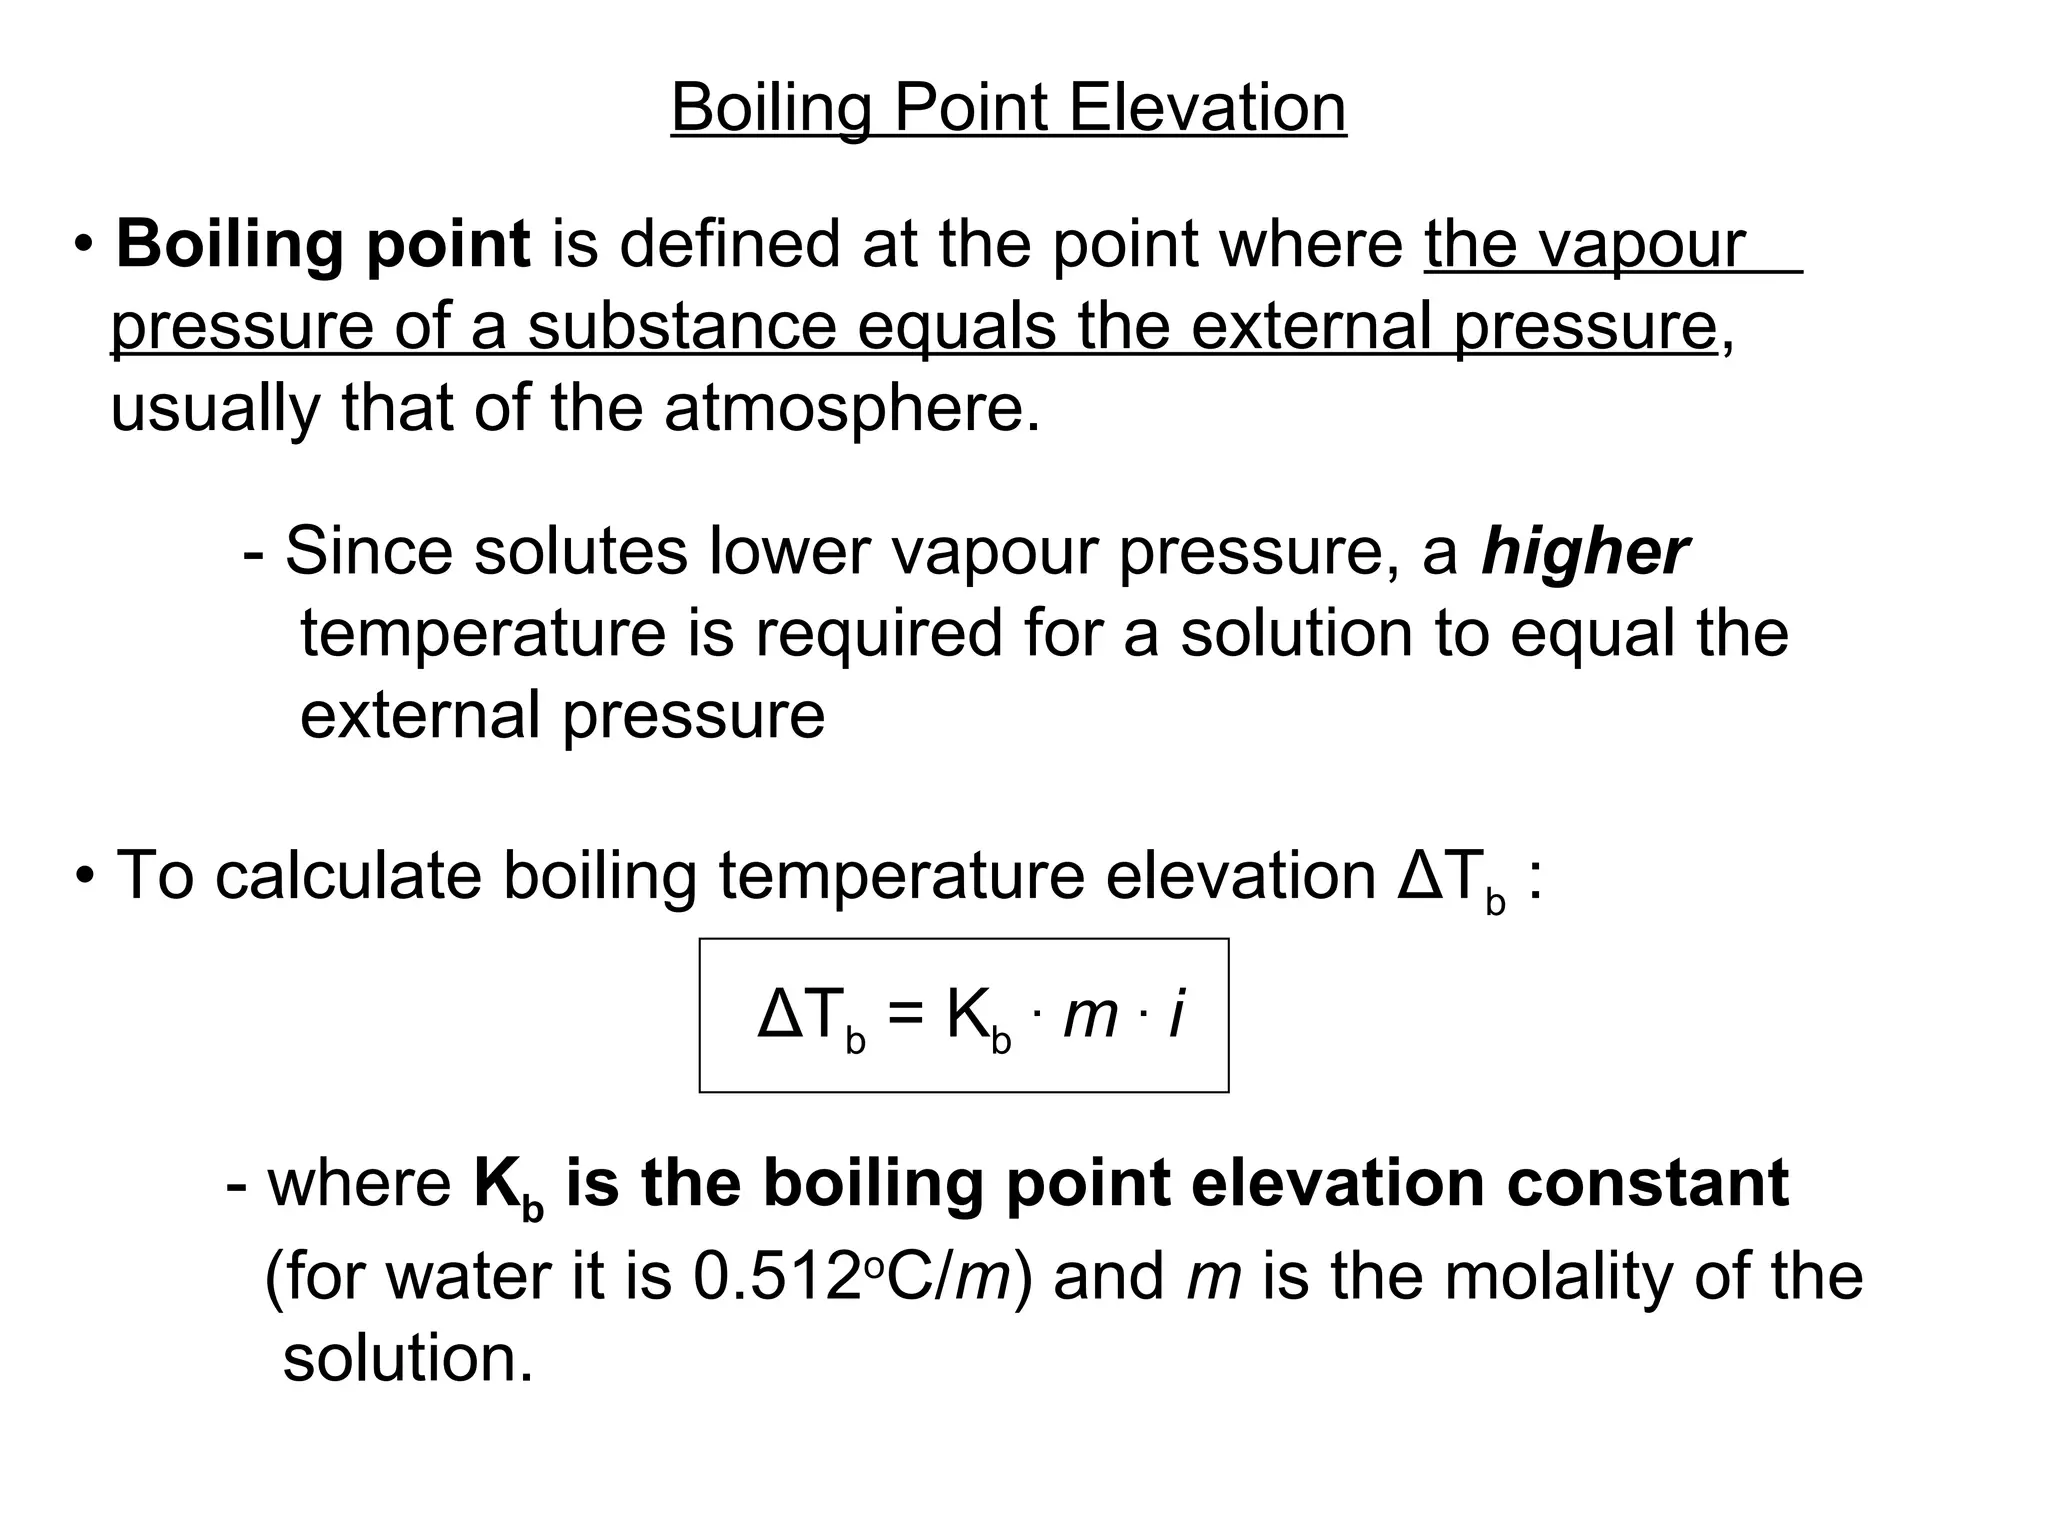
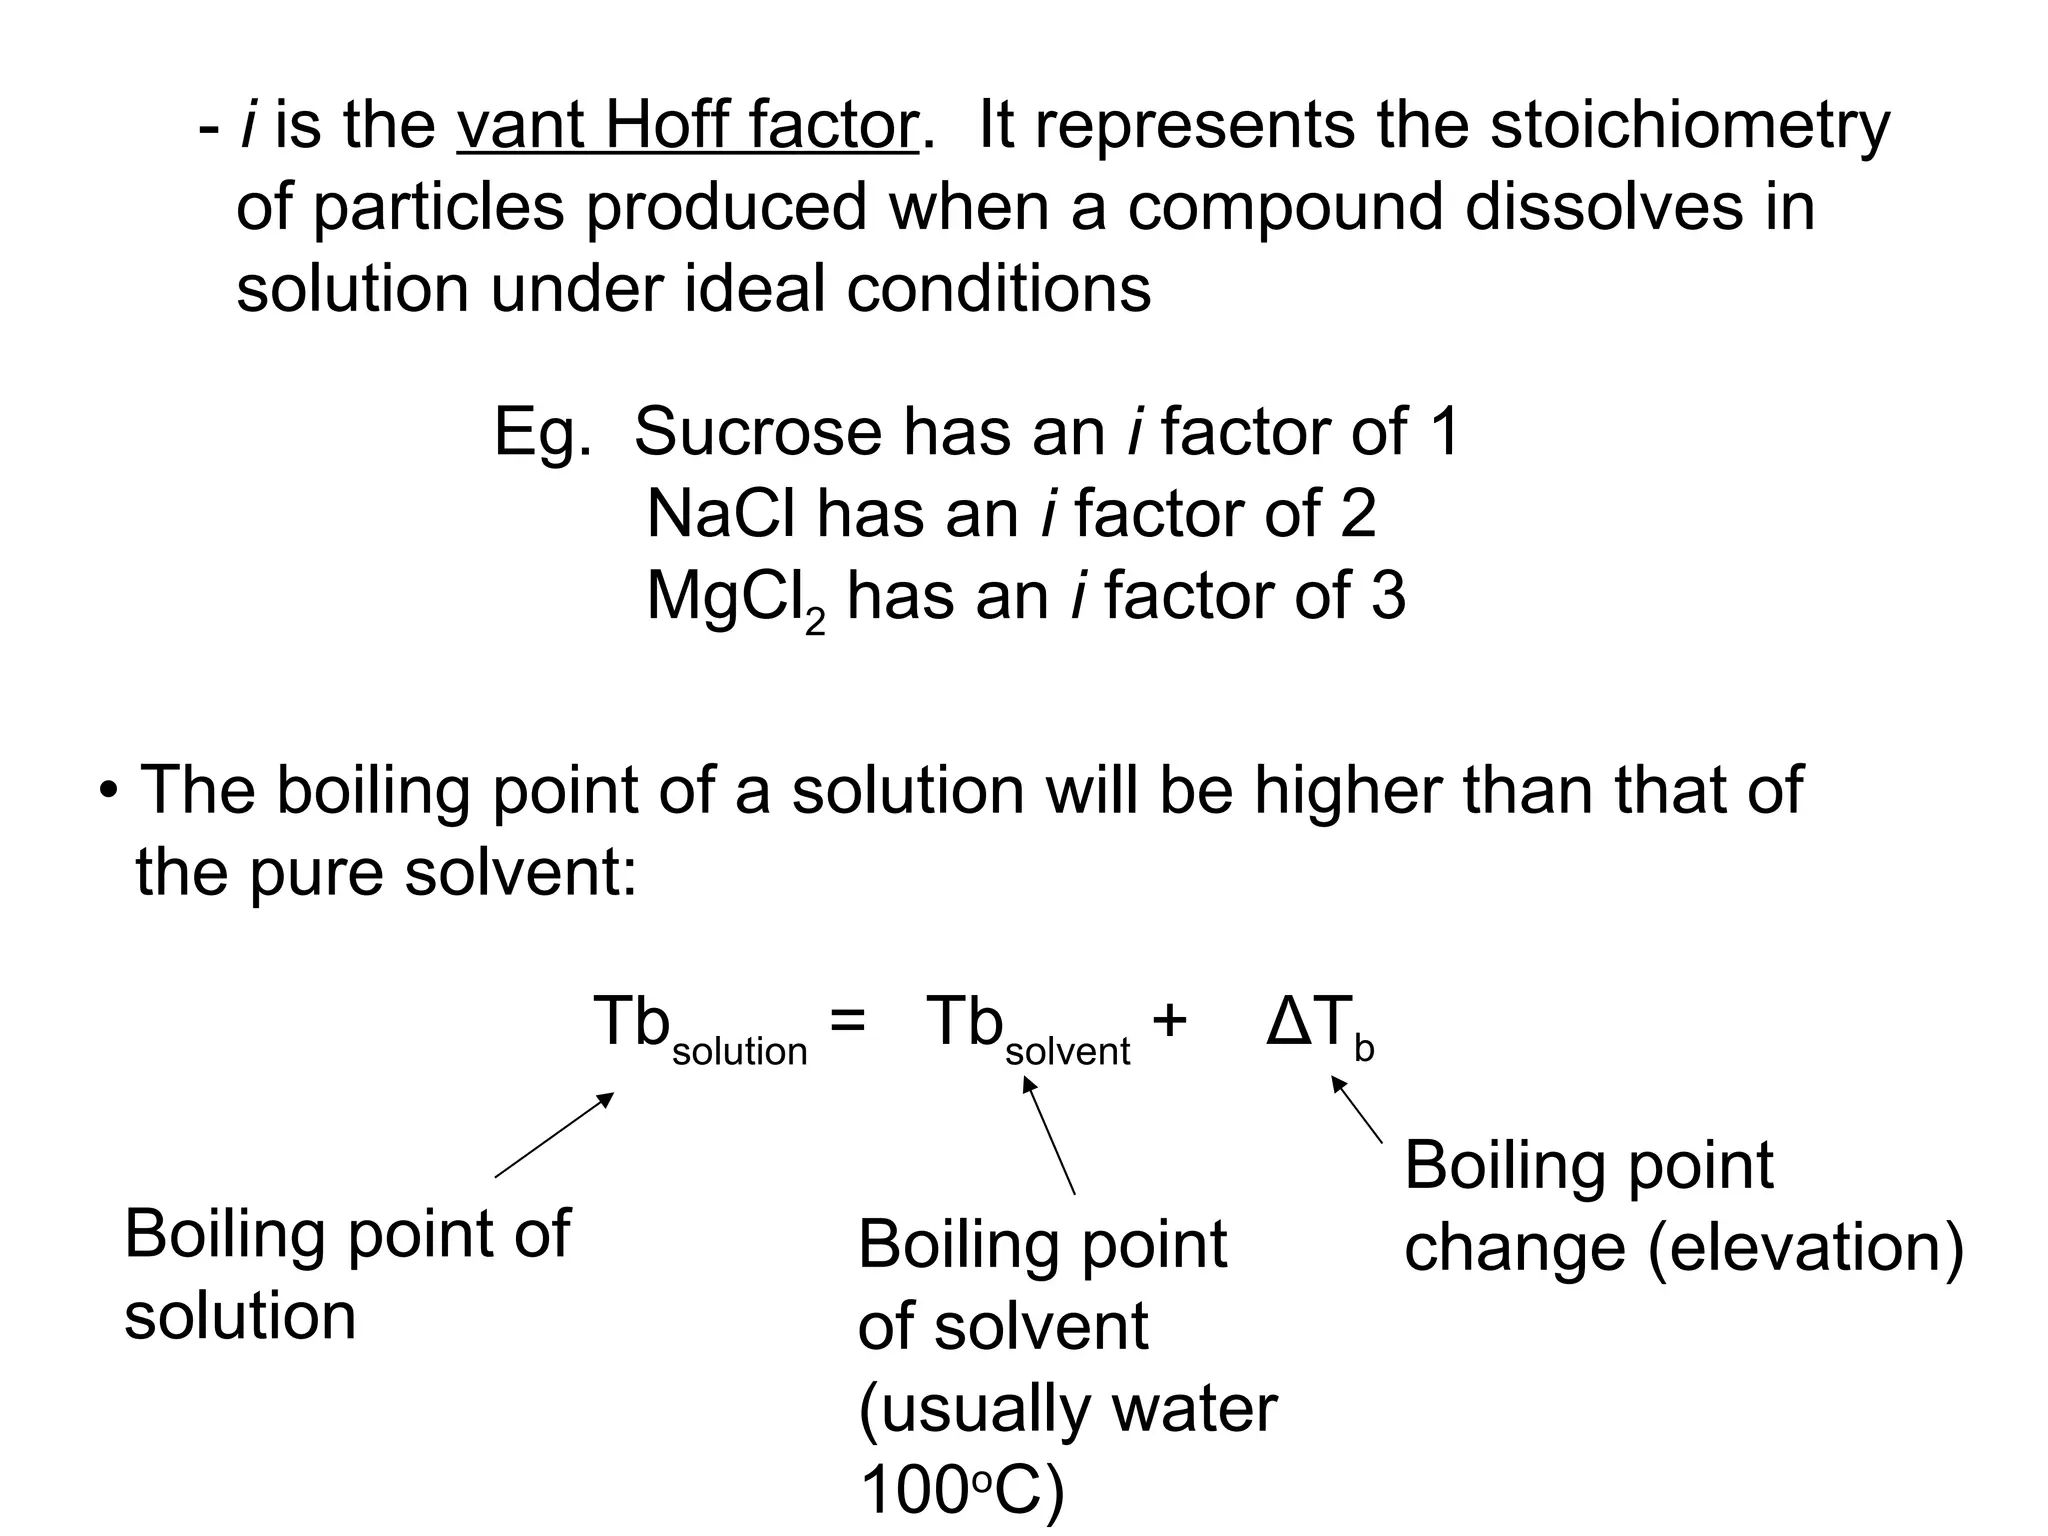
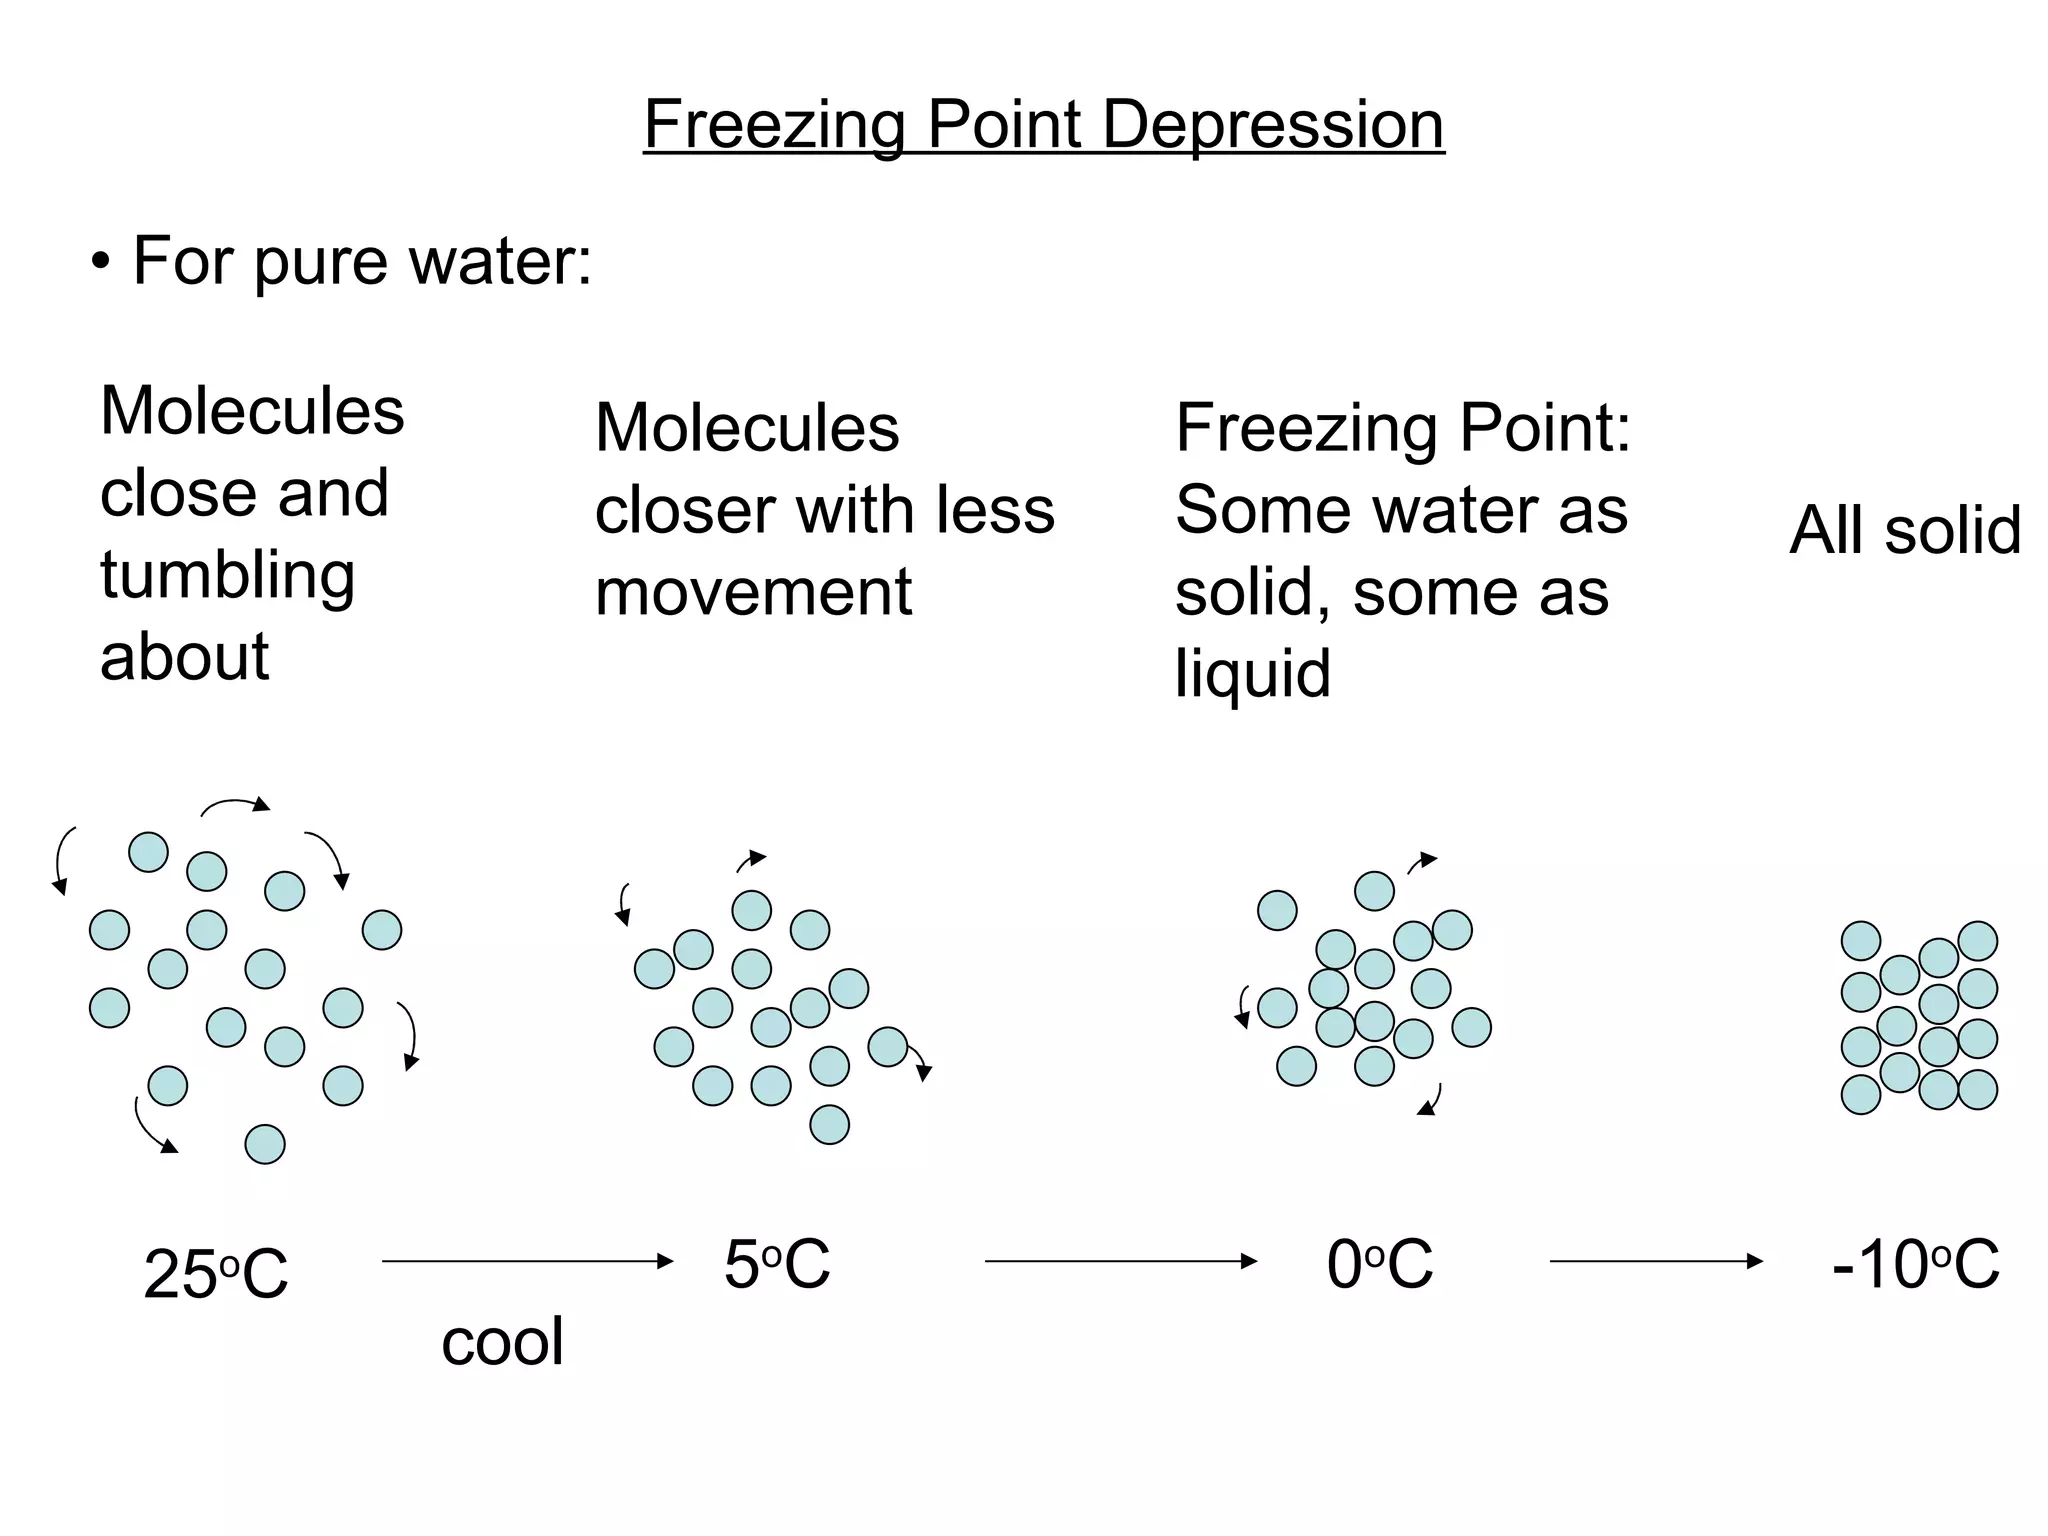
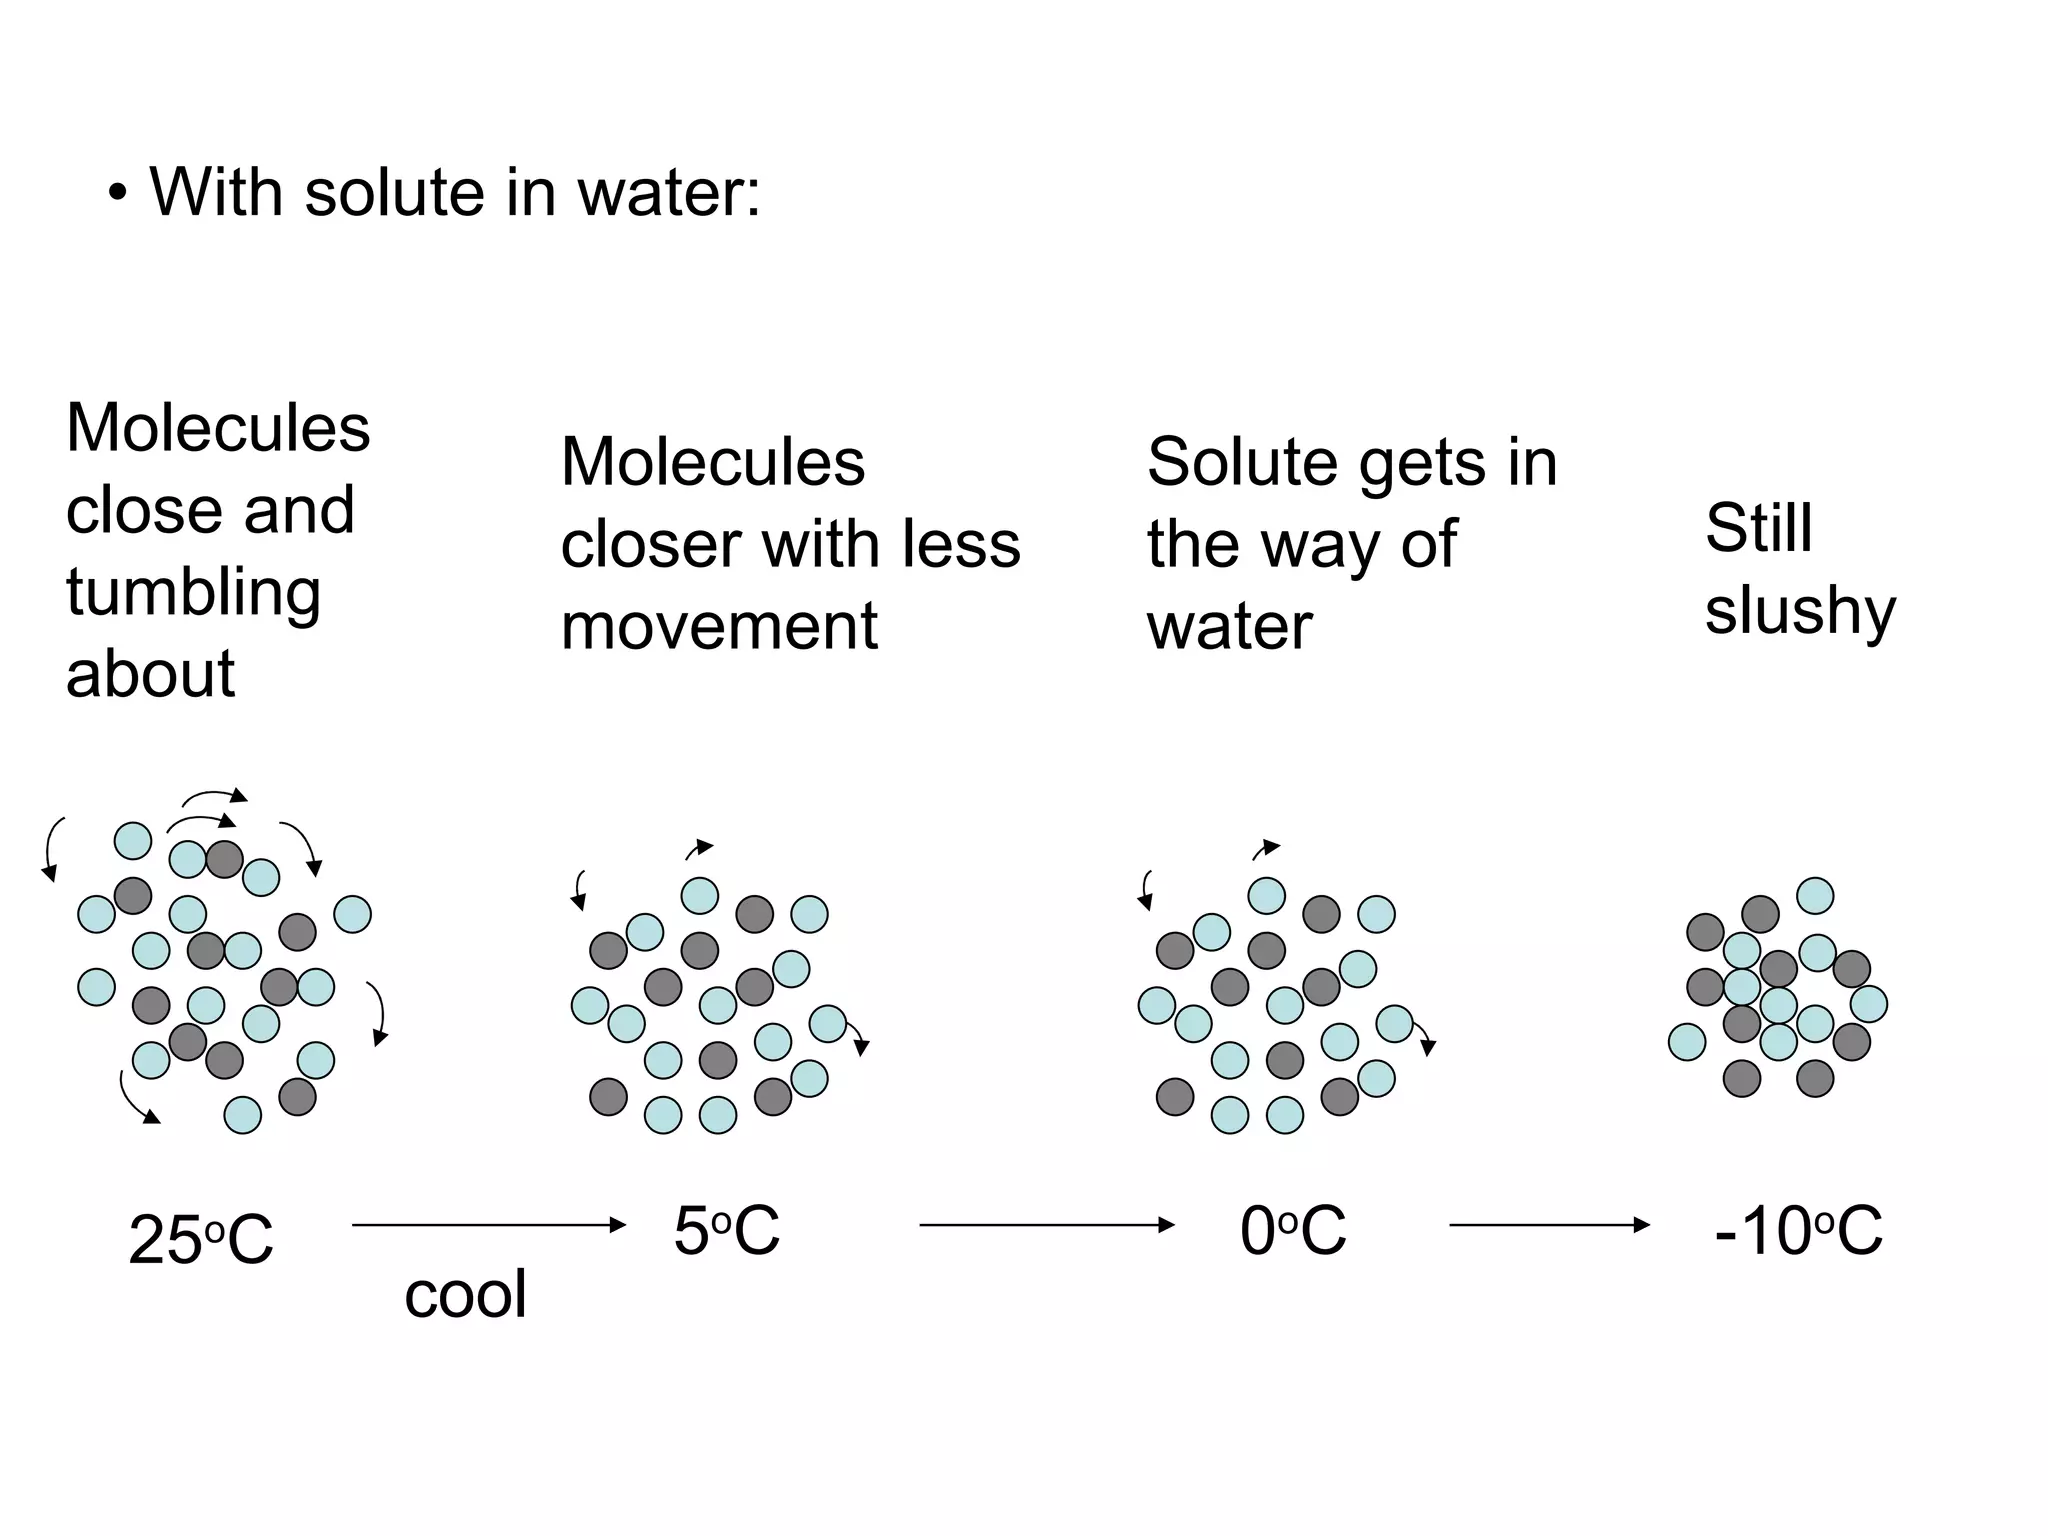
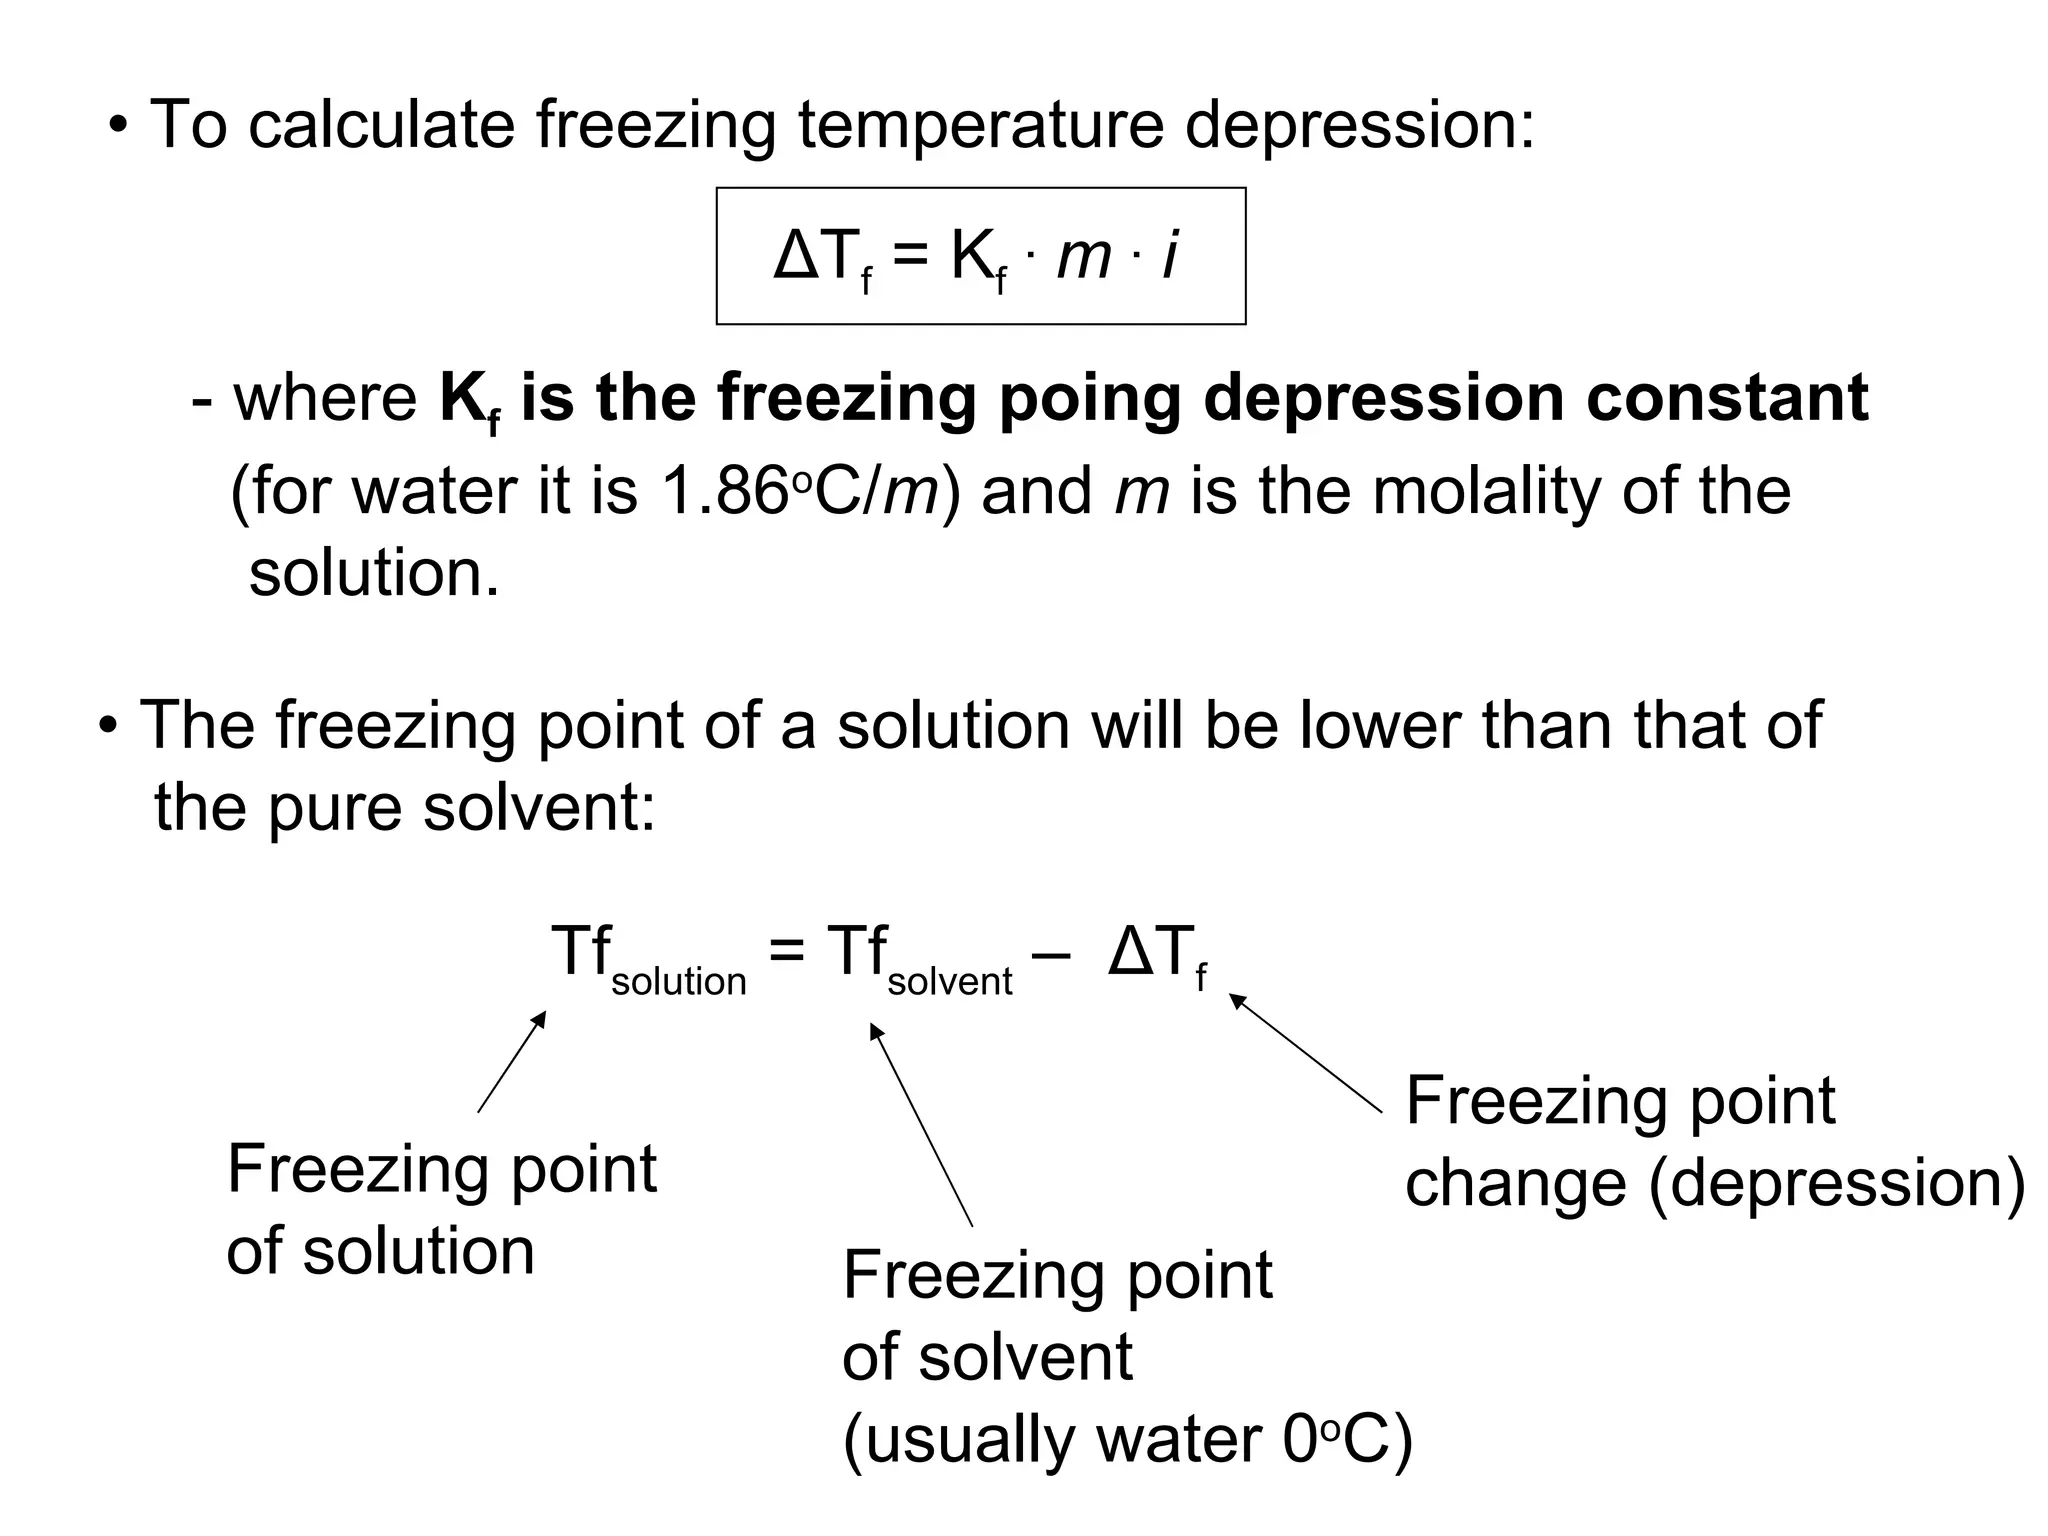
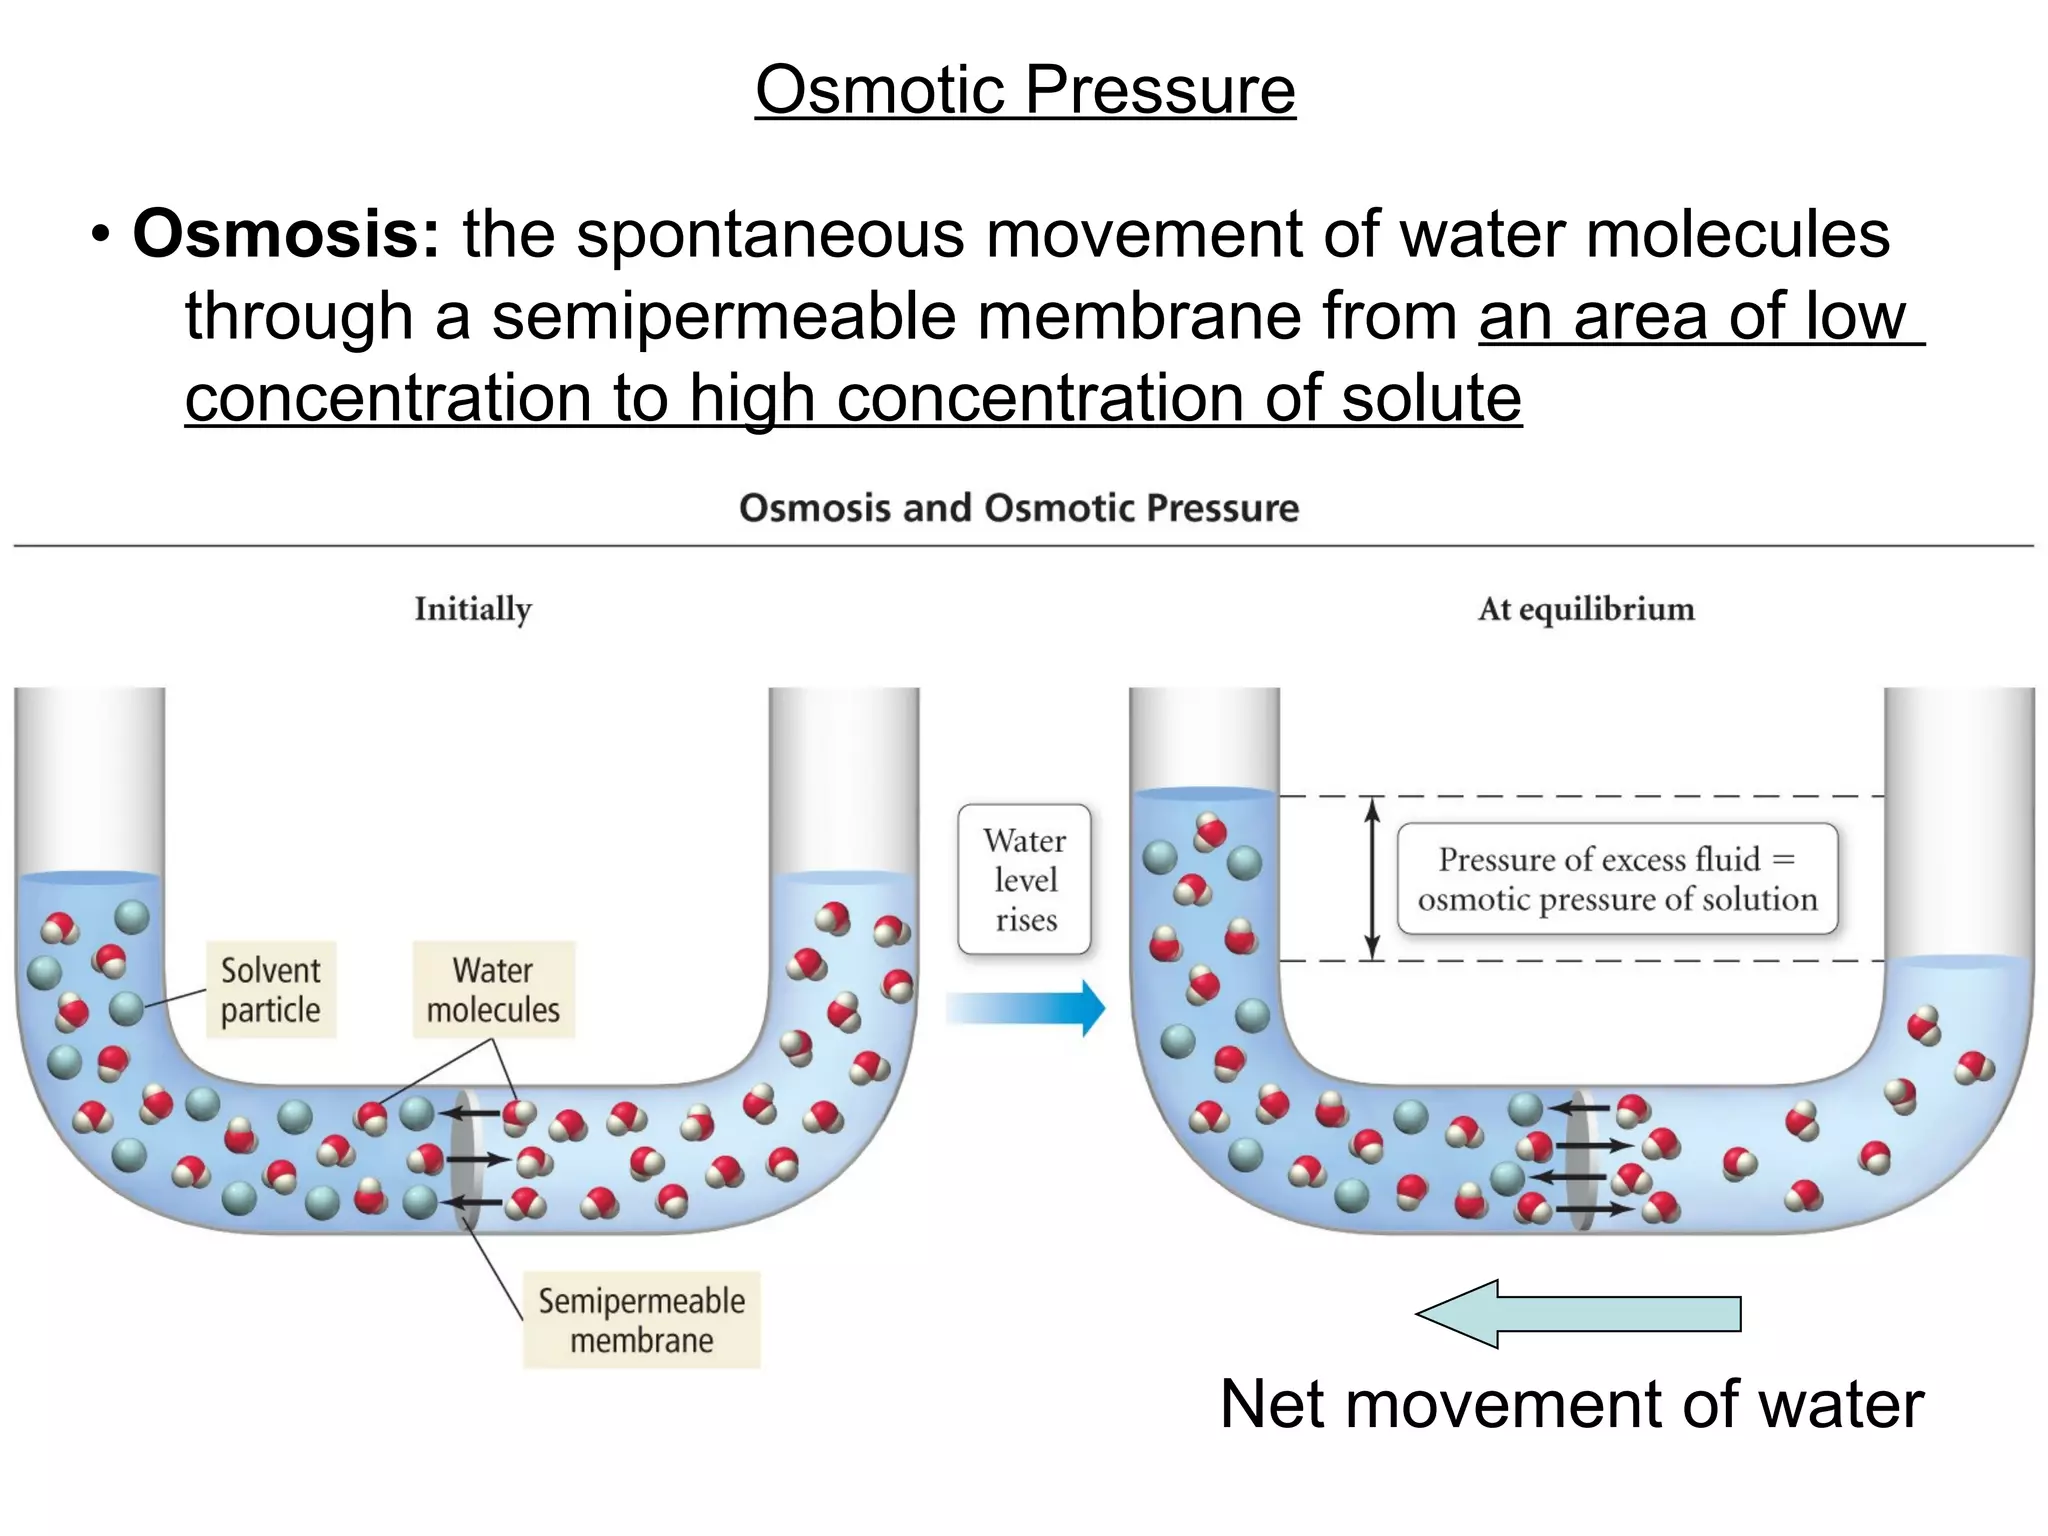
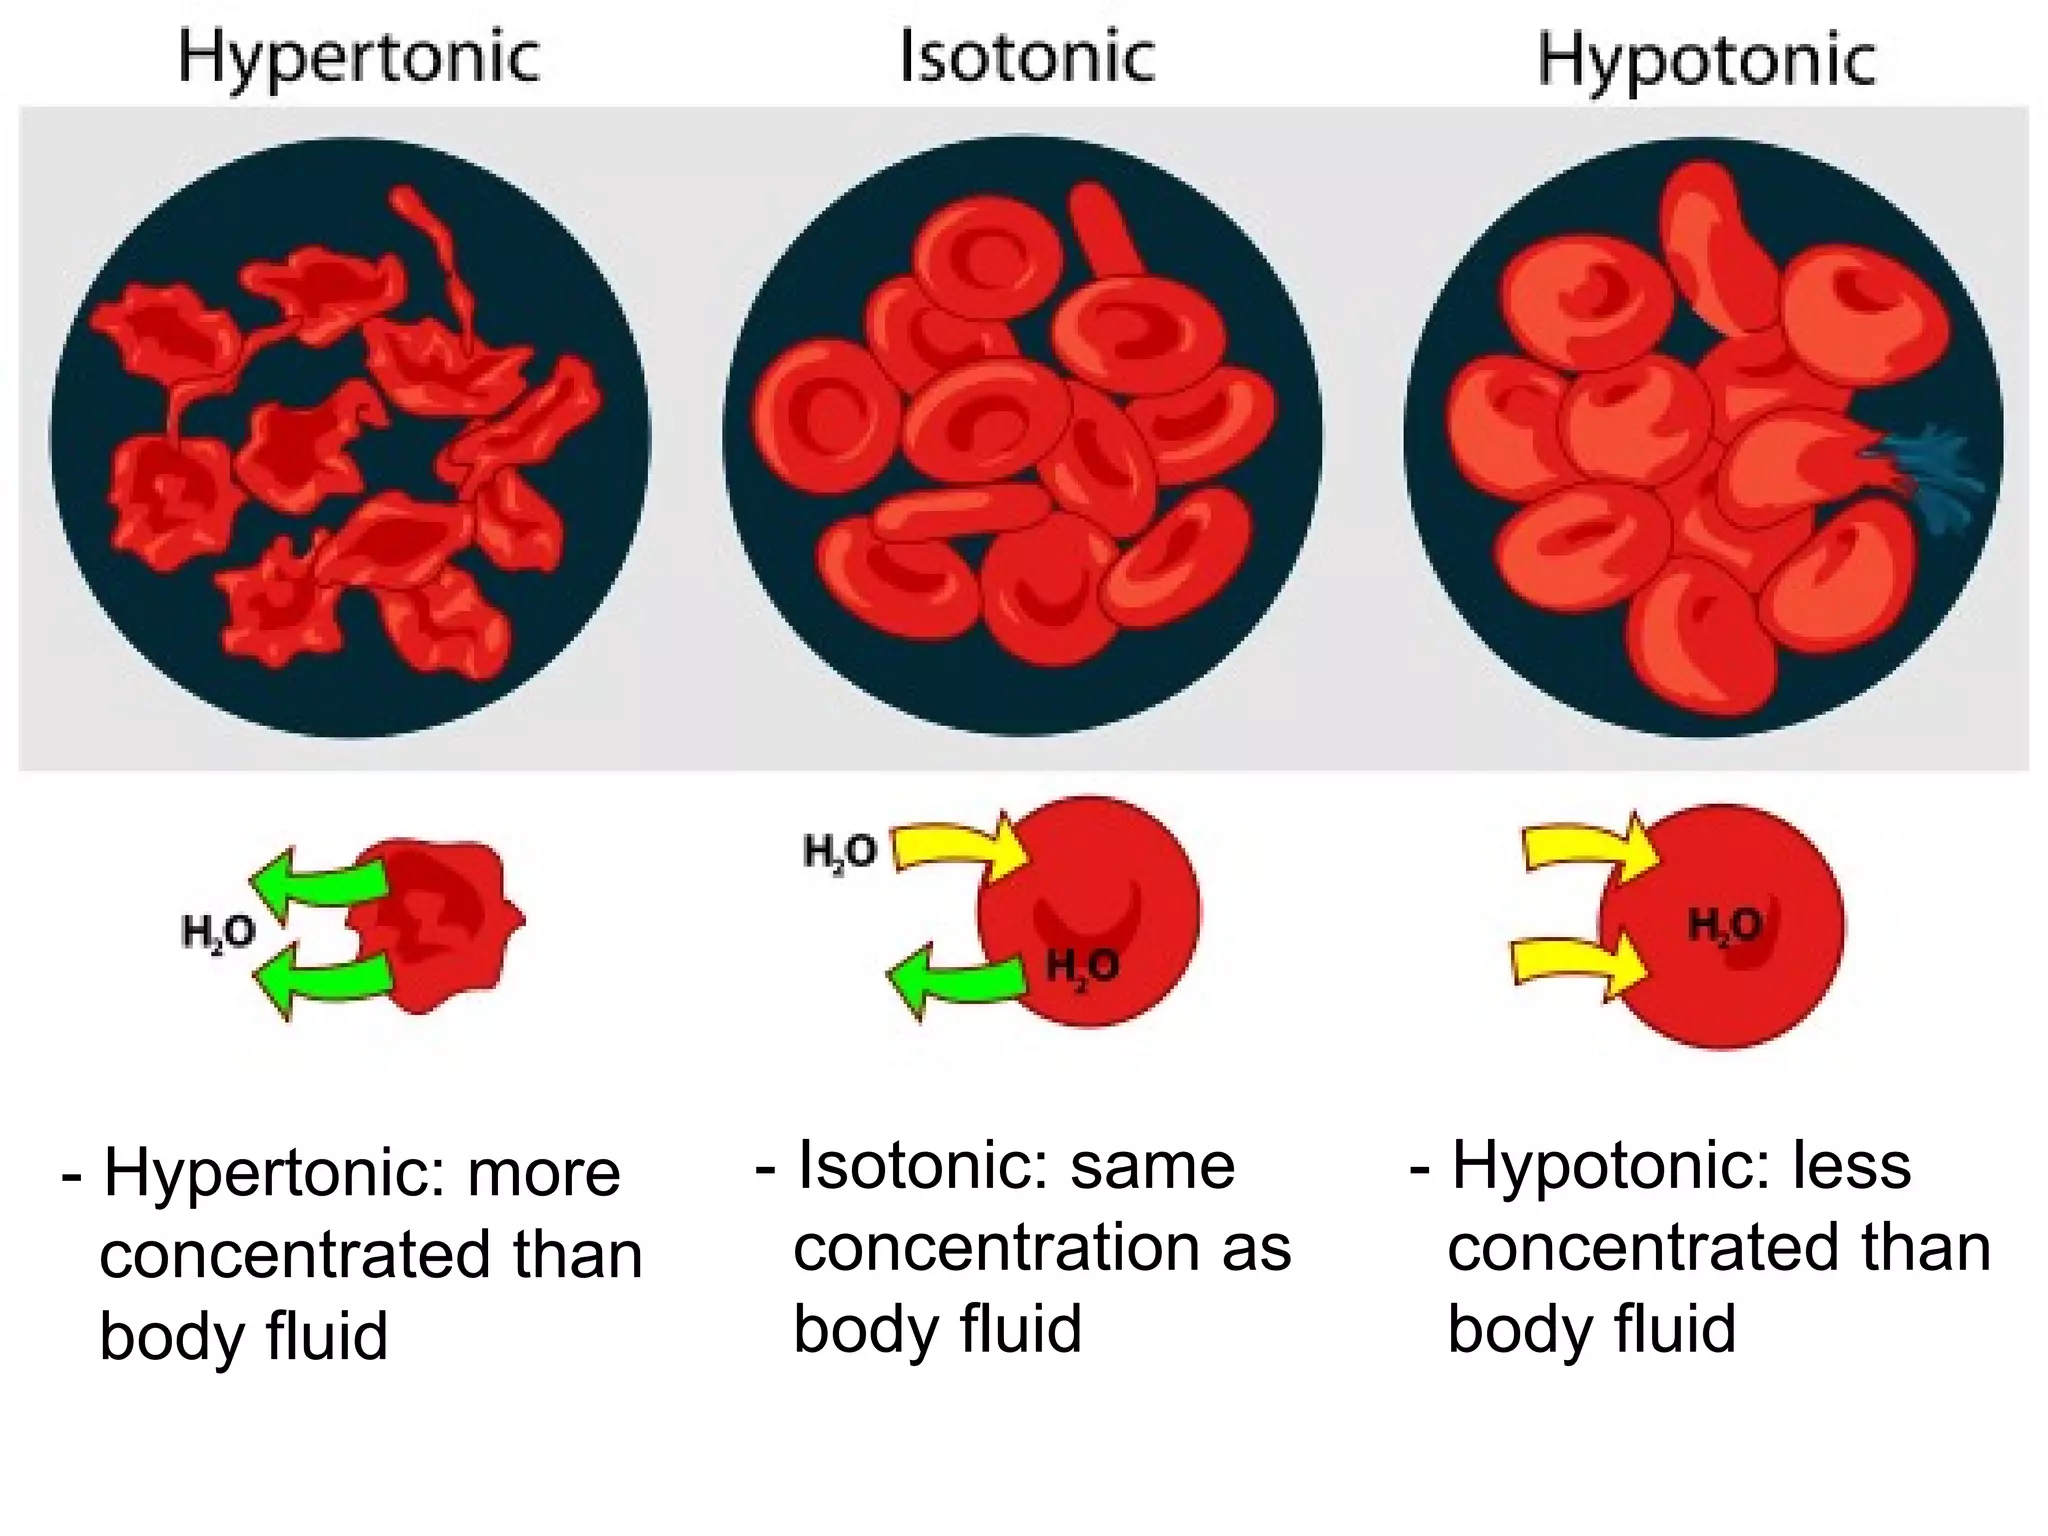
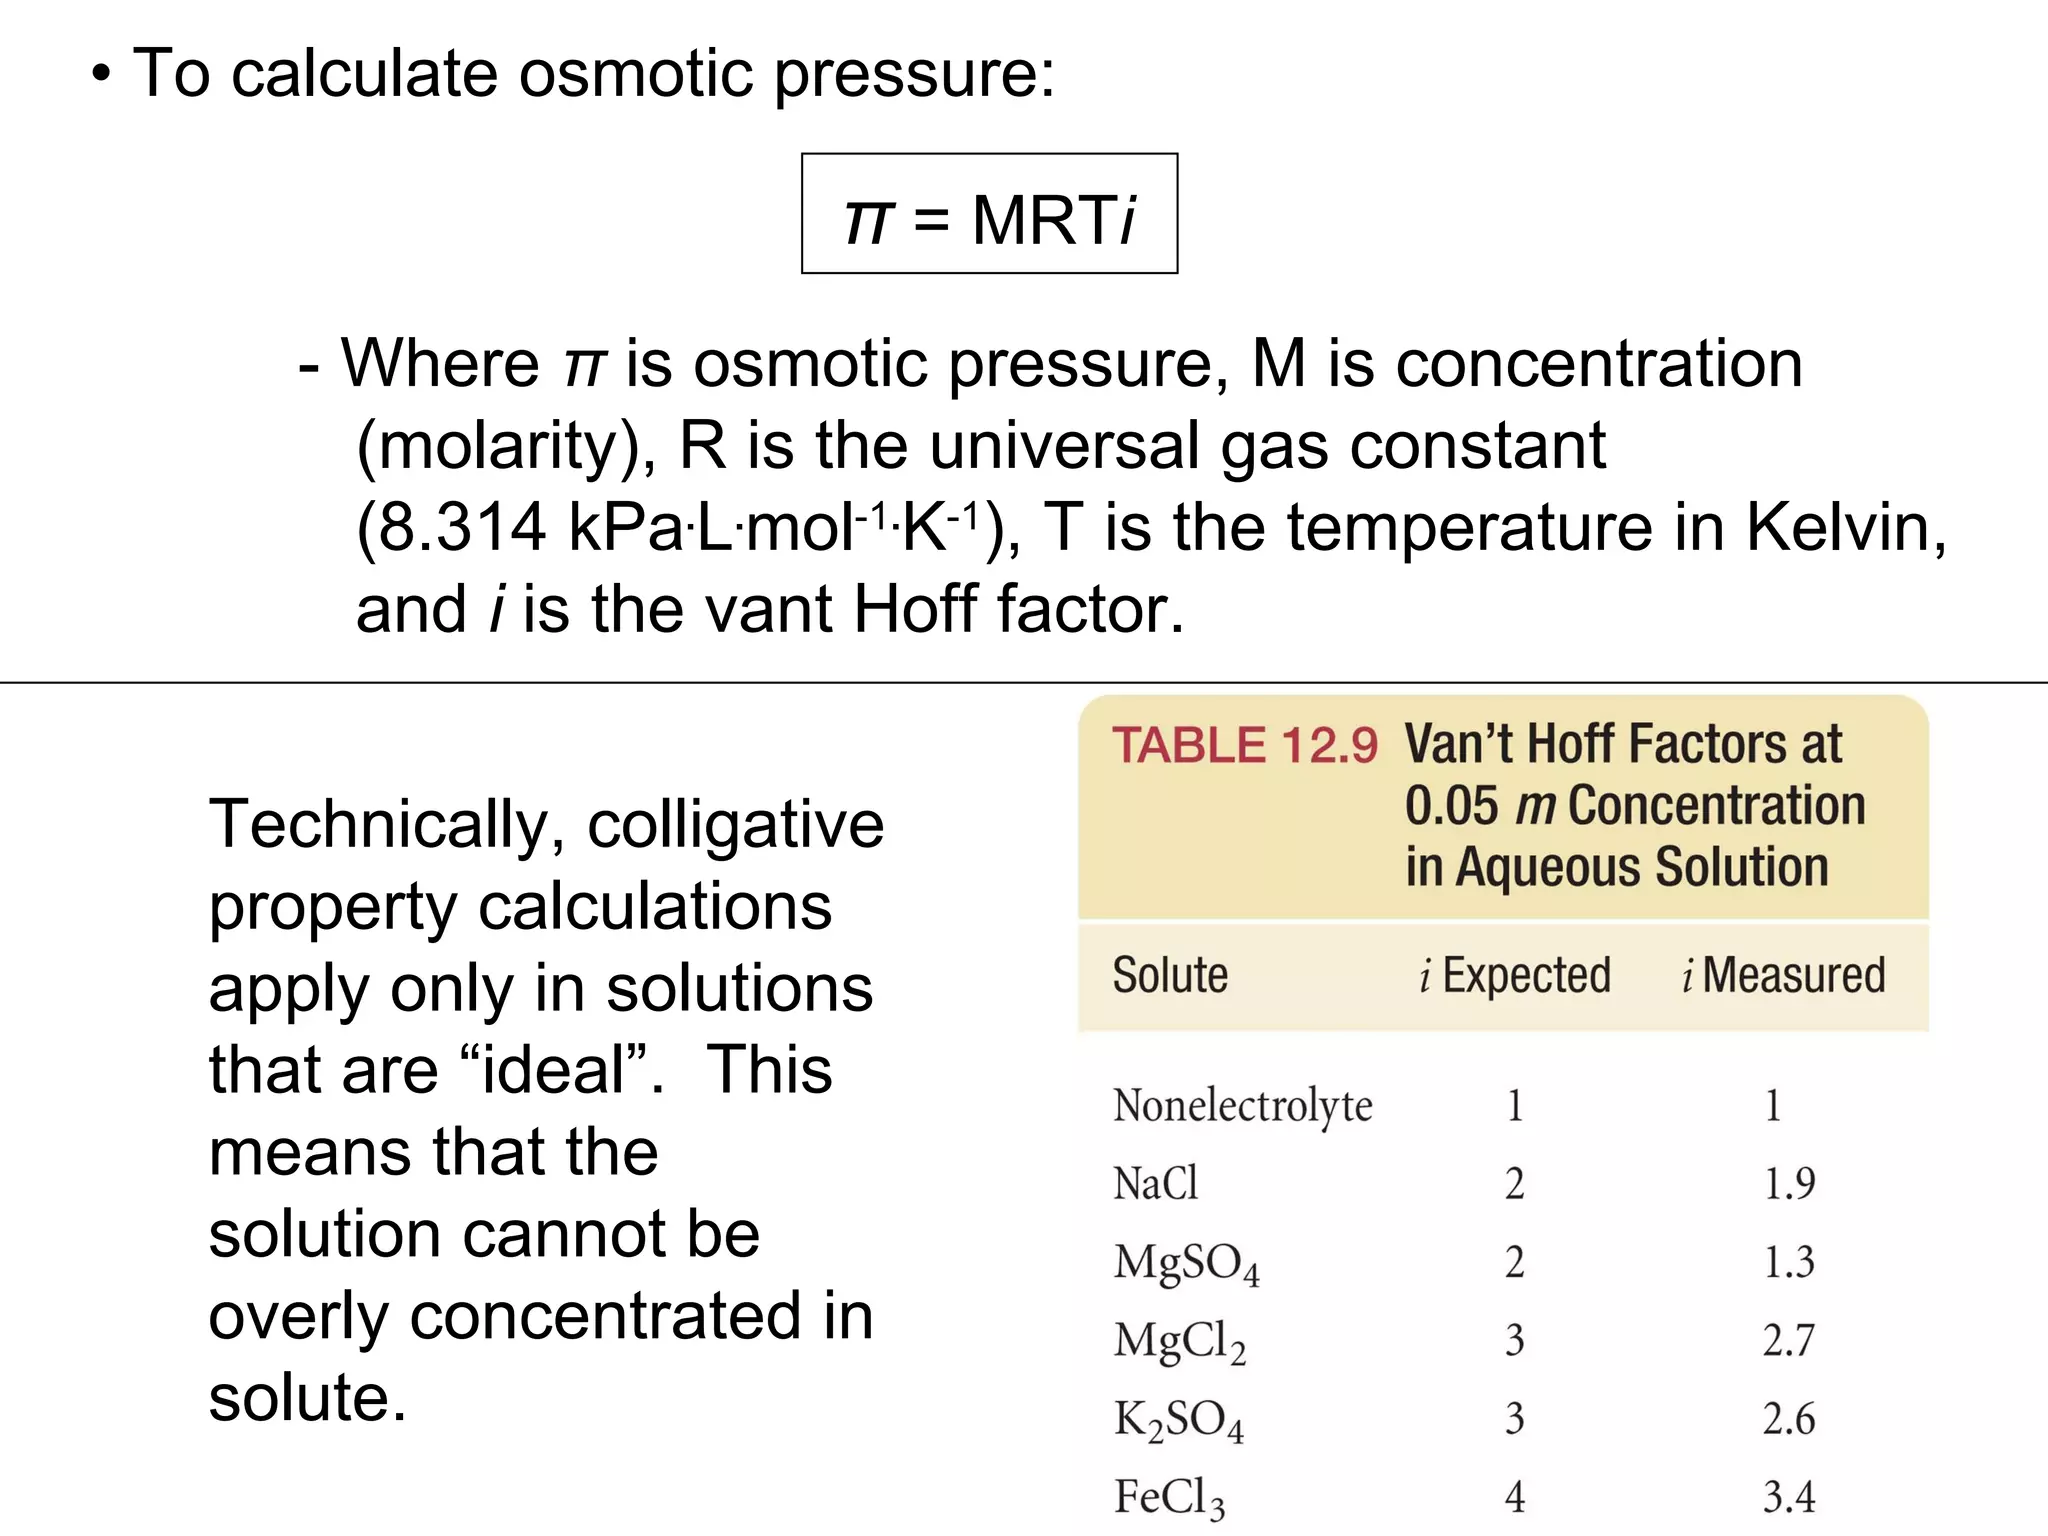
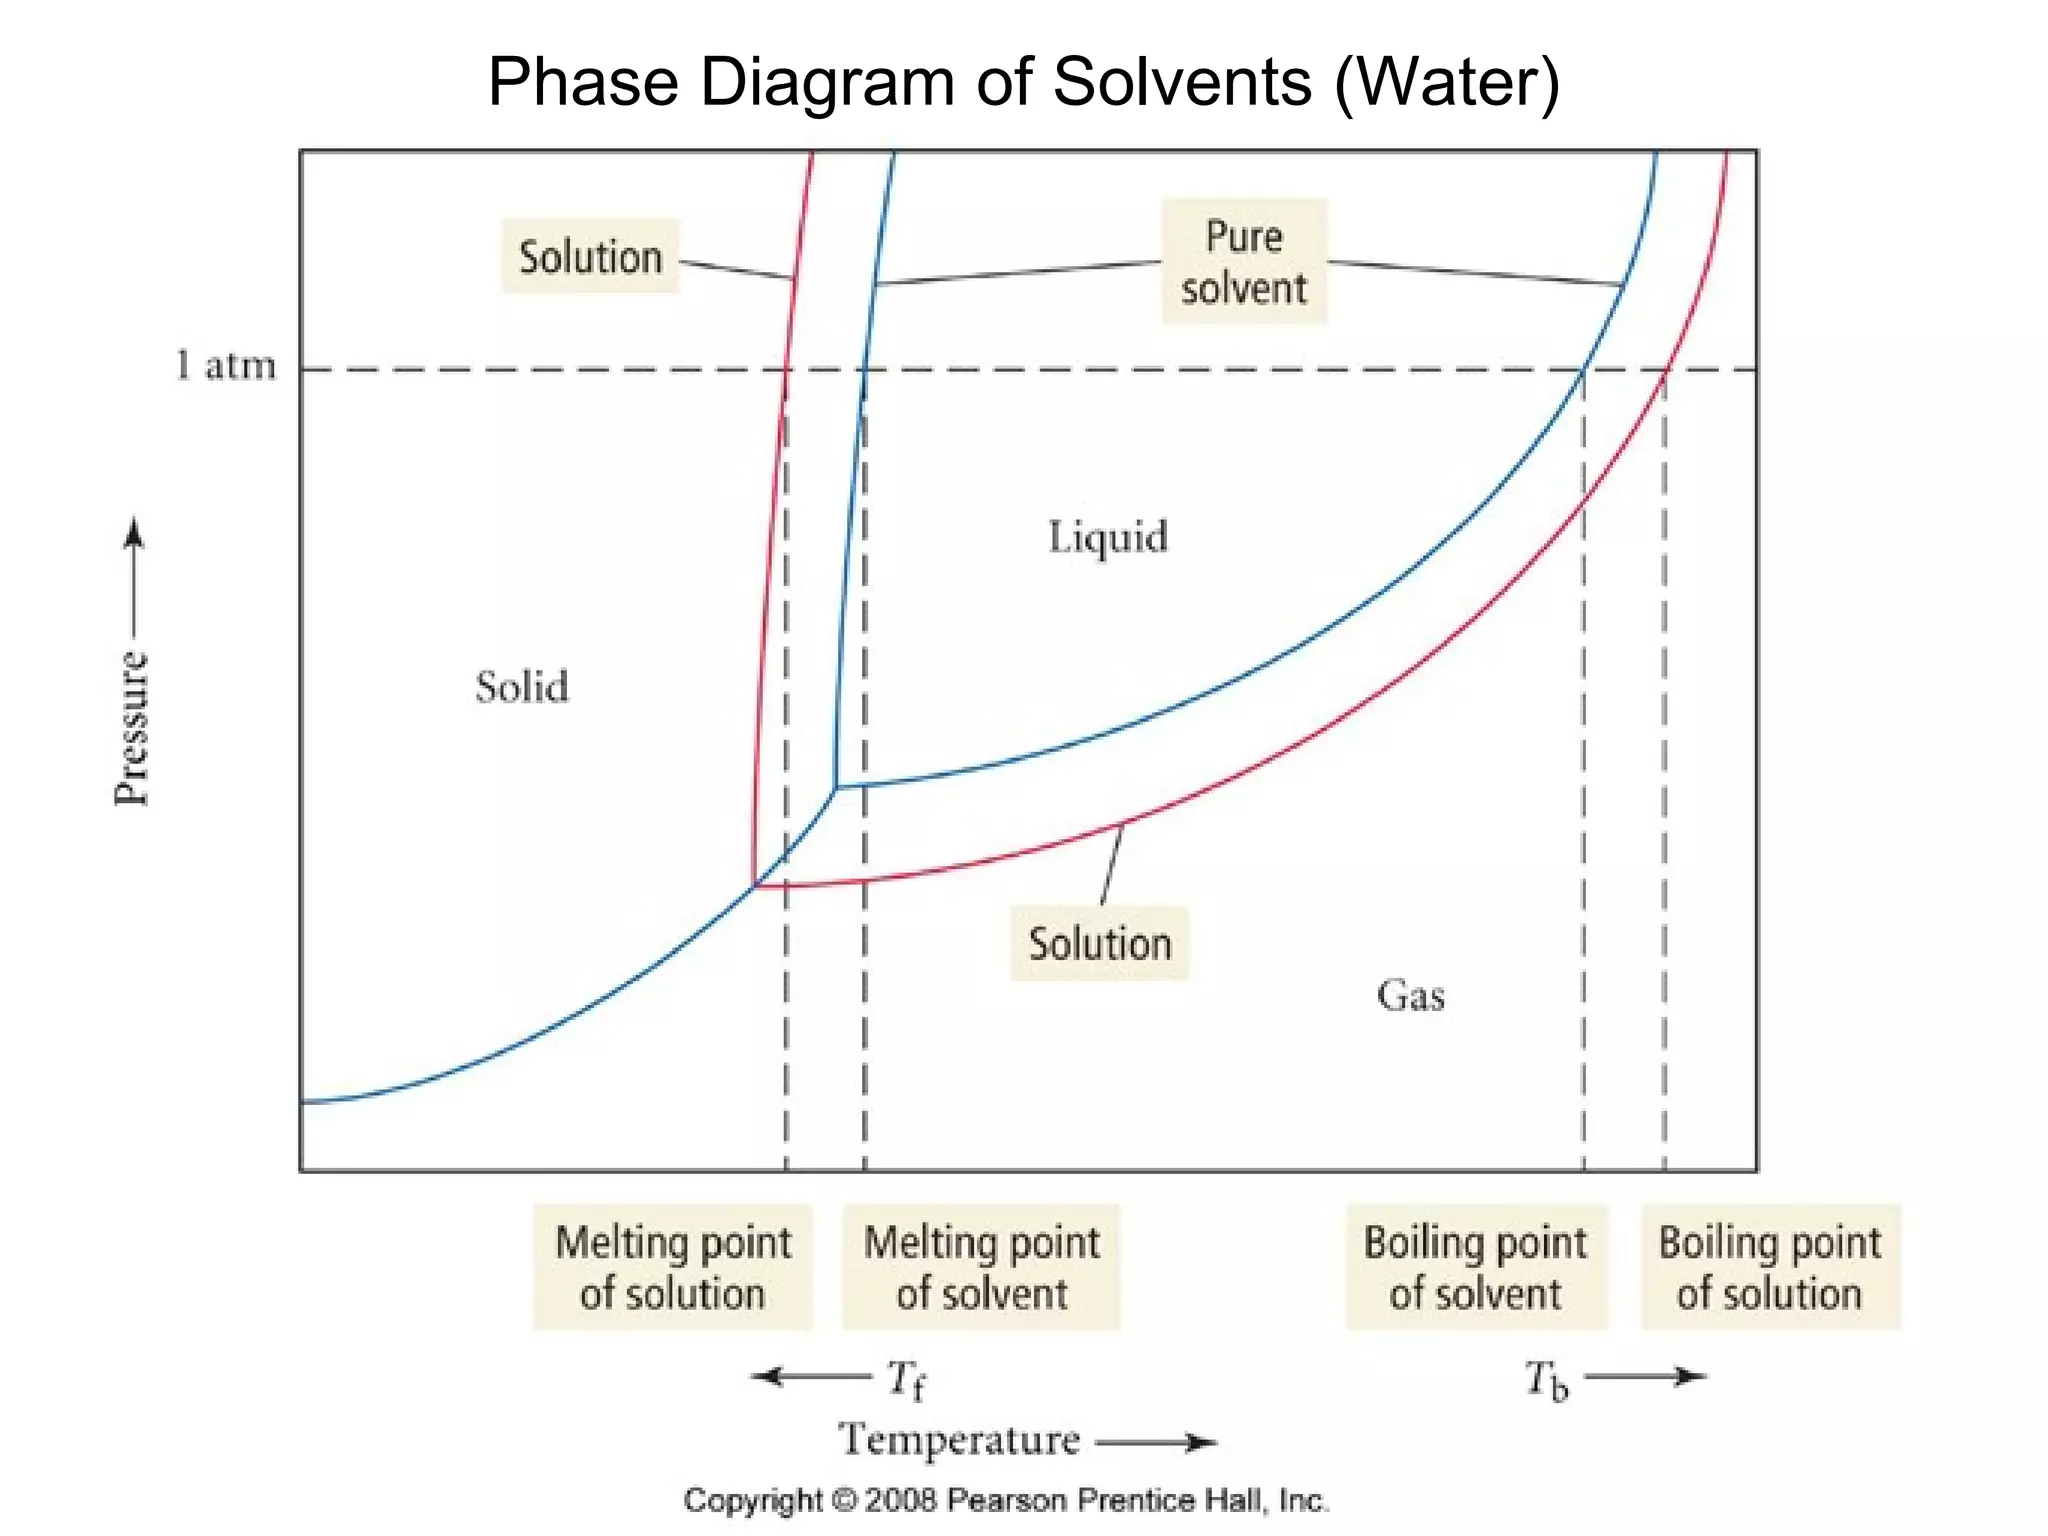
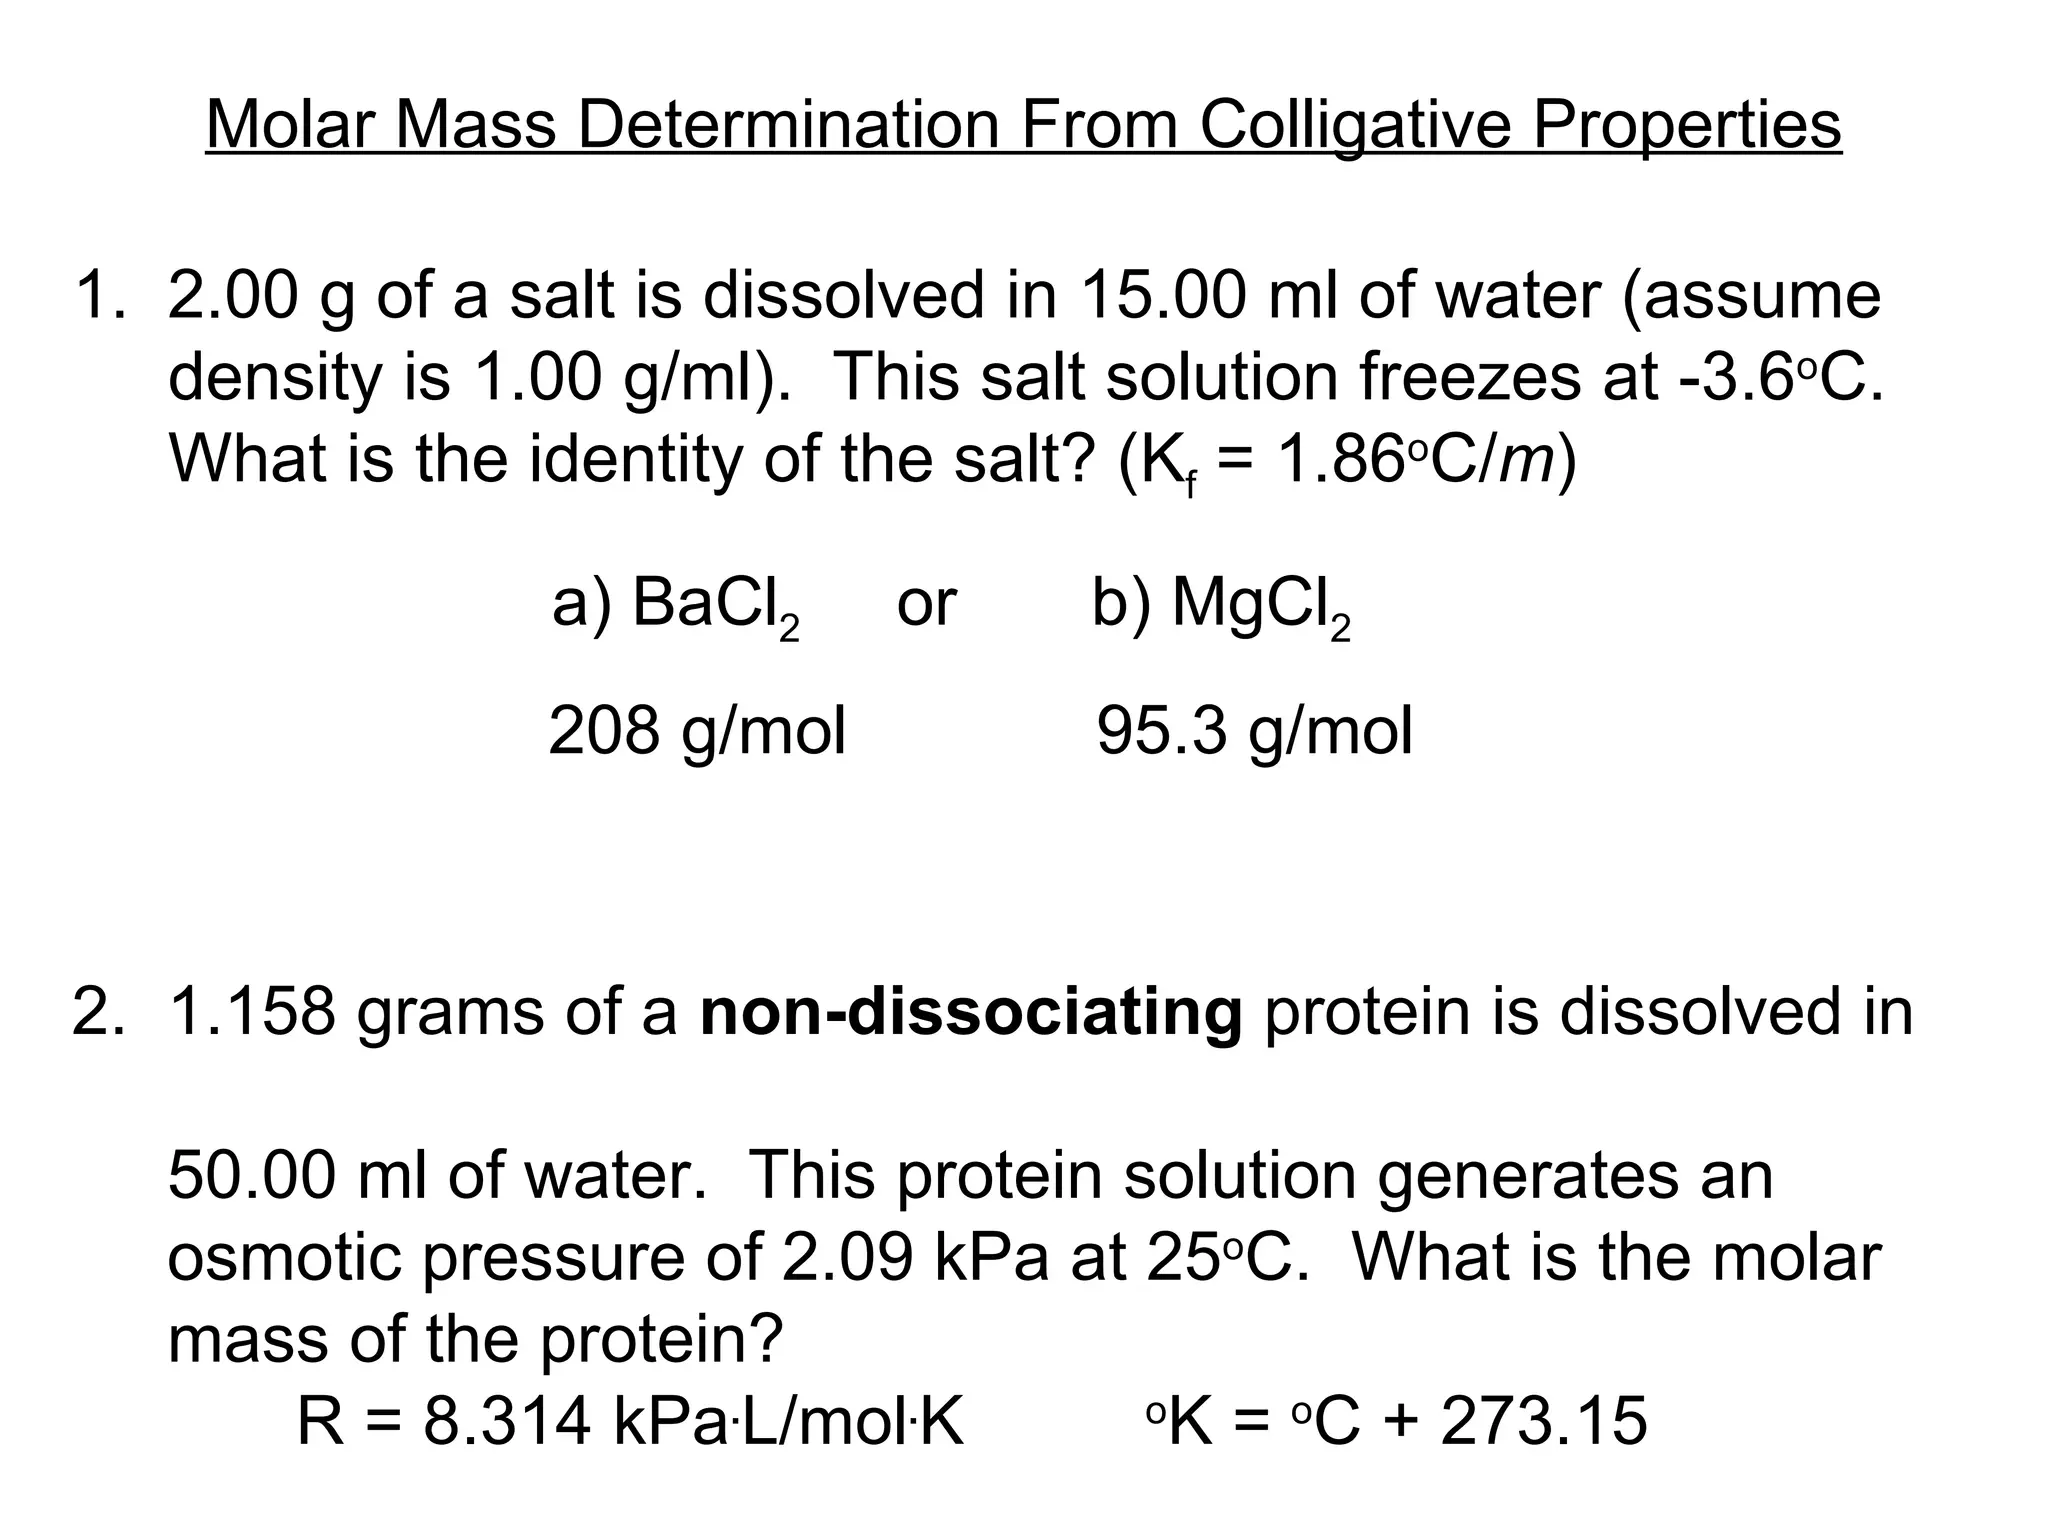
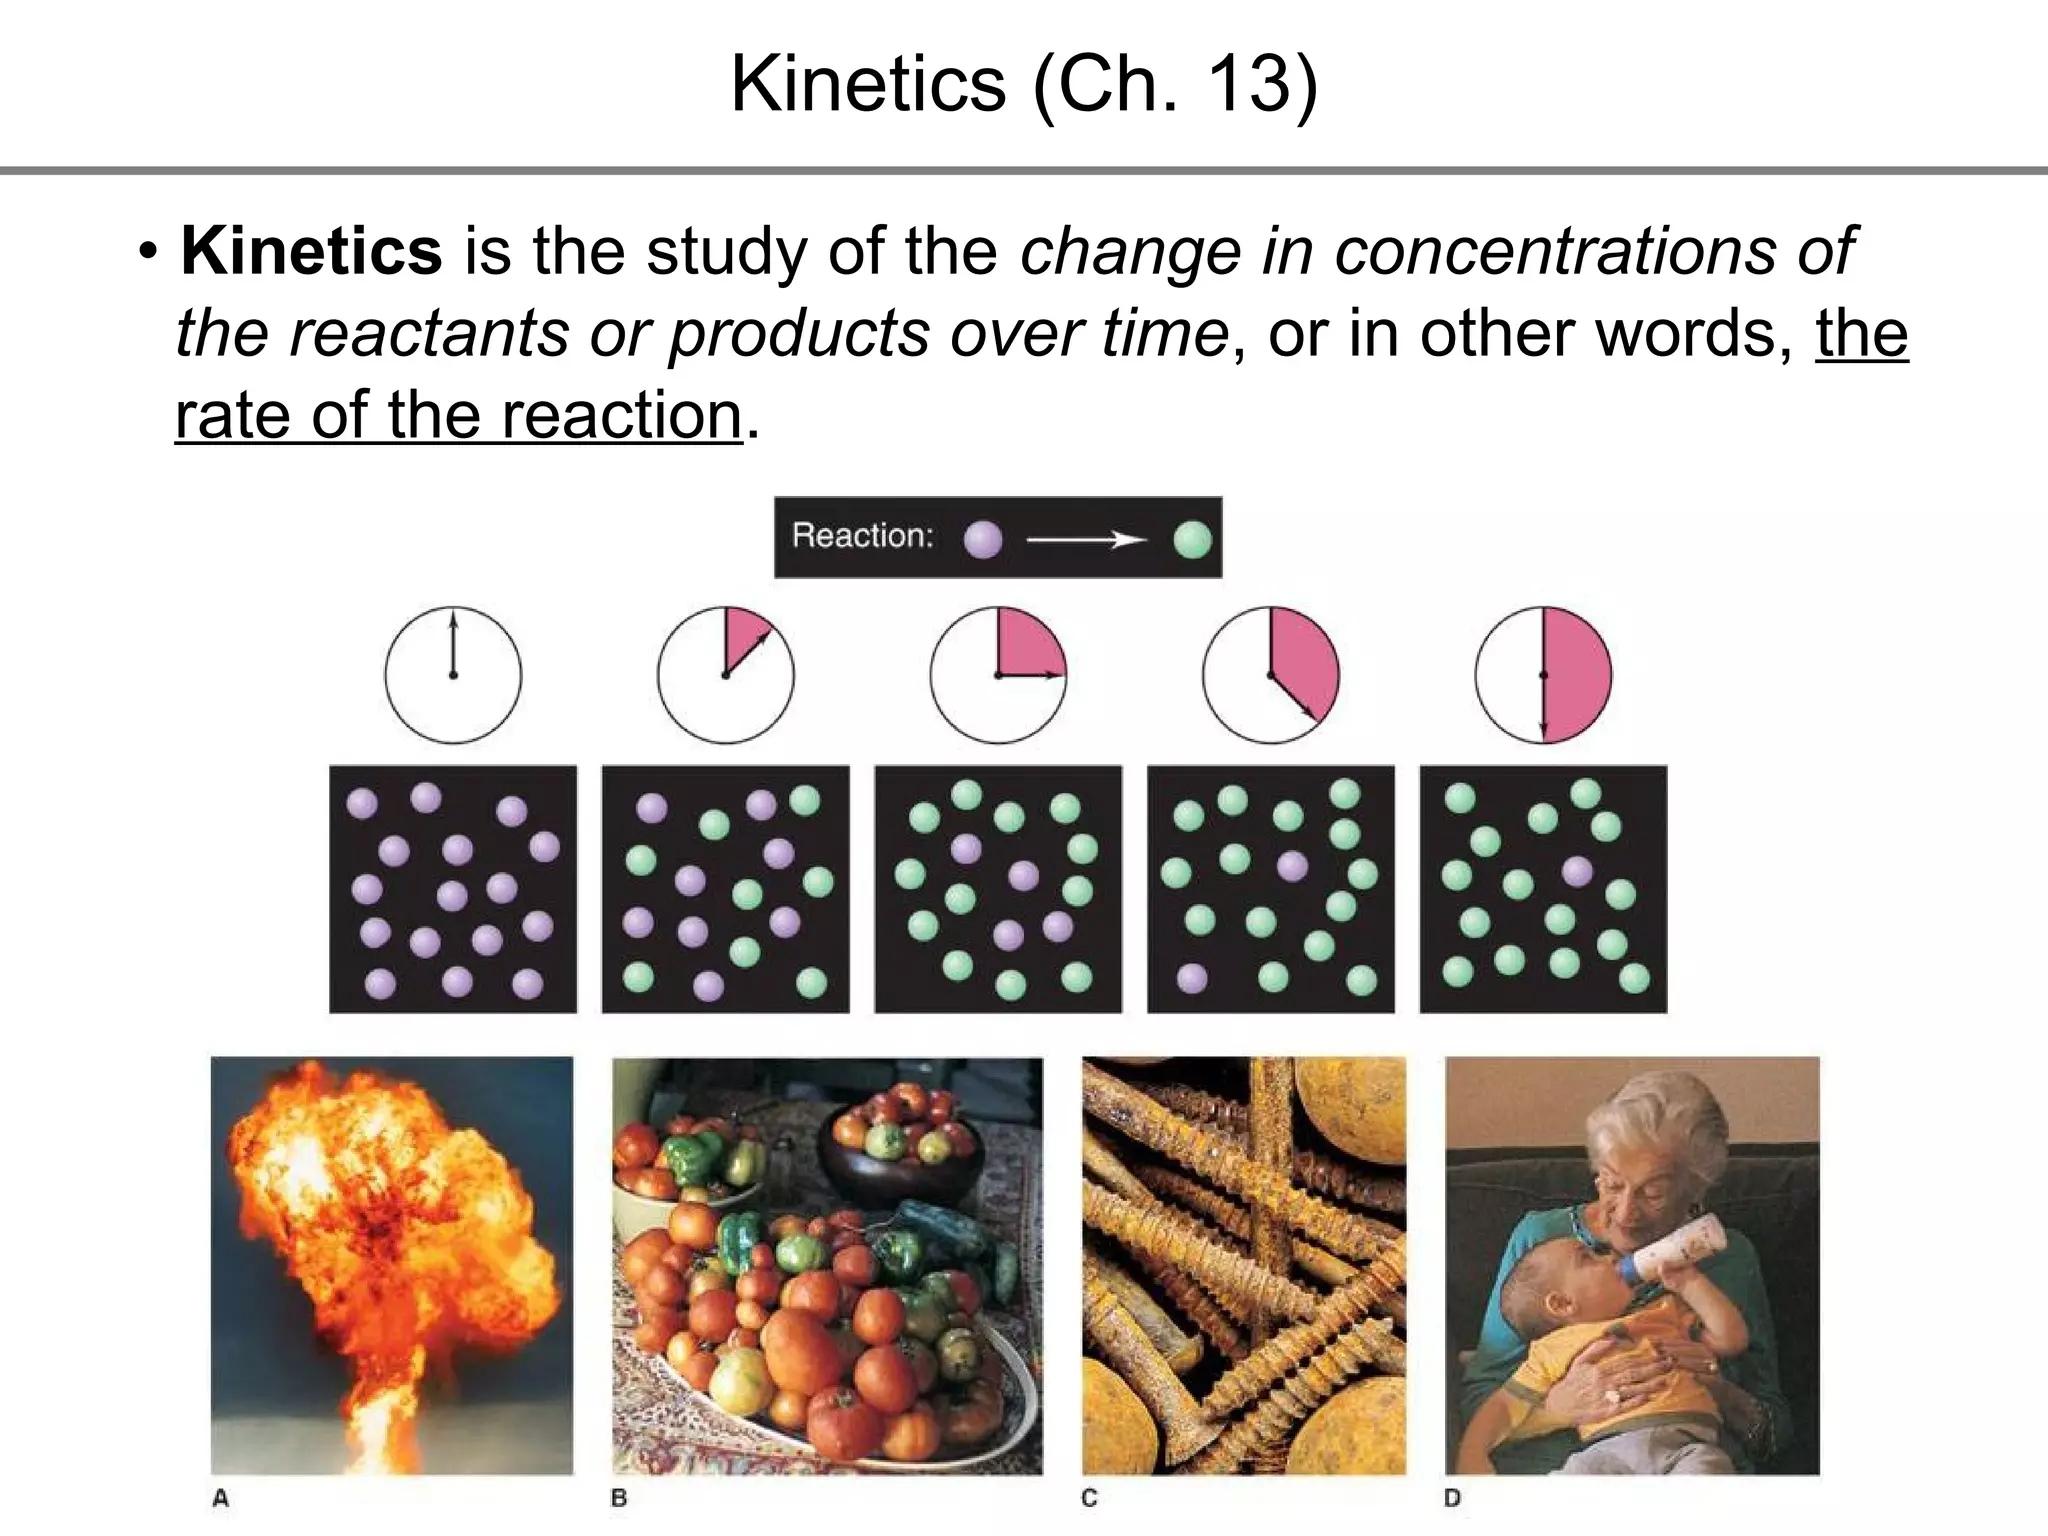
•   The  number  of solute particles, not the type, changes the  properties of a solution, called  colligative  properties. 3.  Freezing point depression 1.  Vapour pressure lowering 2.  Boiling point elevation 4.  Changes in osmotic pressure Colligative Properties (Ch. 12.7) Inverse Relationship
•   Vapour Pressure:   The pressure exerted by a vapour at equilibrium with its liquid in a closed system (Ch. 11) Pure liquid water Water vapour Evaporation Vapour Pressure Lowering
Water with dissolved,  non- volatile solute •   Solutes interfere with and reduce the ability of the water  molecules at the surface of the solution to escape into the  gas phase.  1. There are simply less water molecules at the surface of the solution that can escape into the gas phase compared to pure water. 2. The solute molecules interact more strongly with the water molecules, “holding” them back from evaporating into the gas state.
Vapour Pressure as a Function of Temperature Temperature Vapour Pressure 1 atm Pure Solvent Solution
•   Boiling point  is defined at the point where  the vapour  pressure of a substance equals the external pressure ,  usually that of the atmosphere.  - Since solutes lower vapour pressure, a  higher   temperature is required for a solution to equal the  external pressure Boiling Point Elevation ΔT b  = K b   .   m   .   i   •   To calculate boiling temperature elevation  ΔT b  :  - where  K b  is the boiling point elevation constant   (for water it is 0.512 o C/ m ) and  m  is the molality of the  solution.
-  i  is the  vant Hoff factor .  It represents the stoichiometry of particles produced when a compound dissolves in solution under ideal conditions Eg.  Sucrose has an  i  factor of 1 NaCl has an  i  factor of 2 MgCl 2  has an  i  factor of 3 Tb solution  =  Tb solvent  +  ΔT b   Boiling point change (elevation) Boiling point of solution Boiling point of solvent (usually water 100 o C) •  The boiling point of a solution will be higher than that of the pure solvent:
Freezing Point Depression Molecules close and tumbling about Molecules closer with less movement Freezing Point: Some water as solid, some as liquid All solid •   For pure water: 25 o C cool 5 o C 0 o C -10 o C
25 o C Molecules close and tumbling about Molecules closer with less movement Solute gets in the way of water •   With solute in water: cool 5 o C 0 o C -10 o C Still slushy
ΔT f  = K f   .   m   .   i   •   To calculate freezing temperature depression:  - where  K f  is the freezing poing depression constant   (for water it is 1.86 o C/ m ) and  m  is the molality of the  solution. Tf solution  = Tf solvent   –  ΔT f Freezing point change (depression) Freezing point of solvent (usually water 0 o C)  Freezing point of solution •  The freezing point of a solution will be lower than that of the pure solvent:
Osmotic Pressure •   Osmosis:  the spontaneous movement of water molecules  through a semipermeable membrane from  an area of low  concentration to high concentration of solute Net movement of water
- Isotonic: same concentration as body fluid - Hypertonic: more concentrated than body fluid - Hypotonic: less concentrated than body fluid
π  = MRT i •   To calculate osmotic pressure: - Where  π  is osmotic pressure, M is concentration  (molarity), R is the universal gas constant  (8.314 kPa . L . mol -1 . K -1 ), T is the temperature in Kelvin, and  i  is the vant Hoff factor. Technically, colligative property calculations apply only in solutions that are “ideal”.  This means that the solution cannot be overly concentrated in solute.
Phase Diagram of Solvents (Water)
Molar Mass Determination From Colligative Properties 1.  2.00 g of a salt is dissolved in 15.00 ml of water (assume density is 1.00 g/ml).  This salt solution freezes at -3.6 o C. What is the identity of the salt? (K f  =  1.86 o C/ m )  a) BaCl 2   or  b) MgCl 2 208 g/mol  95.3 g/mol 2.  1.158 grams of a  non-dissociating  protein is dissolved in  50.00 ml of water.  This protein solution generates an  osmotic pressure of 2.09 kPa at 25 o C.  What is the molar  mass of the protein?  R = 8.314 kPa . L/mol . K o K =  o C + 273.15
Kinetics (Ch. 13) •  Kinetics  is the study of the  change in concentrations of  the reactants or products over time , or in other words,  the  rate of the reaction .
Time (s) Speed (km/h) 200 150 100 50 250 Car Acceleration Profiles  Car A Car B
Collision Theory/Model •  The particles  involved in a  reaction must  physically collide  with each other  with enough  energy   AND in  the proper  orientation  for a  reaction to occur
•  Reactions require that the particles/molecules collide in the  correct orientation.
•  Factors That Affect the Rate of a Reaction: 1.  The concentration of reactants:   If we have more  particles of A and B, it will increase the chance of them  colliding together, so the greater the rate of the reaction  2.  The physical state (surface area):   Certain physical  states allow for greater mixing of the reactants, thus  increasing rate of reaction 3.  Temperature:   Not all collisions result in a reaction.  The energy of the collision must surpass the activation energy. 4.  Catalysts:  A substance that increases the rate of the chemical reaction but is not consumed by the reaction. Catalysts can be  homogeneous or heterogeneous .
Reaction Progress Diagram •  Since catalysts are not consumed during the reaction, they  are typically written above the reaction arrow. A B A catalyst increases the rate of a reaction by lowering the E a Δ H rxn  = enthalpy of reaction E a  = activation energy C 2 H 4 (g)  +  H 2 (g)     C 2 H 6 (g) Ni Eg.
•  Expressing Reaction Rate (of Reactants and Products) -   Rate is defined as a change in some variable per unit of time. - If we measure the change in concentration of  A  over  time, we can determine its reaction rate. Take the reaction  A    B =  =  [  ], square brackets are short-hand notation for concentration Δ [A] Δ t [A] 2  - [A] 1 t 2  – t 1 There is a minus sign since A is disappearing in the reaction change in [A] change in time
- Alternatively, we could have also measured the rate of change in B.  Since B is being produced, its change is positive Reaction A    B Finally, in this particular example.  Since reactants disappear, the change is  negative Since products are produced, the change is  positive . Δ [A] Δ t Therefore rate = And is measured in  units of M/time ( mol . L -1 . time -1 ) Δ [B] Δ t Δ [A] Δ t =
•   For any general reaction of say a A  +  b B     c C  +  d D - Where the italicized letter is the stoichiometric coefficient - The  rate expression  of all reactants and products would be: Rate =  Δ [B] Δ t Δ [A] Δ t = Δ [D] Δ t Δ [C] Δ t = 1 a 1 b = 1 c 1 d
C 2 H 4 (g) + O 3 (g)     C 2 H 4 O(g) + O 2 (g) - For the reaction: - The concentration of ozone ( O 3 ) is monitored over time, at 10.0 second intervals. •  Some Real Kinetics Data and Graphing
Measuring the disappearance of  O 3 (g)  - Average Rate: rate over a  period of time - Instantaneous Rate:  rate at one  time Slope of a line on this graph  is also equal  to the rate

Nyb F09 Unit 2 Slides 1 25

  • 1.
    The number of solute particles, not the type, changes the properties of a solution, called colligative properties. 3. Freezing point depression 1. Vapour pressure lowering 2. Boiling point elevation 4. Changes in osmotic pressure Colligative Properties (Ch. 12.7) Inverse Relationship
  • 2.
    Vapour Pressure: The pressure exerted by a vapour at equilibrium with its liquid in a closed system (Ch. 11) Pure liquid water Water vapour Evaporation Vapour Pressure Lowering
  • 3.
    Water with dissolved, non- volatile solute • Solutes interfere with and reduce the ability of the water molecules at the surface of the solution to escape into the gas phase. 1. There are simply less water molecules at the surface of the solution that can escape into the gas phase compared to pure water. 2. The solute molecules interact more strongly with the water molecules, “holding” them back from evaporating into the gas state.
  • 4.
    Vapour Pressure asa Function of Temperature Temperature Vapour Pressure 1 atm Pure Solvent Solution
  • 5.
    Boiling point is defined at the point where the vapour pressure of a substance equals the external pressure , usually that of the atmosphere. - Since solutes lower vapour pressure, a higher temperature is required for a solution to equal the external pressure Boiling Point Elevation ΔT b = K b . m . i • To calculate boiling temperature elevation ΔT b : - where K b is the boiling point elevation constant (for water it is 0.512 o C/ m ) and m is the molality of the solution.
  • 6.
    - i is the vant Hoff factor . It represents the stoichiometry of particles produced when a compound dissolves in solution under ideal conditions Eg. Sucrose has an i factor of 1 NaCl has an i factor of 2 MgCl 2 has an i factor of 3 Tb solution = Tb solvent + ΔT b Boiling point change (elevation) Boiling point of solution Boiling point of solvent (usually water 100 o C) • The boiling point of a solution will be higher than that of the pure solvent:
  • 7.
    Freezing Point DepressionMolecules close and tumbling about Molecules closer with less movement Freezing Point: Some water as solid, some as liquid All solid • For pure water: 25 o C cool 5 o C 0 o C -10 o C
  • 8.
    25 o CMolecules close and tumbling about Molecules closer with less movement Solute gets in the way of water • With solute in water: cool 5 o C 0 o C -10 o C Still slushy
  • 9.
    ΔT f = K f . m . i • To calculate freezing temperature depression: - where K f is the freezing poing depression constant (for water it is 1.86 o C/ m ) and m is the molality of the solution. Tf solution = Tf solvent – ΔT f Freezing point change (depression) Freezing point of solvent (usually water 0 o C) Freezing point of solution • The freezing point of a solution will be lower than that of the pure solvent:
  • 10.
    Osmotic Pressure • Osmosis: the spontaneous movement of water molecules through a semipermeable membrane from an area of low concentration to high concentration of solute Net movement of water
  • 11.
    - Isotonic: sameconcentration as body fluid - Hypertonic: more concentrated than body fluid - Hypotonic: less concentrated than body fluid
  • 12.
    π =MRT i • To calculate osmotic pressure: - Where π is osmotic pressure, M is concentration (molarity), R is the universal gas constant (8.314 kPa . L . mol -1 . K -1 ), T is the temperature in Kelvin, and i is the vant Hoff factor. Technically, colligative property calculations apply only in solutions that are “ideal”. This means that the solution cannot be overly concentrated in solute.
  • 13.
    Phase Diagram ofSolvents (Water)
  • 14.
    Molar Mass DeterminationFrom Colligative Properties 1. 2.00 g of a salt is dissolved in 15.00 ml of water (assume density is 1.00 g/ml). This salt solution freezes at -3.6 o C. What is the identity of the salt? (K f = 1.86 o C/ m ) a) BaCl 2 or b) MgCl 2 208 g/mol 95.3 g/mol 2. 1.158 grams of a non-dissociating protein is dissolved in 50.00 ml of water. This protein solution generates an osmotic pressure of 2.09 kPa at 25 o C. What is the molar mass of the protein? R = 8.314 kPa . L/mol . K o K = o C + 273.15
  • 15.
    Kinetics (Ch. 13)• Kinetics is the study of the change in concentrations of the reactants or products over time , or in other words, the rate of the reaction .
  • 16.
    Time (s) Speed(km/h) 200 150 100 50 250 Car Acceleration Profiles Car A Car B
  • 17.
    Collision Theory/Model • The particles involved in a reaction must physically collide with each other with enough energy AND in the proper orientation for a reaction to occur
  • 18.
    • Reactionsrequire that the particles/molecules collide in the correct orientation.
  • 19.
    • FactorsThat Affect the Rate of a Reaction: 1. The concentration of reactants: If we have more particles of A and B, it will increase the chance of them colliding together, so the greater the rate of the reaction 2. The physical state (surface area): Certain physical states allow for greater mixing of the reactants, thus increasing rate of reaction 3. Temperature: Not all collisions result in a reaction. The energy of the collision must surpass the activation energy. 4. Catalysts: A substance that increases the rate of the chemical reaction but is not consumed by the reaction. Catalysts can be homogeneous or heterogeneous .
  • 20.
    Reaction Progress Diagram• Since catalysts are not consumed during the reaction, they are typically written above the reaction arrow. A B A catalyst increases the rate of a reaction by lowering the E a Δ H rxn = enthalpy of reaction E a = activation energy C 2 H 4 (g) + H 2 (g)  C 2 H 6 (g) Ni Eg.
  • 21.
    • ExpressingReaction Rate (of Reactants and Products) - Rate is defined as a change in some variable per unit of time. - If we measure the change in concentration of A over time, we can determine its reaction rate. Take the reaction A  B = = [ ], square brackets are short-hand notation for concentration Δ [A] Δ t [A] 2 - [A] 1 t 2 – t 1 There is a minus sign since A is disappearing in the reaction change in [A] change in time
  • 22.
    - Alternatively, wecould have also measured the rate of change in B. Since B is being produced, its change is positive Reaction A  B Finally, in this particular example. Since reactants disappear, the change is negative Since products are produced, the change is positive . Δ [A] Δ t Therefore rate = And is measured in units of M/time ( mol . L -1 . time -1 ) Δ [B] Δ t Δ [A] Δ t =
  • 23.
    For any general reaction of say a A + b B  c C + d D - Where the italicized letter is the stoichiometric coefficient - The rate expression of all reactants and products would be: Rate = Δ [B] Δ t Δ [A] Δ t = Δ [D] Δ t Δ [C] Δ t = 1 a 1 b = 1 c 1 d
  • 24.
    C 2 H4 (g) + O 3 (g)  C 2 H 4 O(g) + O 2 (g) - For the reaction: - The concentration of ozone ( O 3 ) is monitored over time, at 10.0 second intervals. • Some Real Kinetics Data and Graphing
  • 25.
    Measuring the disappearanceof O 3 (g) - Average Rate: rate over a period of time - Instantaneous Rate: rate at one time Slope of a line on this graph is also equal to the rate

Editor's Notes

  • #3 At a particular temperature, water will have a certain ability to evaporate. This ability of water to evaporate into gas vapor generates something called vapor pressure . As we increase temperature, water’s ability to evaporate increases. As the rate of evaporation increases, the vapor pressure increases. Therefore, vapor pressure is dependant on temperature . In the diagram, the water molecules in the liquid phase can be seen by eye. What we can’t see by eye is that some of the water molecules at the surface are evaporating into the gas phase, becoming water vapor. Again, the evaporating water generates a certain amount of vapor pressure at the given temperature.
  • #4 Because water has the ability to form a gas phase, it is considered to be volatile . For the solutions we are about to consider, the solutes will always be non-volatile substances that do not have the ability to evaporate (at least not at temperatures < 100oC).
  • #5 Since vapour pressure is lowered in solutions, it takes a higher temperature to achieve the same vapour pressure. The solution vapour pressure line would be perfectly parallel to the pure solvent line, but shifted over to higher temperatures.
  • #6 We all know that water boils at 100oC under normal circumstances (at sea level), but if you were on top of Mount Everest, water would boil at only 74oC! What is different at these locations that cause this dramatic difference? The atmospheric pressure is changing.
  • #7 Eg. Sucrose is a molecular compound that does not dissociate when it dissolves in water (a non-electrolyte). H2O Chemically: sucrose(s)  sucrose(aq) A 1.0 m solution of sucrose would have a ΔTb = 0.512oC/m x 1.0 m = 0.512oC Using the equation, Tbsolution = 100.512oC for 1.0 m sucrose(aq). As you can see, the boiling point elevation is not so dramatic. What would the boiling point be for a 1.0 m solution of NaCl? You may think that it would be the same as what was calculated above for sucrose. However, colligative properties are not dependent on the type of solution, but on total particles of solute in solution. NaCl, being a soluble ionic compound, dissociates into two ions, essentially creating 2 particles for every unit of NaCl. NaCl(aq)  Na+(aq) + Cl-(aq) 1.0 m 1.0 m 1.0 m From the stoichiometry, we can see that a 1.0 m solution of NaCl generates 1.0 m of Na+(aq), and 1.0 m Cl-(aq), making a total concentration of particles equaling 2.0 m (1.0 m + 1.0 m). This is why NaCl would have an i factor of 2.
  • #8 In order for the water molecules to freeze, they must be in proximity to each other to form a solid crystal structure. With so many other non-water particles in the way, the water molecules have a harder time coming together to form a solid phase.
  • #11 The amount of osmotic pressure generated by a solute can be demonstrated a U-shaped tube. There will be a net movement of water through the semipermeable membrane into the side of tube with a higher concentration of solute (panel A). The water will continue to flow into the right side of the tube until the pressure generated from the movement of water across the membrane is equal to the pressure generated by gravity. The system is now in equilibrium (panel B). If pressure is applied to the right side of the tube, it would drive the water back through the membrane (panel A; a process called reverse osmosis, often used to purify water). Osmotic pressure is defined as the pressure required to prevent the net movement of water from pure solvent to solution, and is denoted by the symbol (Greek, pi).
  • #12 ~0.9 g NaCl per 100 ml solution. .9% m/v What is the concentration of NaCl in molarity? Concentration of total solute?
  • #14 A phase diagram for a particular substance shows what phase the substance exists in for a give pressure and temperature. In our case, we can think of this diagram as representing water and aqueous solutions. The lines on the diagram define the point at which the water transitions between physical states and are called the phase boundaries . At phase boundaries, the water is both physical states equally . The middle junction is called the “triple point”. Here, water would exist as all 3 physical states at the same time. At 1 atm of pressure (normal sea-level pressure), the phase boundary between solid and liquid would of course be the freezing/melting point where for water it is 0oC. At the phase boundary between liquid and gas, it would be the boiling point of water where the temperature would be 100oC. Now, how would the phase boundaries change for that of a solution? We know that boiling point is elevated, and freezing point is depressed, so essentially, for a solution, the boundaries for it to exist as a liquid have been increased, as denoted by the dotted line.
  • #15 Question 1: The first step would be to calculate ΔTf: 0oC – (-3.6oC) = 3.6 (remember that the ΔT concerning colligative properties will always be a positive number). The tricky part of this question is the fact that we are unsure of the i factor. Therefore, some trial and error will be required in the calculations. From the possibilities, we know that i factor could be 2 (NaCl) or 3 (MgCl2 or BaCl2). Calculate the molality if unknown salt is NaCl (i = 2): m = 0.98 mol/kg Moles of salt = 0.9 mol/kg x 0.0150 kg = 0.015 mol Molar mass = 2.0 g/ 0.015 mol = 133 g/mol. It does not match the molar mass of NaCl, so a) is not the correct answer. Repeating the same calculations assuming an i factor of 3 gives a molar mass of ~206 g/mol. The closest match is BaCl2. The answer is b) Question 2: The word non-dissociating means that it does not “break apart” when dissolved in water, giving the protein an i factor of 1. Use the osmotic pressure equation to calculate concentration (M) = 8.43 x 10⁻⁴ M. Moles of protein = 8.43 x 10-4 M x 0.0500 L = 4.22 x 10⁻⁵ mol Molar mass = 1.158 g/ 4.22 x 10⁻⁵ mol = 27500 g/mol
  • #16 So far in this course, you’ve seen many chemical reactions on paper, denoted by a reaction arrow  . The conversion of reactants to products just “seems to happen” instantly. While this may be true for some reactions, it is not always the case for others. Sometimes a reaction could take a long time, maybe thousands of years, before all the reactants are converted to products. Therefore, the reaction is occurring at a certain “rate”. The bottom panel shows a) a combustion reaction, which occurs very fast, b) ripening of vegetables, c) rusting of metal, and d) aging, all of which occur very slowly.
  • #17 How quickly something happens is important in all aspects of life. Some people seem to never gain weight, potentially owing to a “fast metabolism”: the conversion of food to energy. In car racing, an acceleration profile could be fairly easily interpreted to see which car would do better in certain races. Which car would you want to drive in a quarter-mile drag race? The blue car can definitely get up to speed faster than the black car and would win a short race. However, in a longer race, the black car would eventually win since it has a much higher top speed. This car analogy applies to kinetics on a lot of fronts. The car racing itself can be very exciting! However, the interpretation of rates on charts and graphs may not be, but is very important nonetheless
  • #20 So why do reactions have different rates? To answer this, we must consider collision theory. Factor 1 is fairly obvious. Since particles must contact each other, the more there are, the greater the probability of collision. Say particle A must smash into particle B for a reaction to occur.AB1 possible collision AABB4 possible collisions Now if we increase the quantity (concentration) of reactant particles, the number of possible collisions increases exponentially. AAABBB9 possible collisions Factor 2: To demonstrate this factor, I conducted the combustion of methanol in class. The reaction can be described by the following chemical equation: CH4O(l) + O2(g)  CO2(g) + H2O(l) (unbalanced) Methanol First, 5 ml was placed in a small beaker and ignited. A bluish flame appeared above the surface. Only the methanol molecules at the surface can collide with the O2 molecules hovering above it. The molecules at the top must burn away before any other molecules can react. This increases the amount of time it will take for the methanol to completely burn away. On the other hand, 5 ml of methanol placed in a large flask and swirled onto the sides has greatly increased its exposure to O2 molecules in the air. Upon ignition, a great big blue flame quickly engulfs the entire flask! The reaction is complete much more quickly. Factor 3: If we look at the equation above, why doesn’t the methanol spontaneously explode as soon as I take off the cap? Indeed, when methanol is exposed to air, methanol molecules will collide with O2 molecules. Without enough energy, nothing will happen. However, if we provide a spark, or some heat, O2 molecules will gain energy, smash into a methanol molecule and create a reaction. The heat given off by this reaction is enough to keep a chain reaction of energetic collisions going until all are consumed. Factor 4.
  • #21 A reaction progress diagram refresher. Going from left to right, it is an exothermic reaction that releases energy (ΔHrxn = -ve: favorable, releases energy). Going from right to left, it would be an endothermic reaction which requires an input of energy to occur (ΔHrxn = +ve: unfavorable, requires energy input to occur) Preview to mechanism: the jumping over a fence analogy. Jumping over the fence is the “mechanism” by which you get to your friends house. It takes a large amount of energy. A catalyst would be something that could create a doorway for you, thereby making the “mechanism” by which you get to your friends house much easier.
  • #23 Now let’s examine the reaction of A  2B. The stoichiometry for this reaction is not one to one. By looking at the stoichiometry of the reaction, we would conclude that B is being produced at 2 times the rate that A disappears. A  2B - 1.0 M/s 2.0 M/s What is the relation of the change in [A] to the change in [B]? 1.0 M/second is only one-half the rate of 2.0 M/second so therefore, Rate = -Δ[A] = 1 Δ[B] Δt 2 Δt The rate expression shows the relationship of the change in concentration of all the reacting species.
  • #24 Tro example 13.1
  • #25 Some analysis with some real kinetics data. Just these numbers alone don’t seem to mean much. Can you tell if the reaction rate is constant, or is it changing over time? One way to find out for sure is to take an average reaction rate over a 10 second interval. Say we compare the rate of the reaction in the first 10 seconds, and compare it to the rate in the last 10 seconds of the reaction. In the first 10 seconds of the reaction: Ozone is disappearing at a rate of 7.8 x 10⁻⁷ M/s In the last 10 seconds of the reaction: 1.3 x 10⁻⁷ M/s From these numbers, one can see that the rate is changing over time.
  • #26 A much more useful way to interpret kinetics data is to express it graphically. From this graph, we can obtain a lot more information from it compared to just looking at numbers. The graph is made from plotting O3 concentration over time, and a smooth curve is fit to the points. The smooth curve essentially gives an enormous number of data points! We can predict what the concentration of the O3 was even at times other than an actual data point. More importantly, the curve allows us to obtain instantaneous reaction rates . The initial rate represents the instantaneous rate of the reaction right when it starts, and is the tangent to the curve at time 0. It is an estimate of how fast the reaction occurs right at the moment it starts, which is nearly impossible to measure physically.