Download to read offline

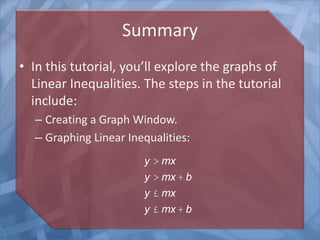


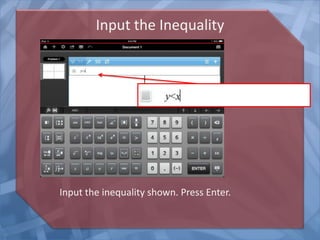
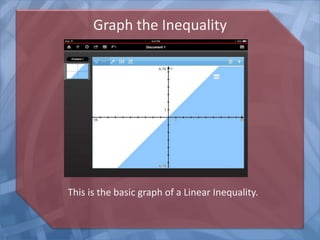


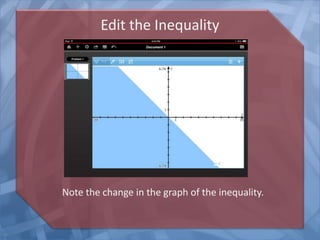
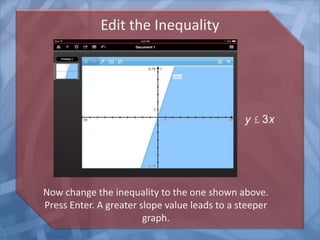
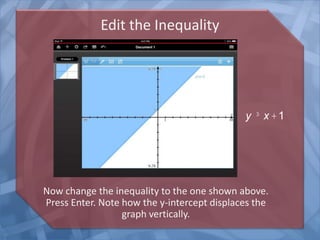
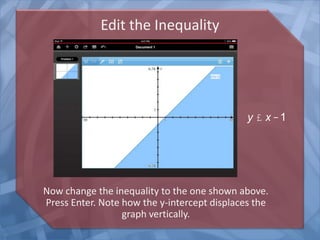
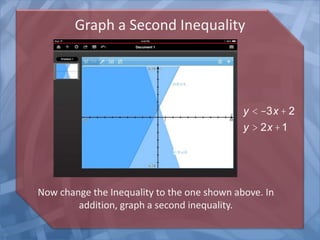

- This tutorial teaches how to graph linear inequalities on a TI-Nspire app by showing how to: create a graph window, input inequalities of the form y>mx, y>mx+b, y≤mx, and y≤mx+b. It demonstrates how changing the slope, y-intercept, or direction of inequality affects the graph. It concludes by graphing two inequalities at once.