Download as PDF, PPTX

![Graphing Linear Inequalities in Two Variables
Application
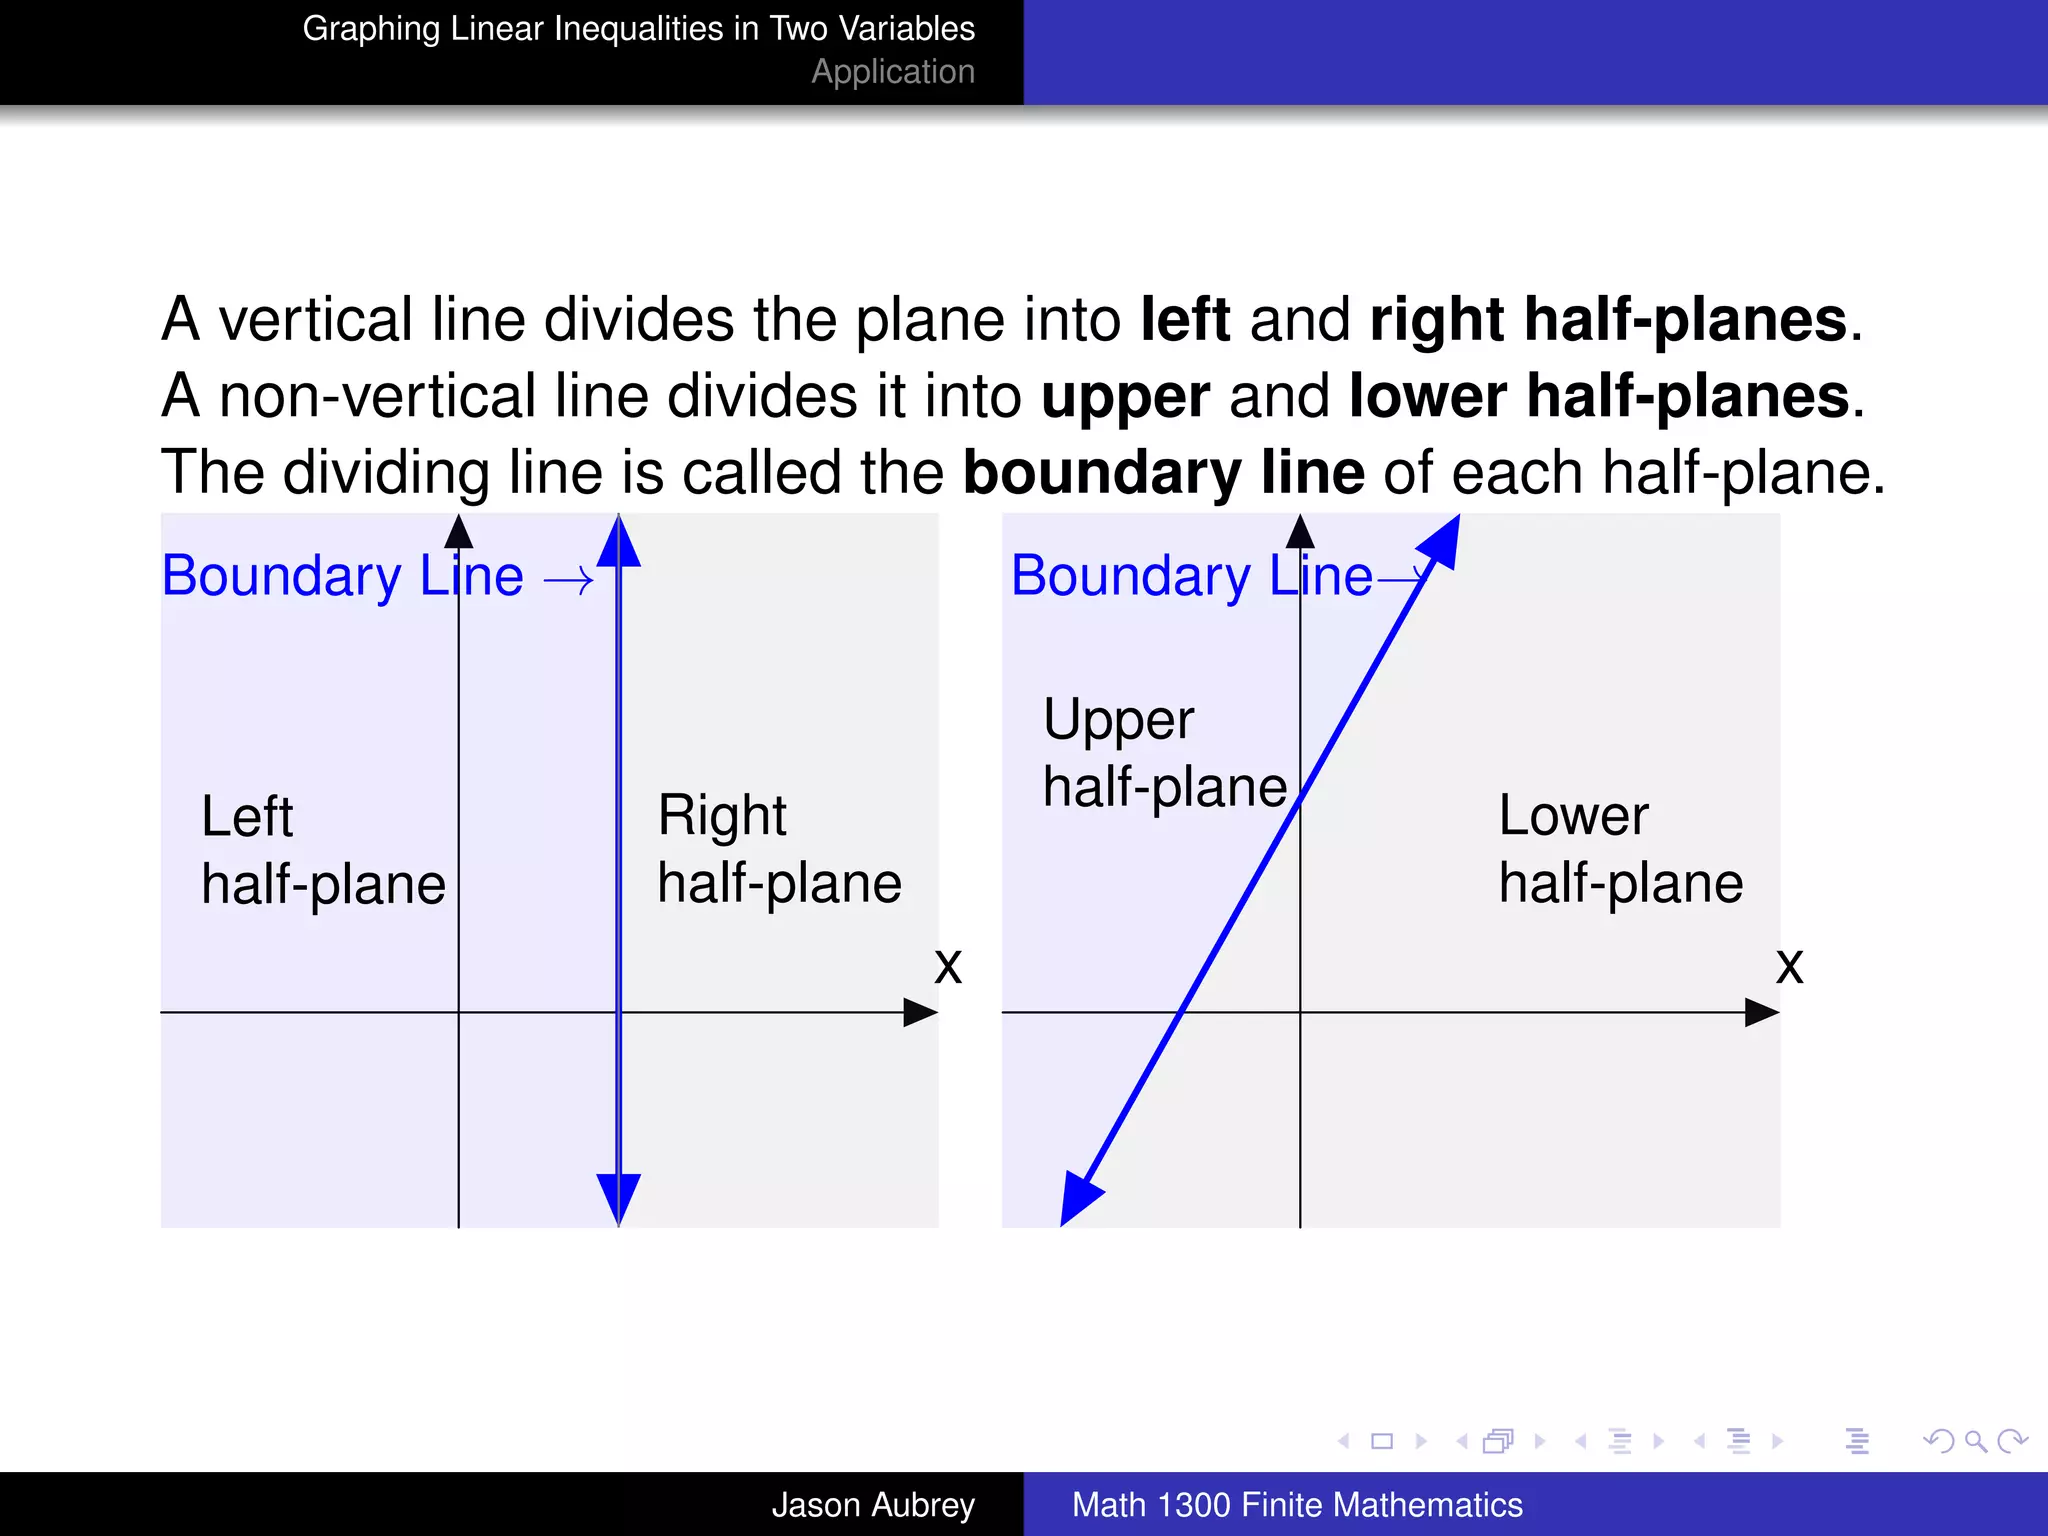
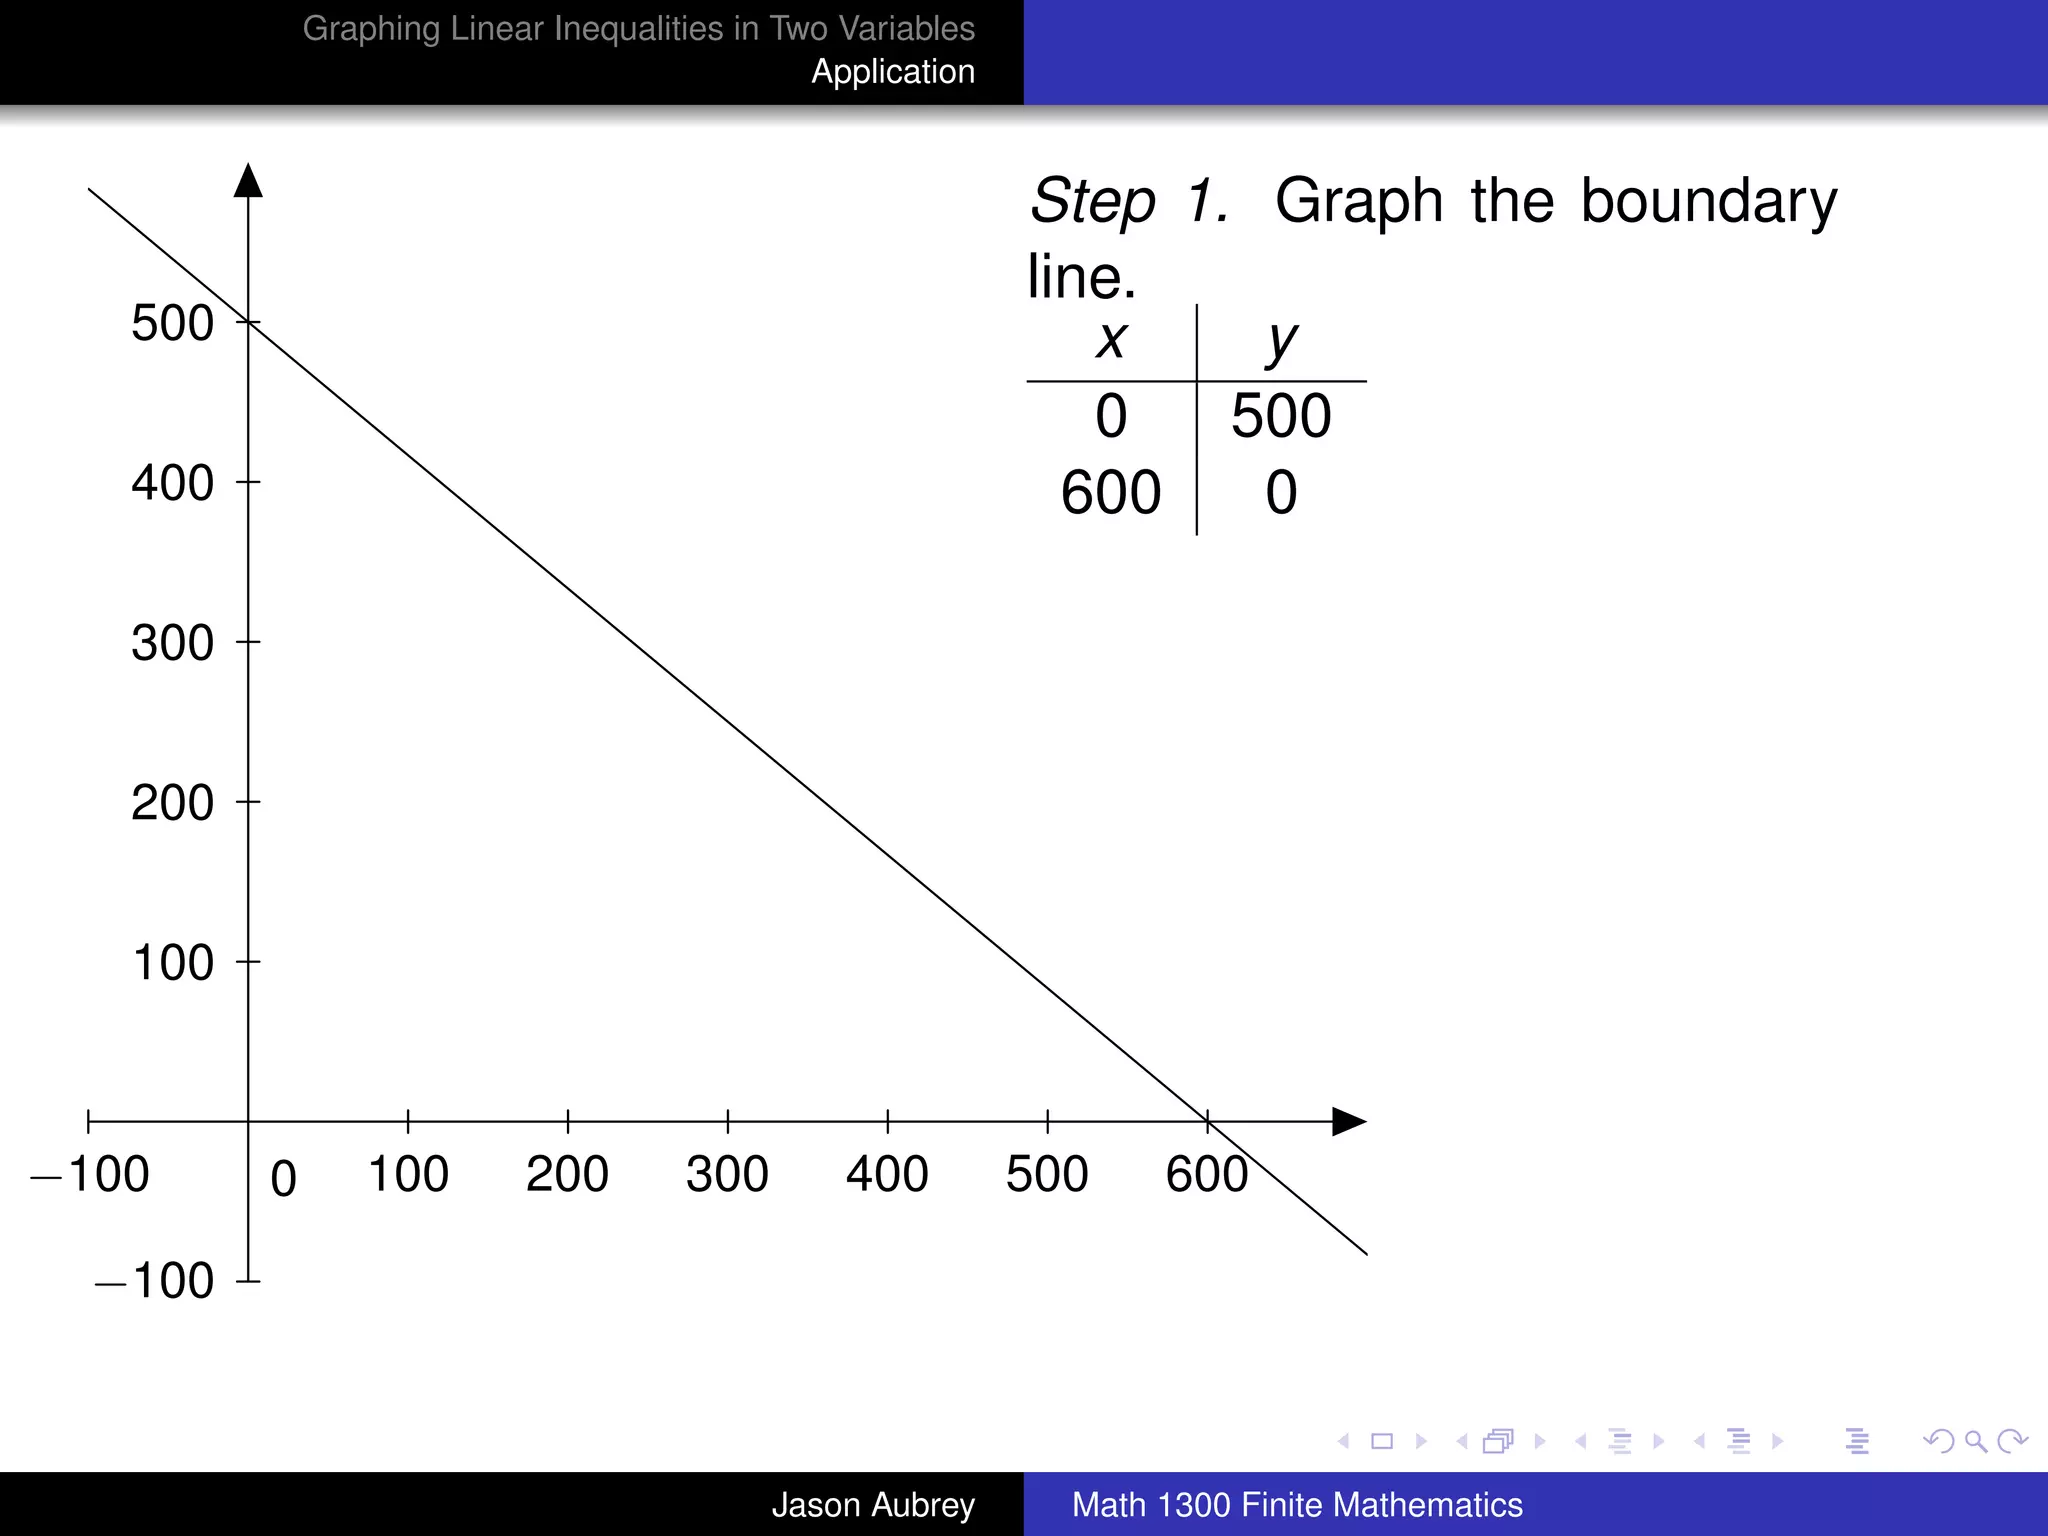
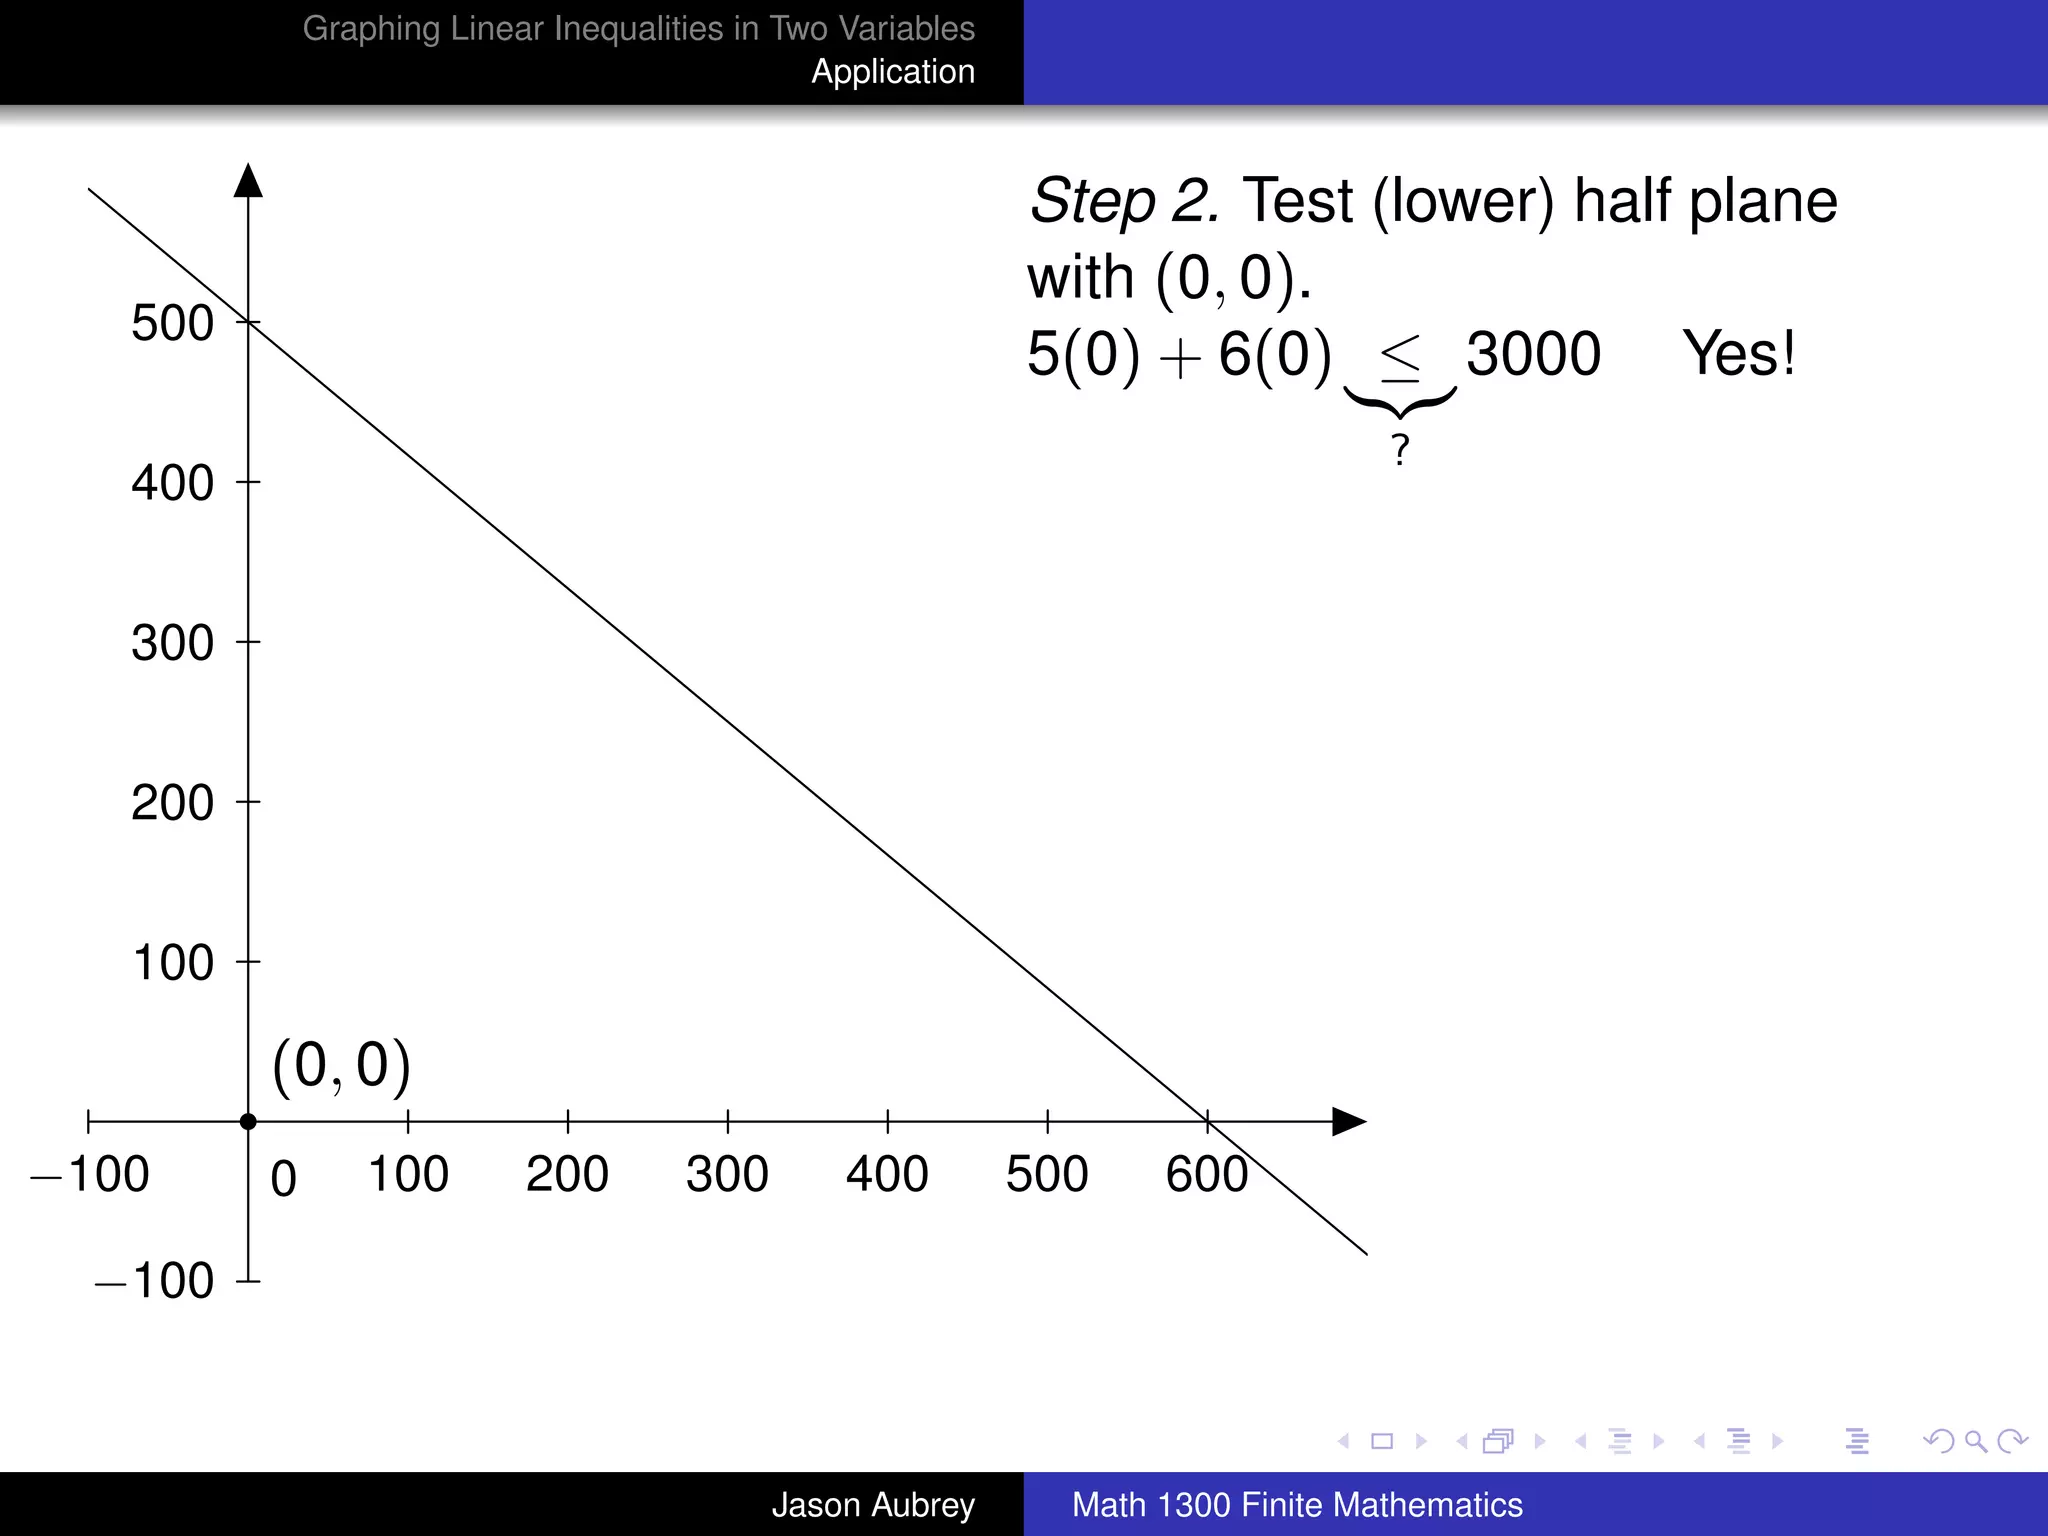
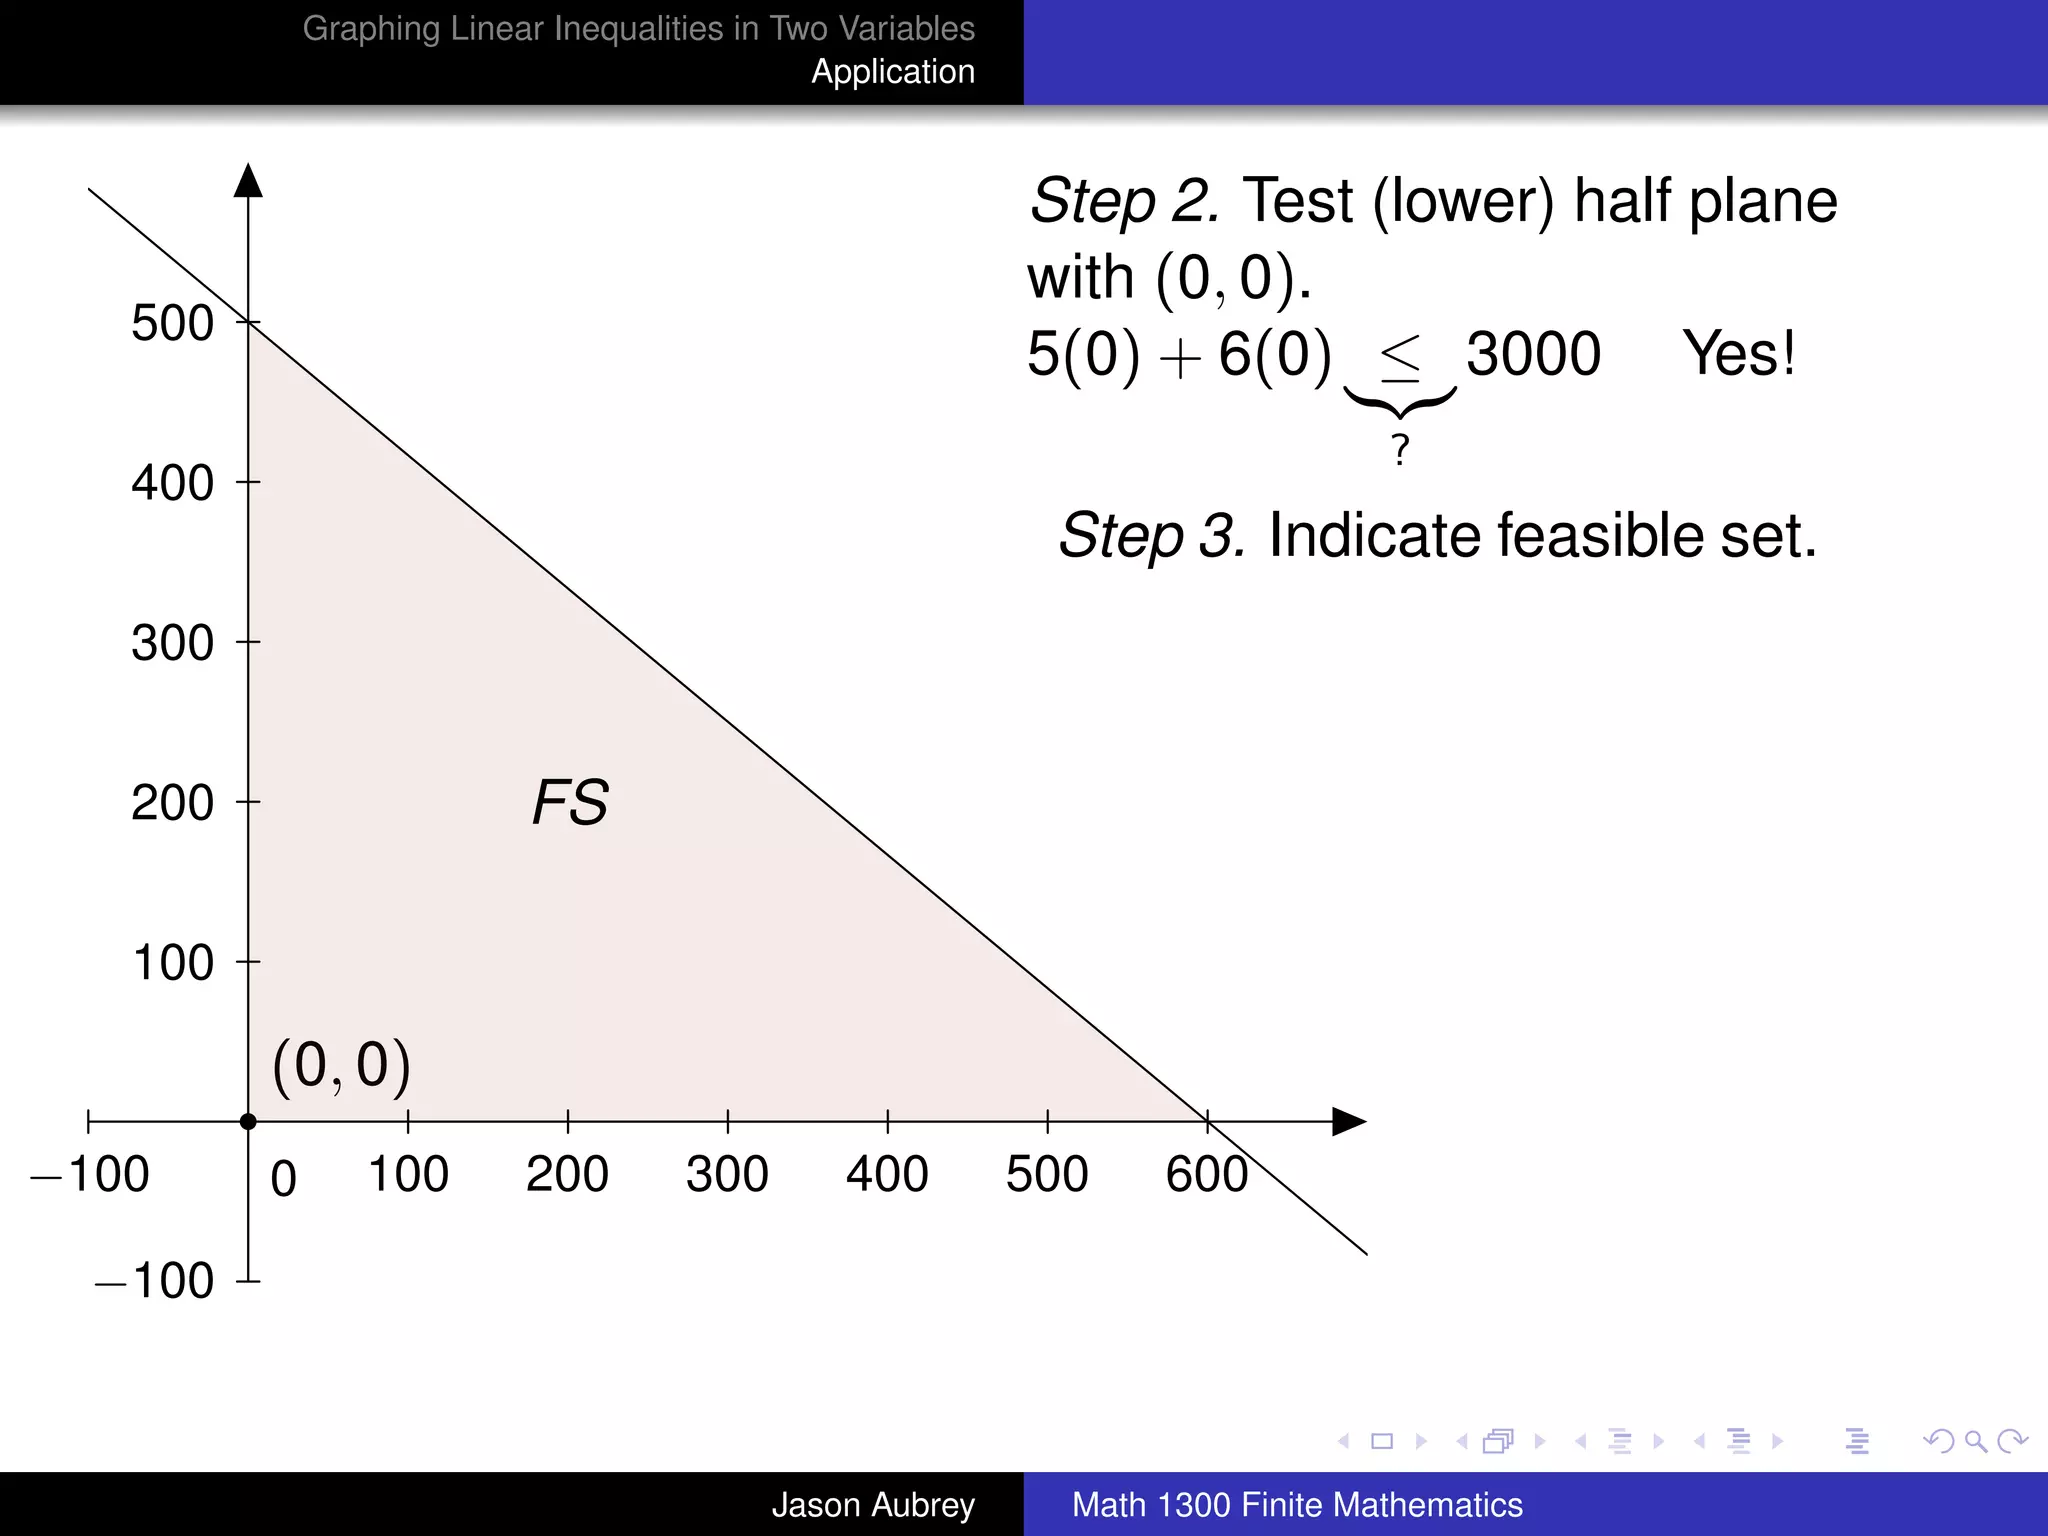
Procedure for Graphing Linear Inequalities
Step 1. First graph Ax + By = C as a dashed line if equality is
not included in the original statement or as a solid line if
equality is included.
Step 2. Choose a test point anywhere in the plane not on the
line [the origin usually requires the least computation] and
substitute the coordinates into the inequality.
university-logo
Jason Aubrey Math 1300 Finite Mathematics](https://image.slidesharecdn.com/1300section51-110627155731-phpapp02/75/Math-1300-Section-5-1-Inequalities-in-Two-Variables-10-2048.jpg)
![Graphing Linear Inequalities in Two Variables
Application
Procedure for Graphing Linear Inequalities
Step 1. First graph Ax + By = C as a dashed line if equality is
not included in the original statement or as a solid line if
equality is included.
Step 2. Choose a test point anywhere in the plane not on the
line [the origin usually requires the least computation] and
substitute the coordinates into the inequality.
Step 3. The graph of the original inequality includes the
half-plane containing the test point if the inequality is satisfied
by that point or the half-plane not containing the test-point if the
inequality is not satisfied by that point. Clearly indicate which
half-plane is included in the graph by writing "Feasible Set" or
"FS" in that half-plane.
university-logo
Jason Aubrey Math 1300 Finite Mathematics](https://image.slidesharecdn.com/1300section51-110627155731-phpapp02/75/Math-1300-Section-5-1-Inequalities-in-Two-Variables-11-2048.jpg)
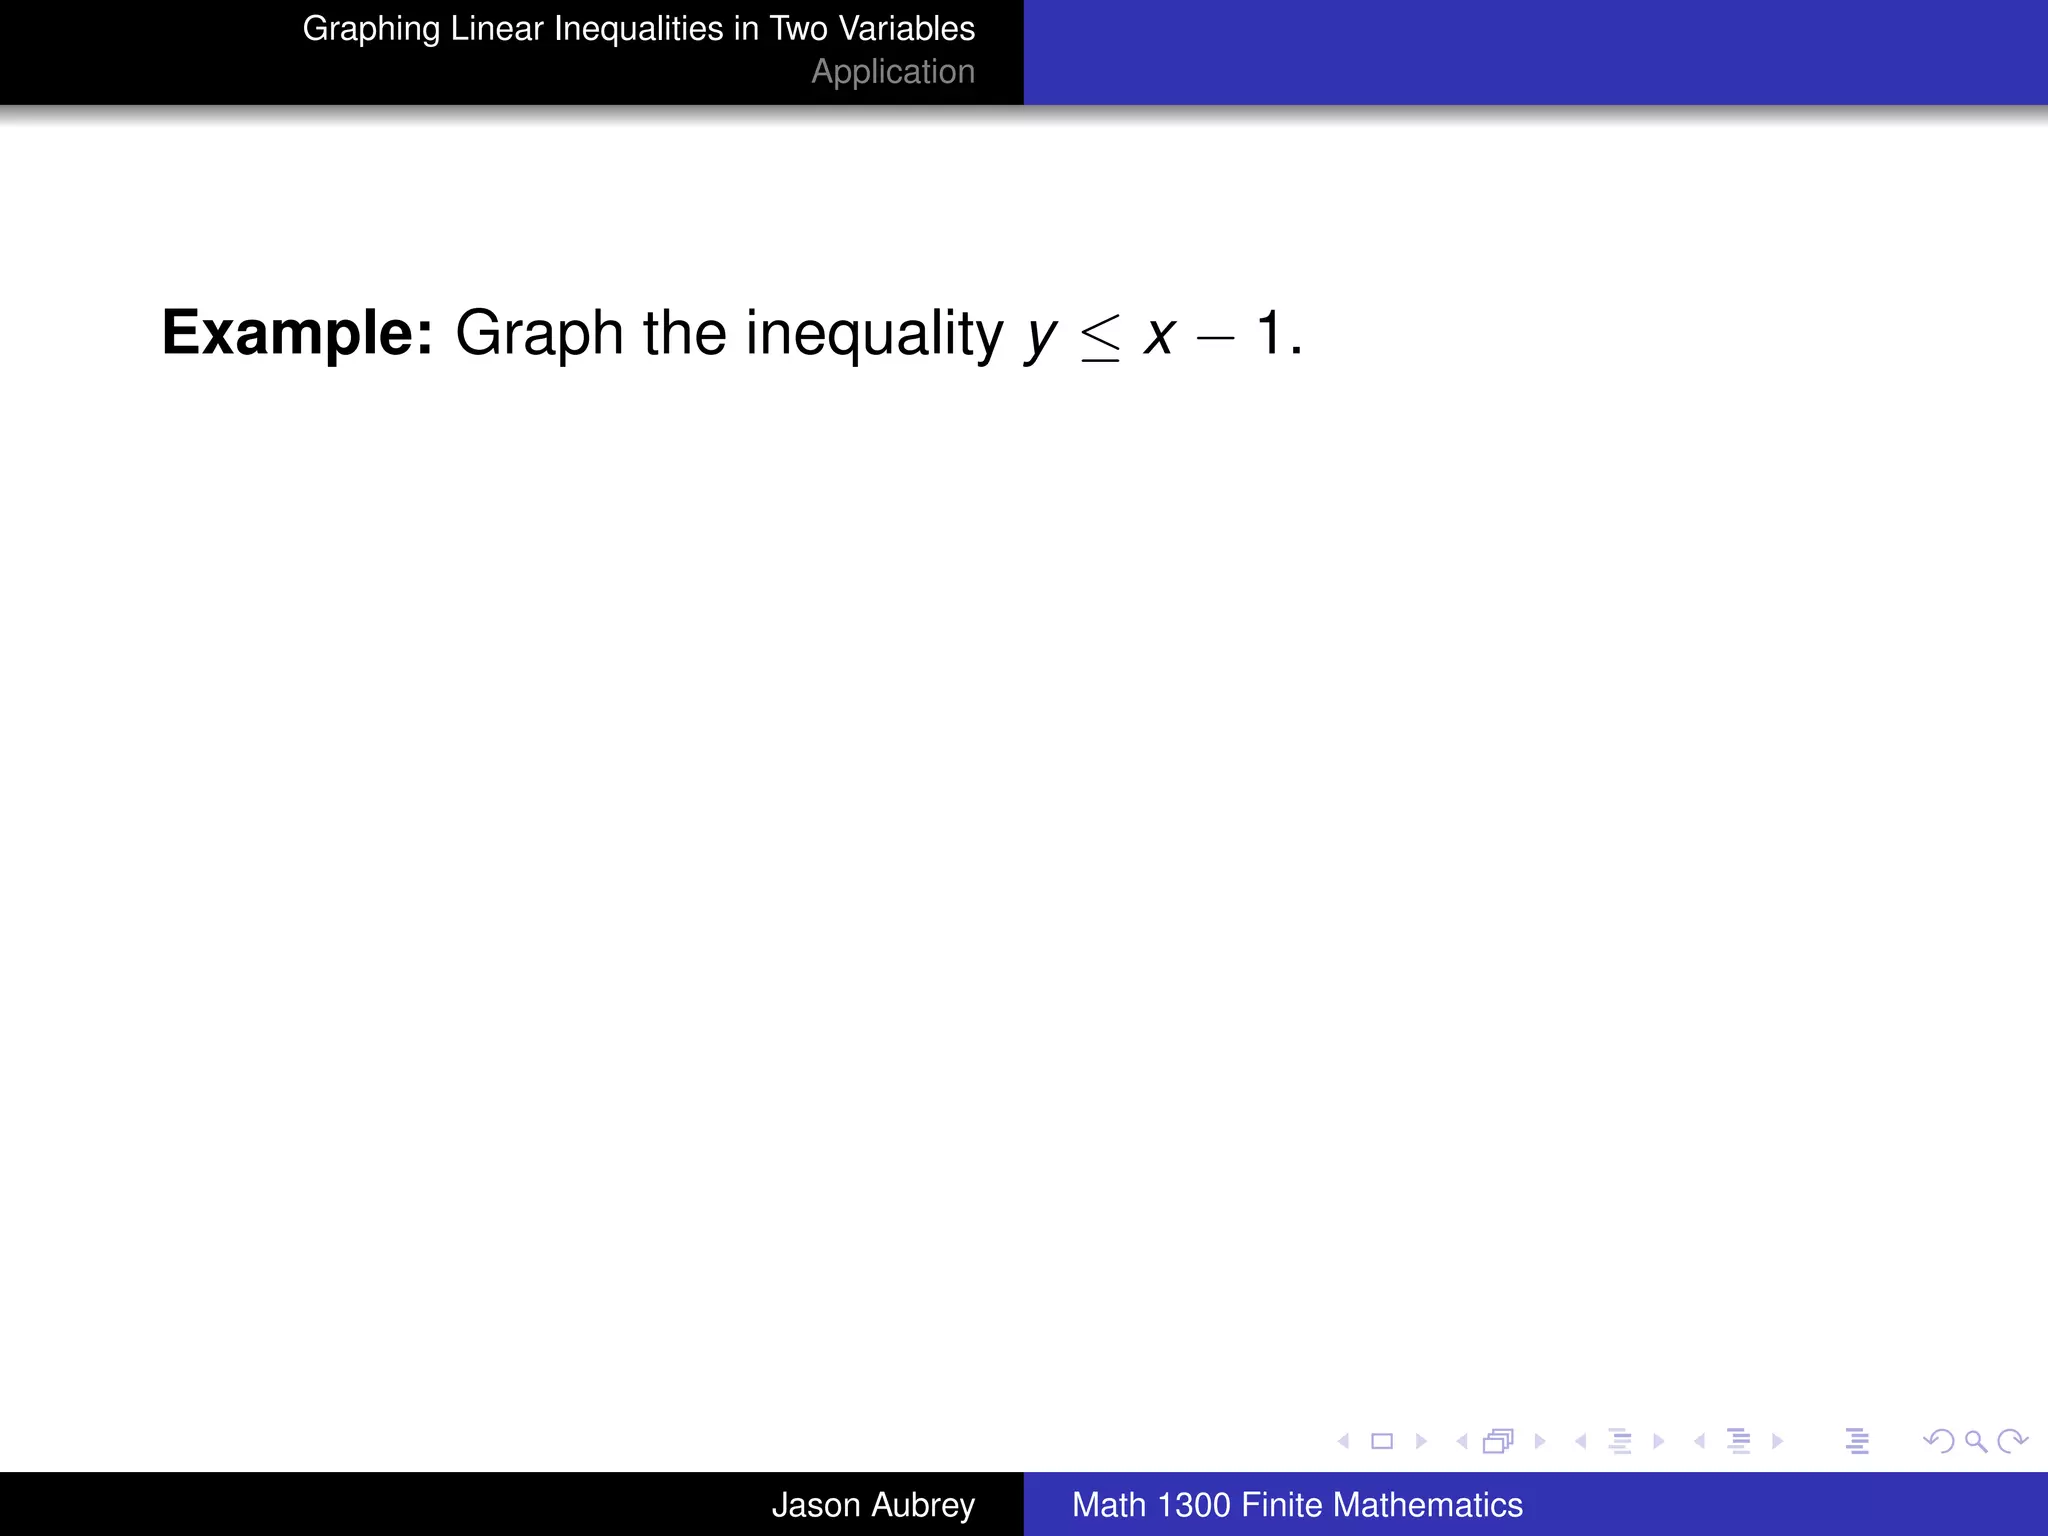
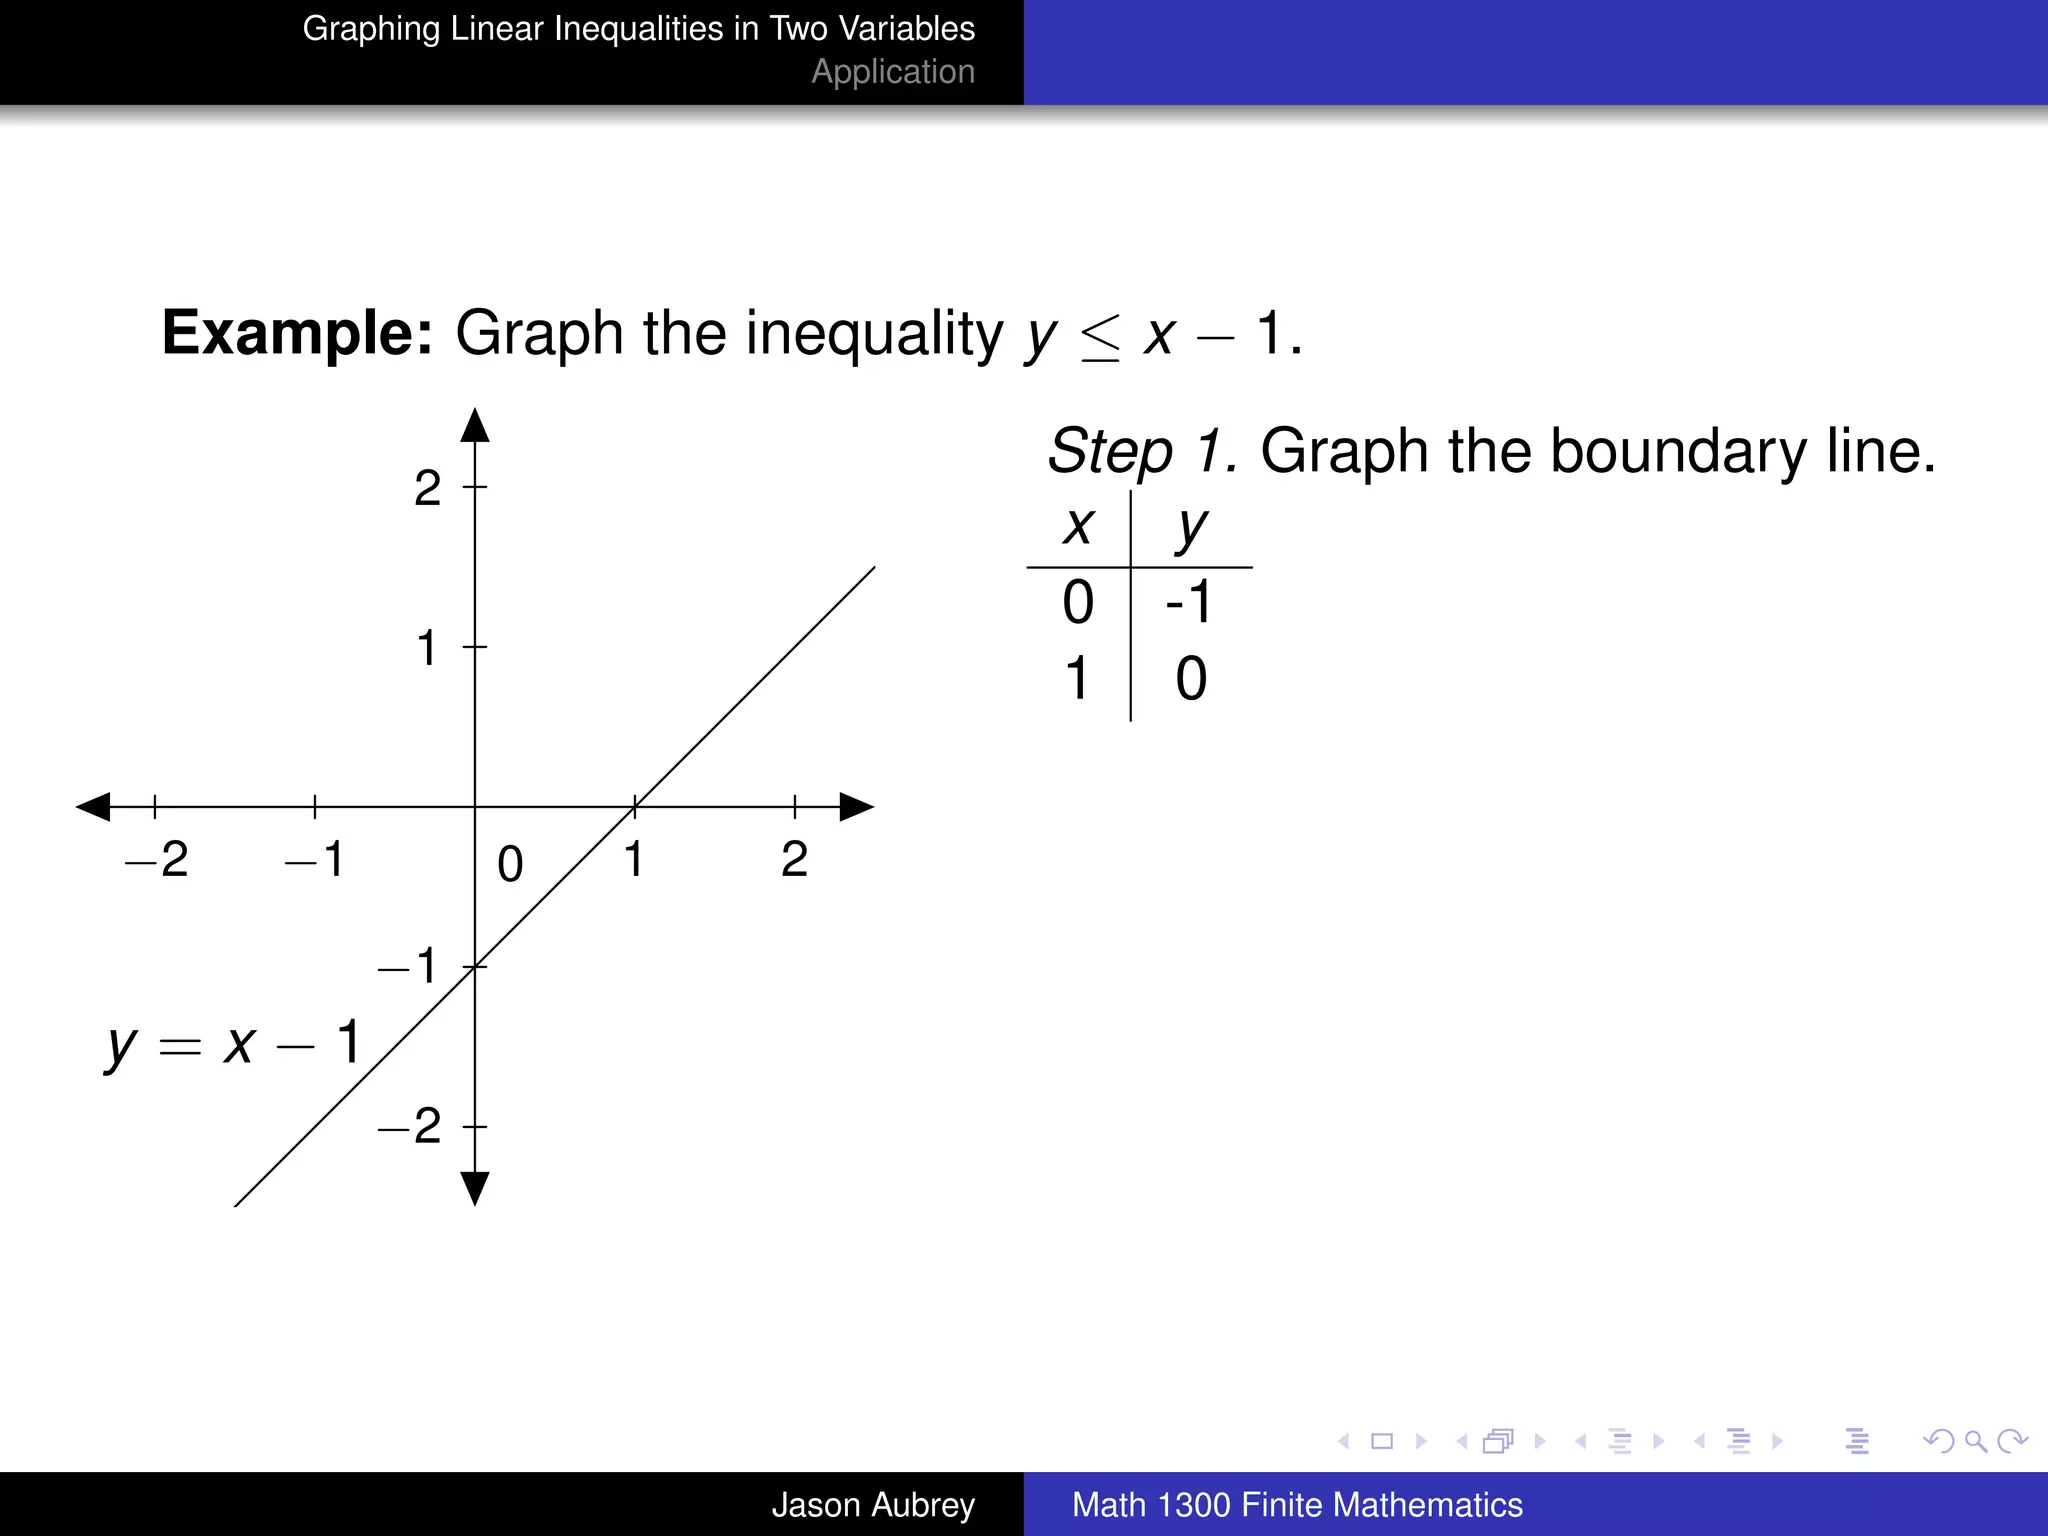
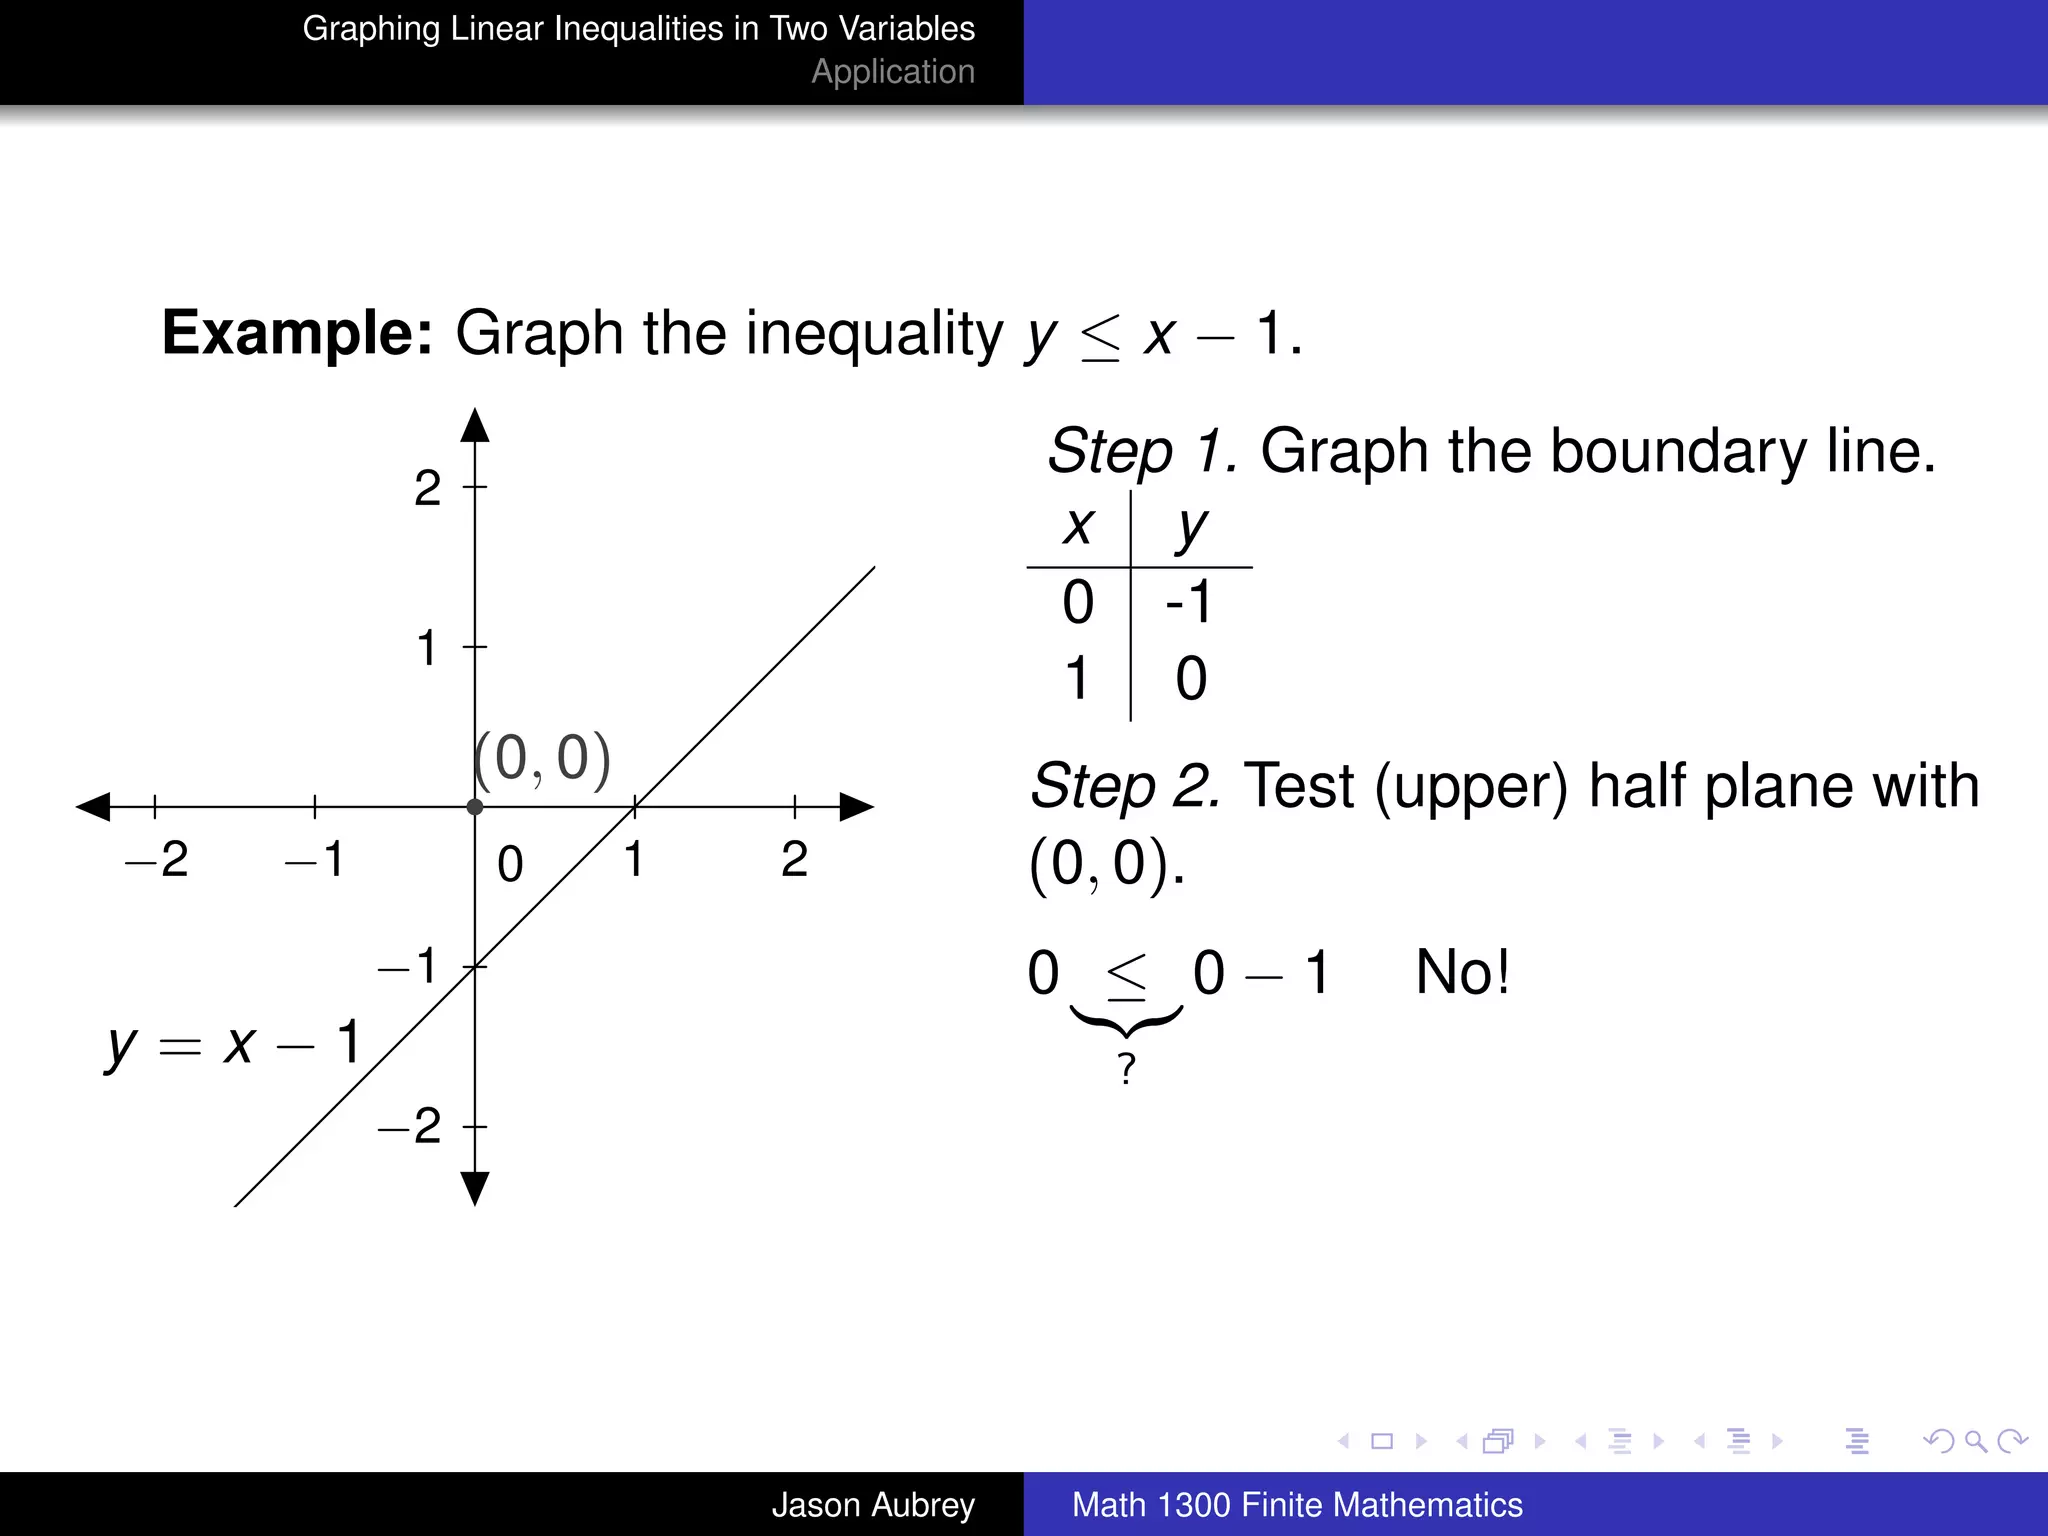
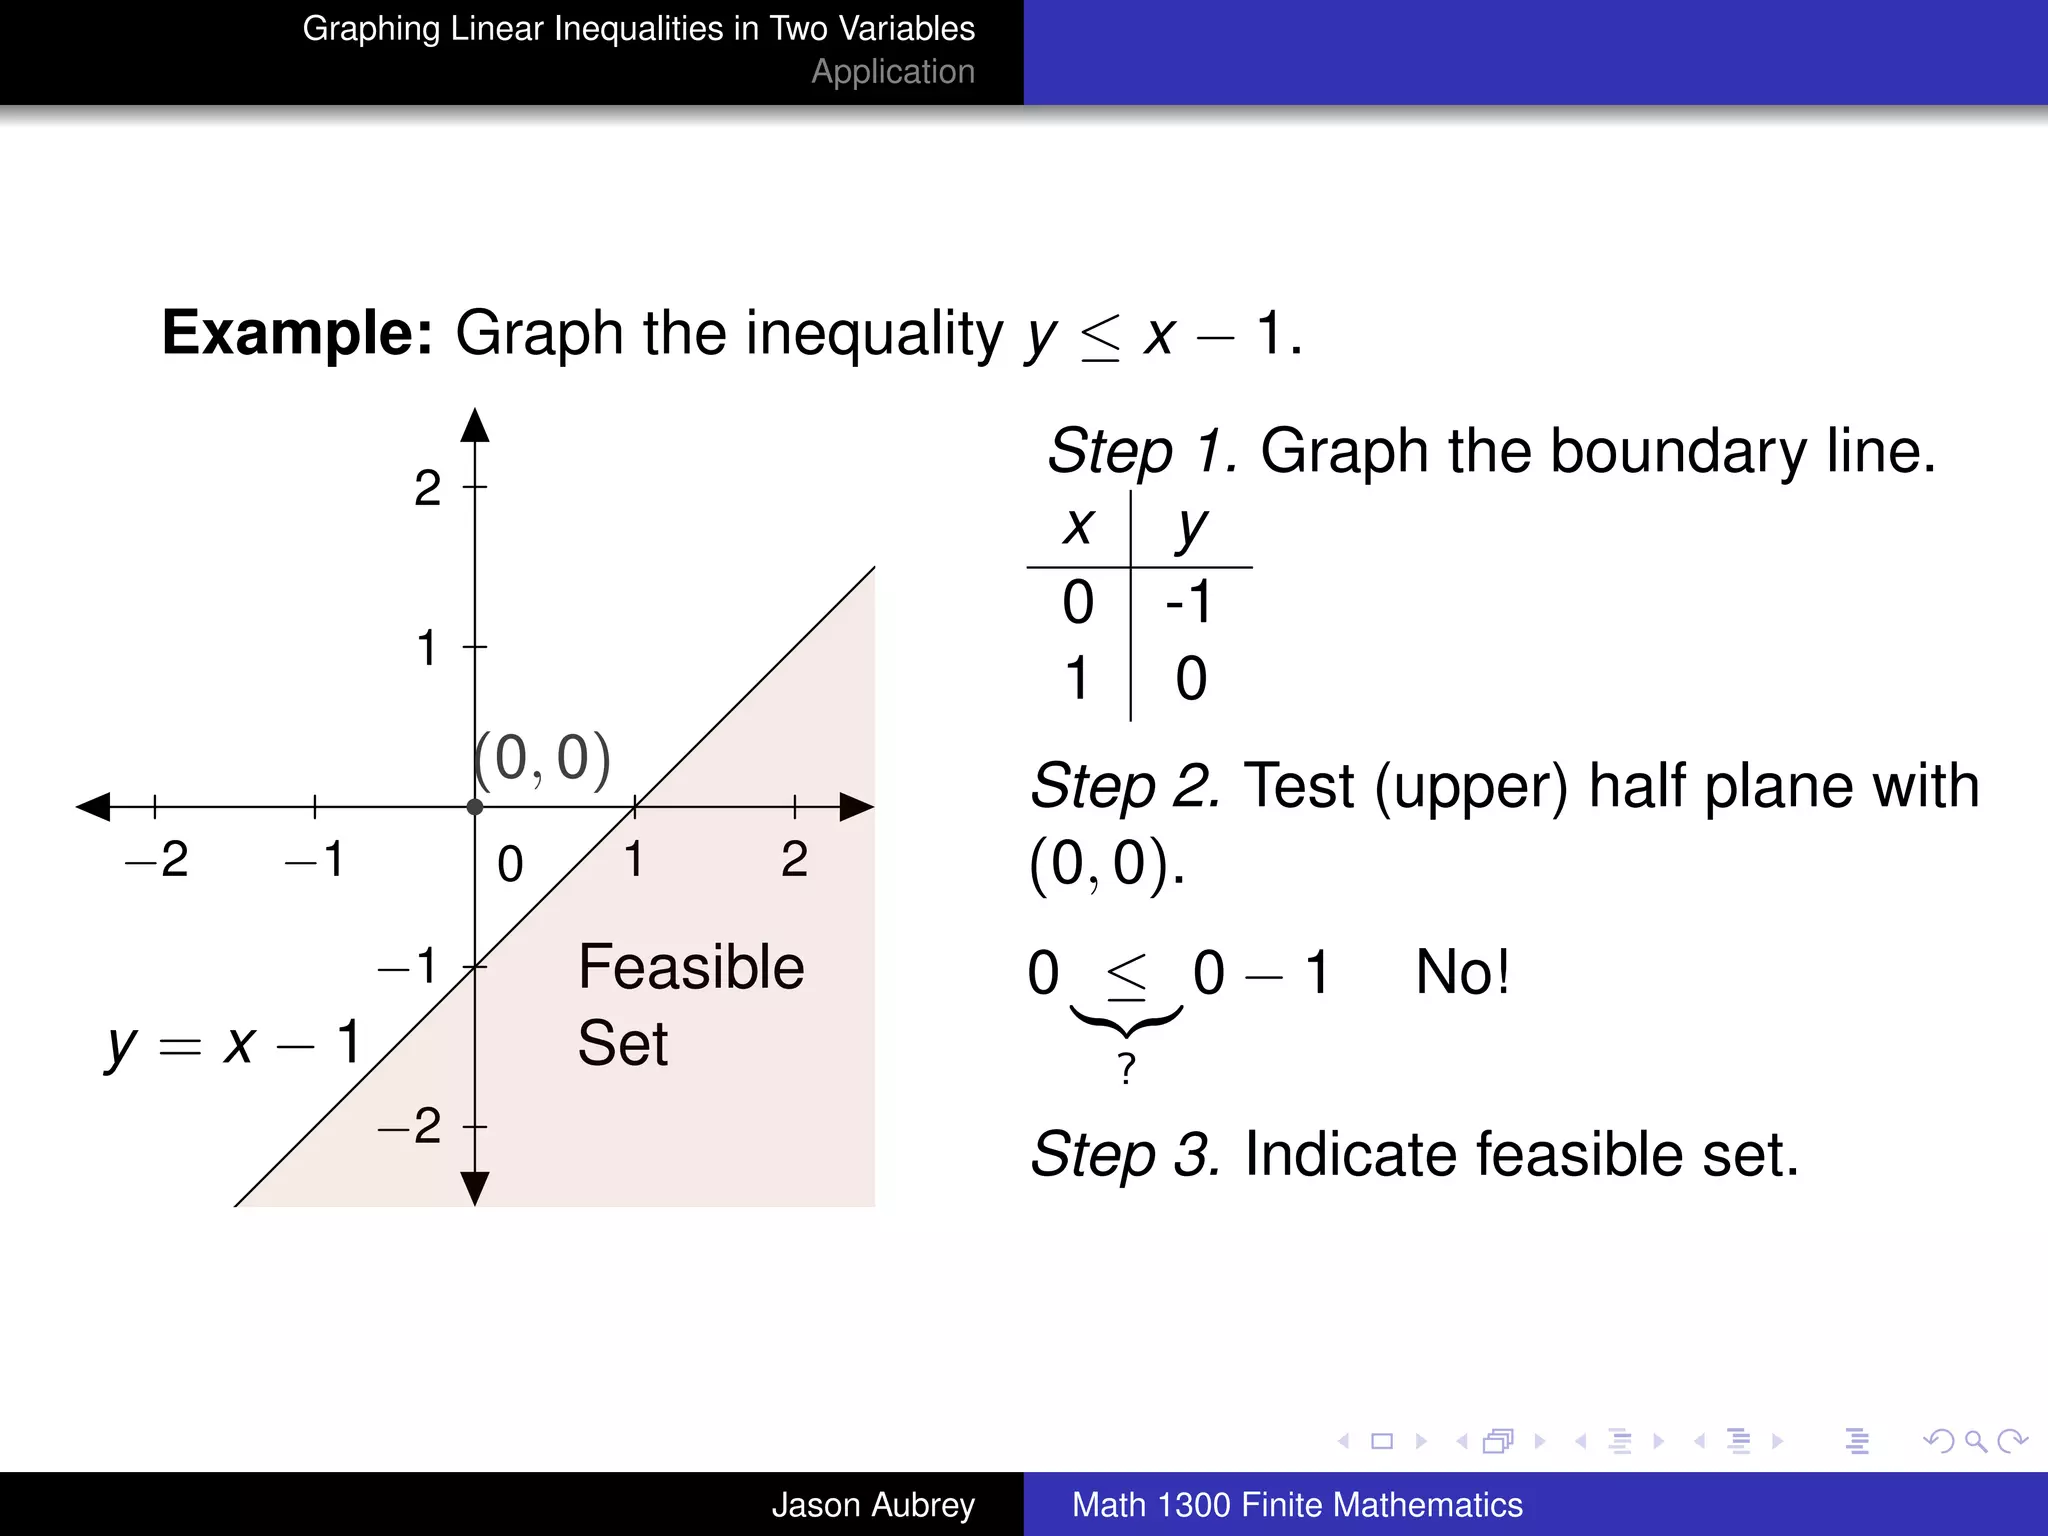
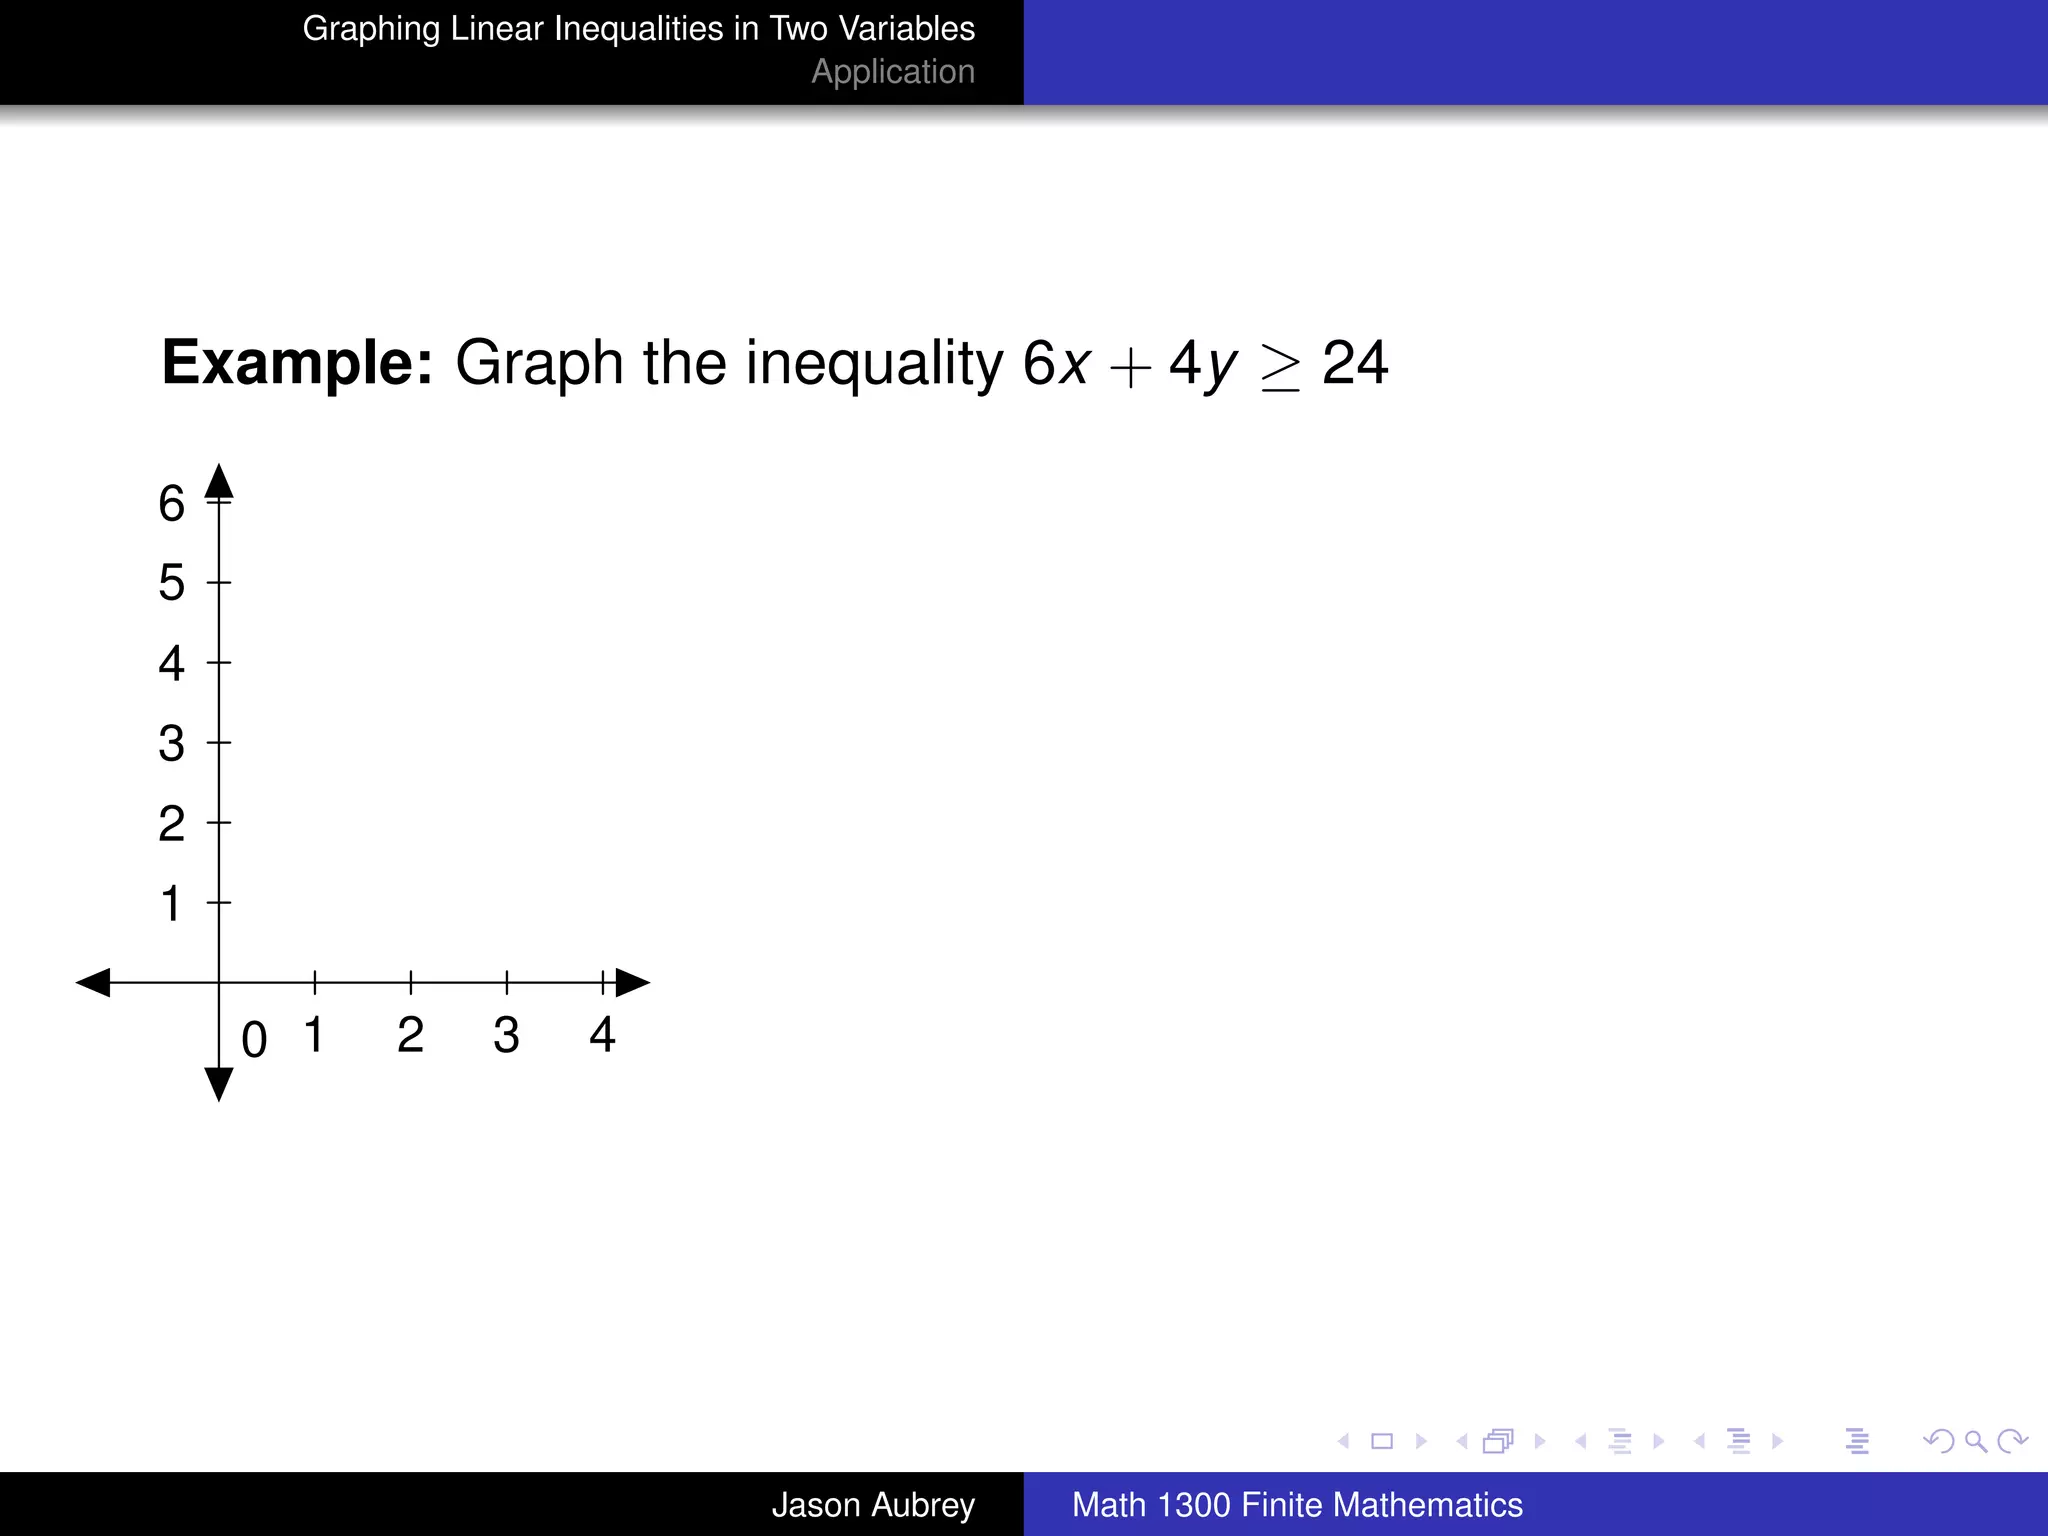
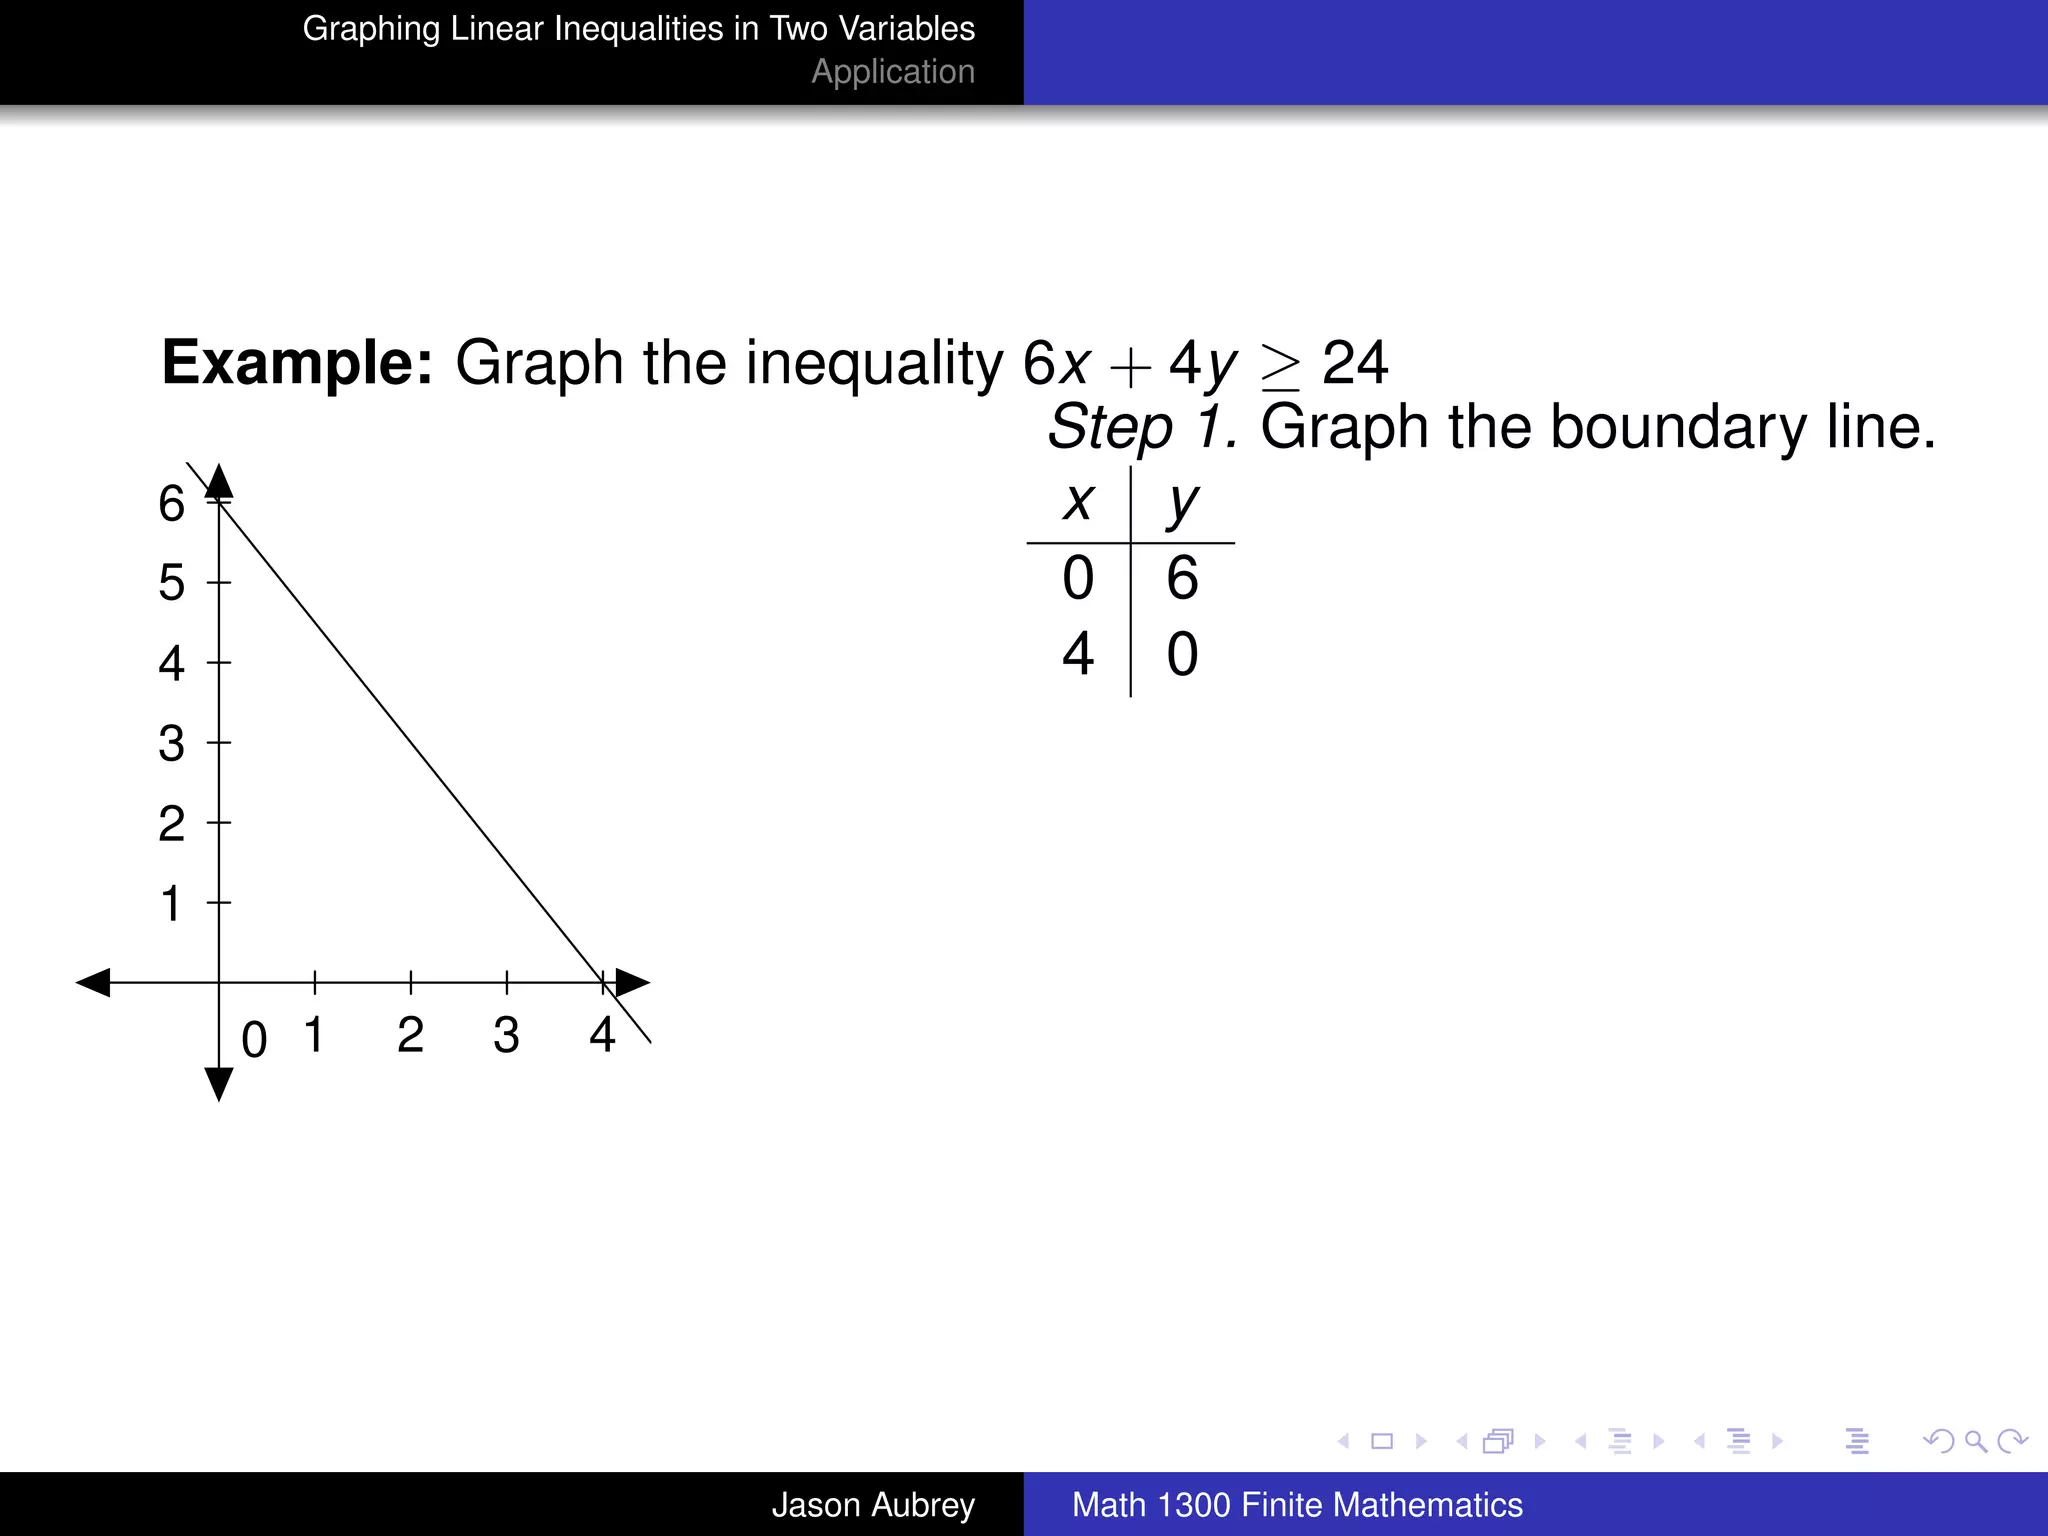
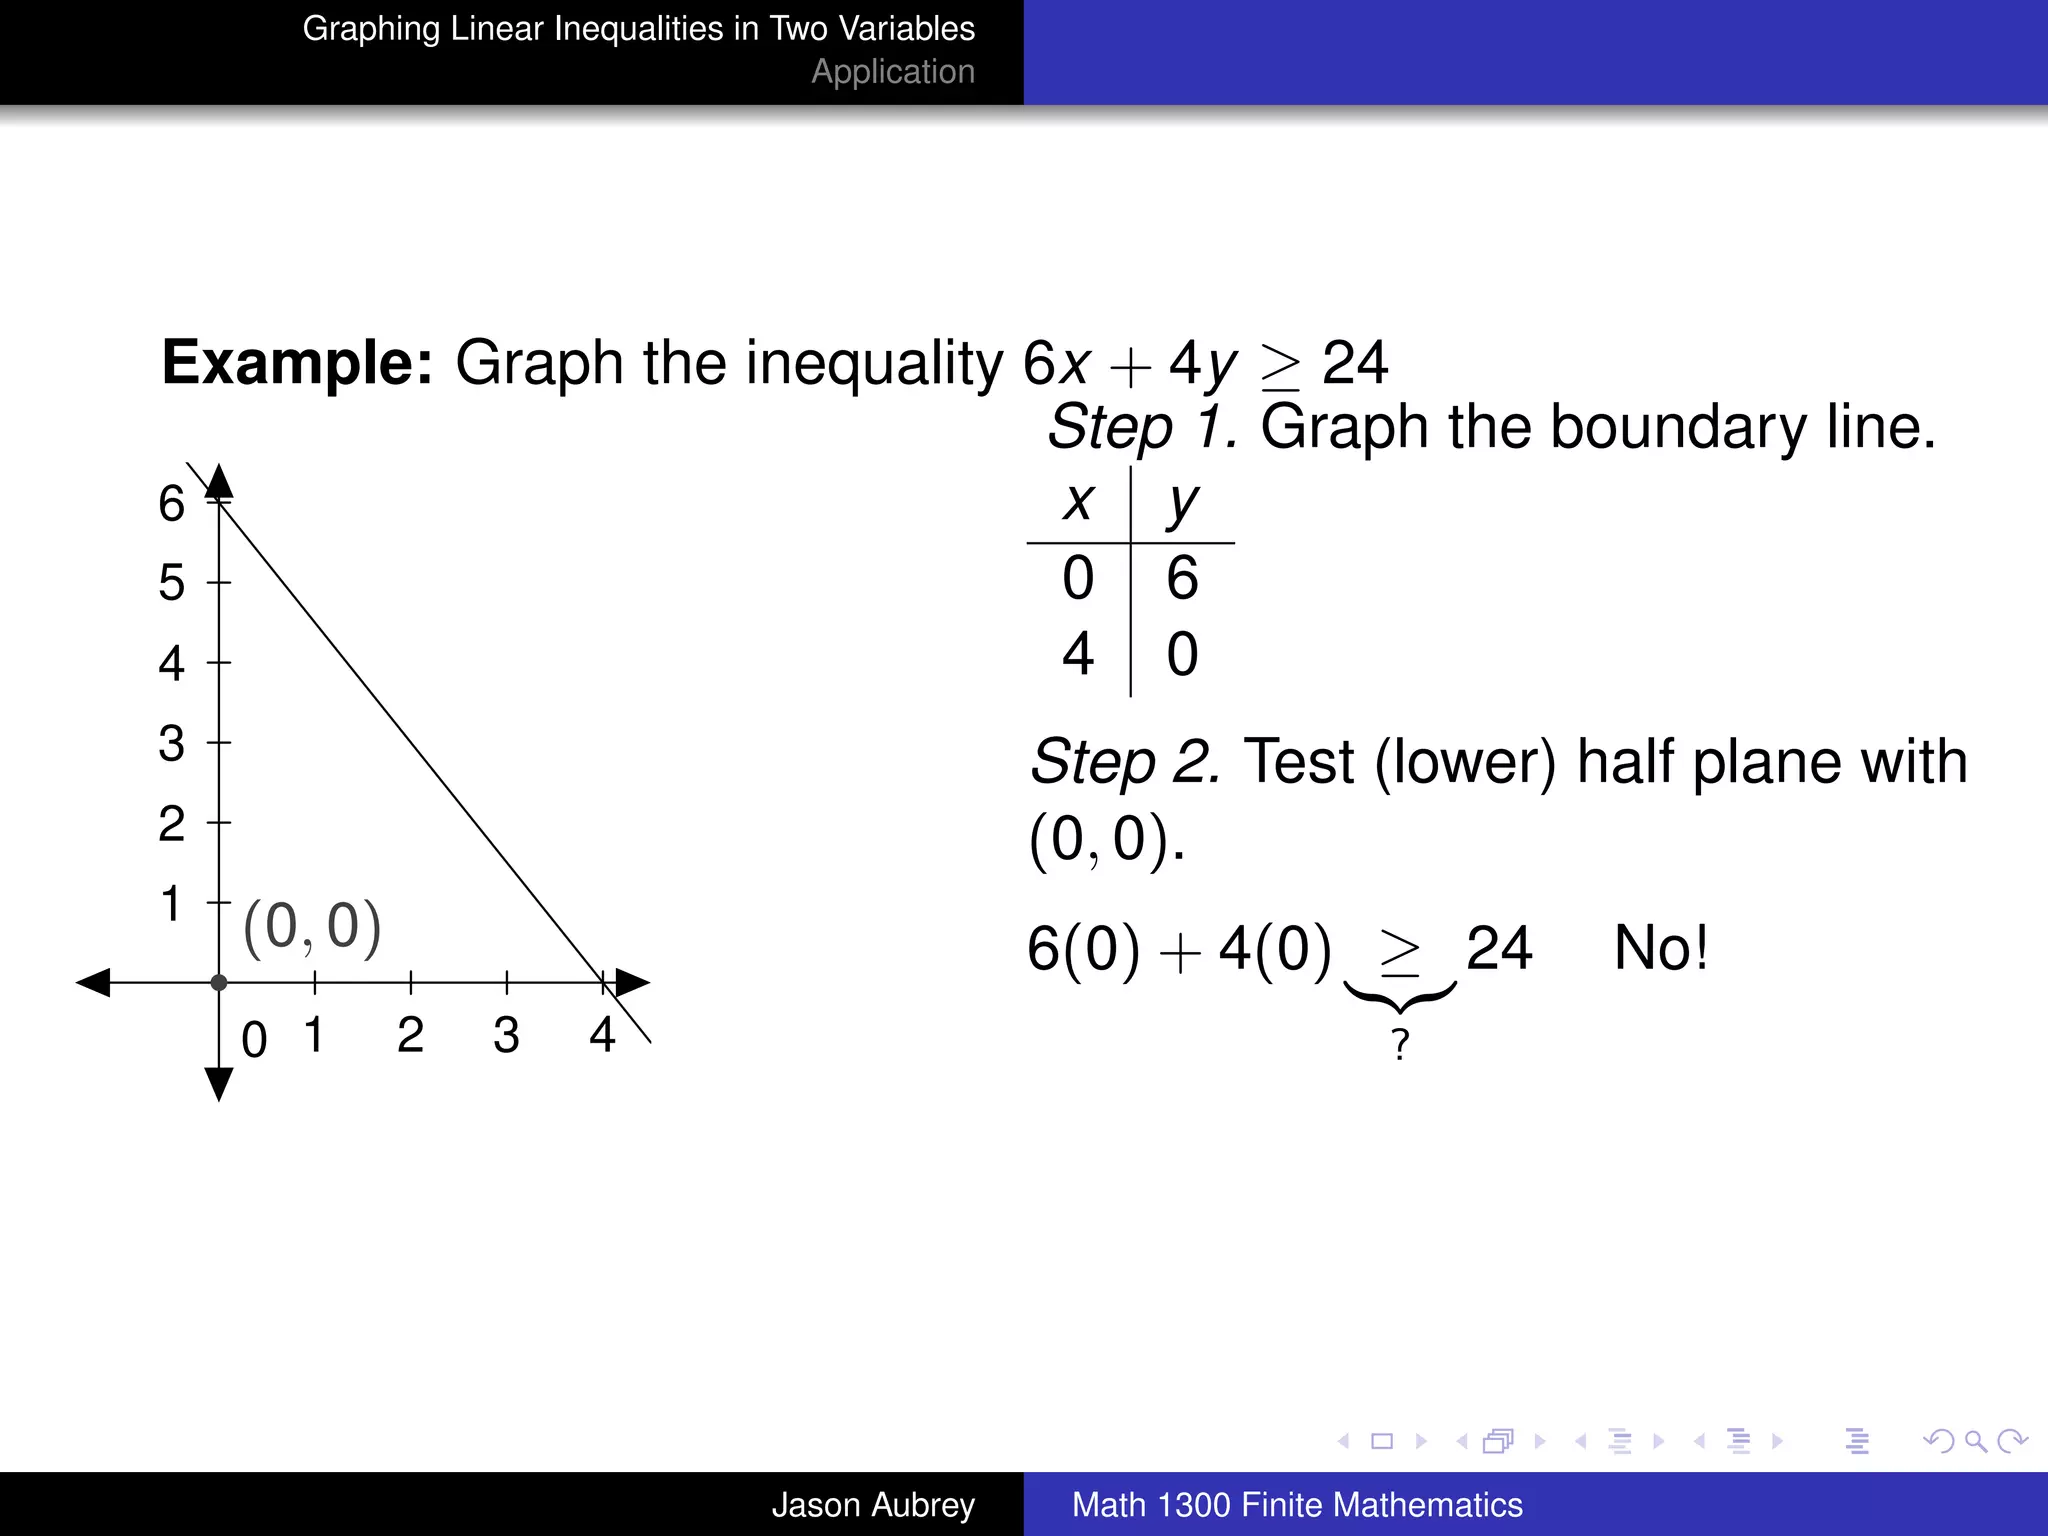
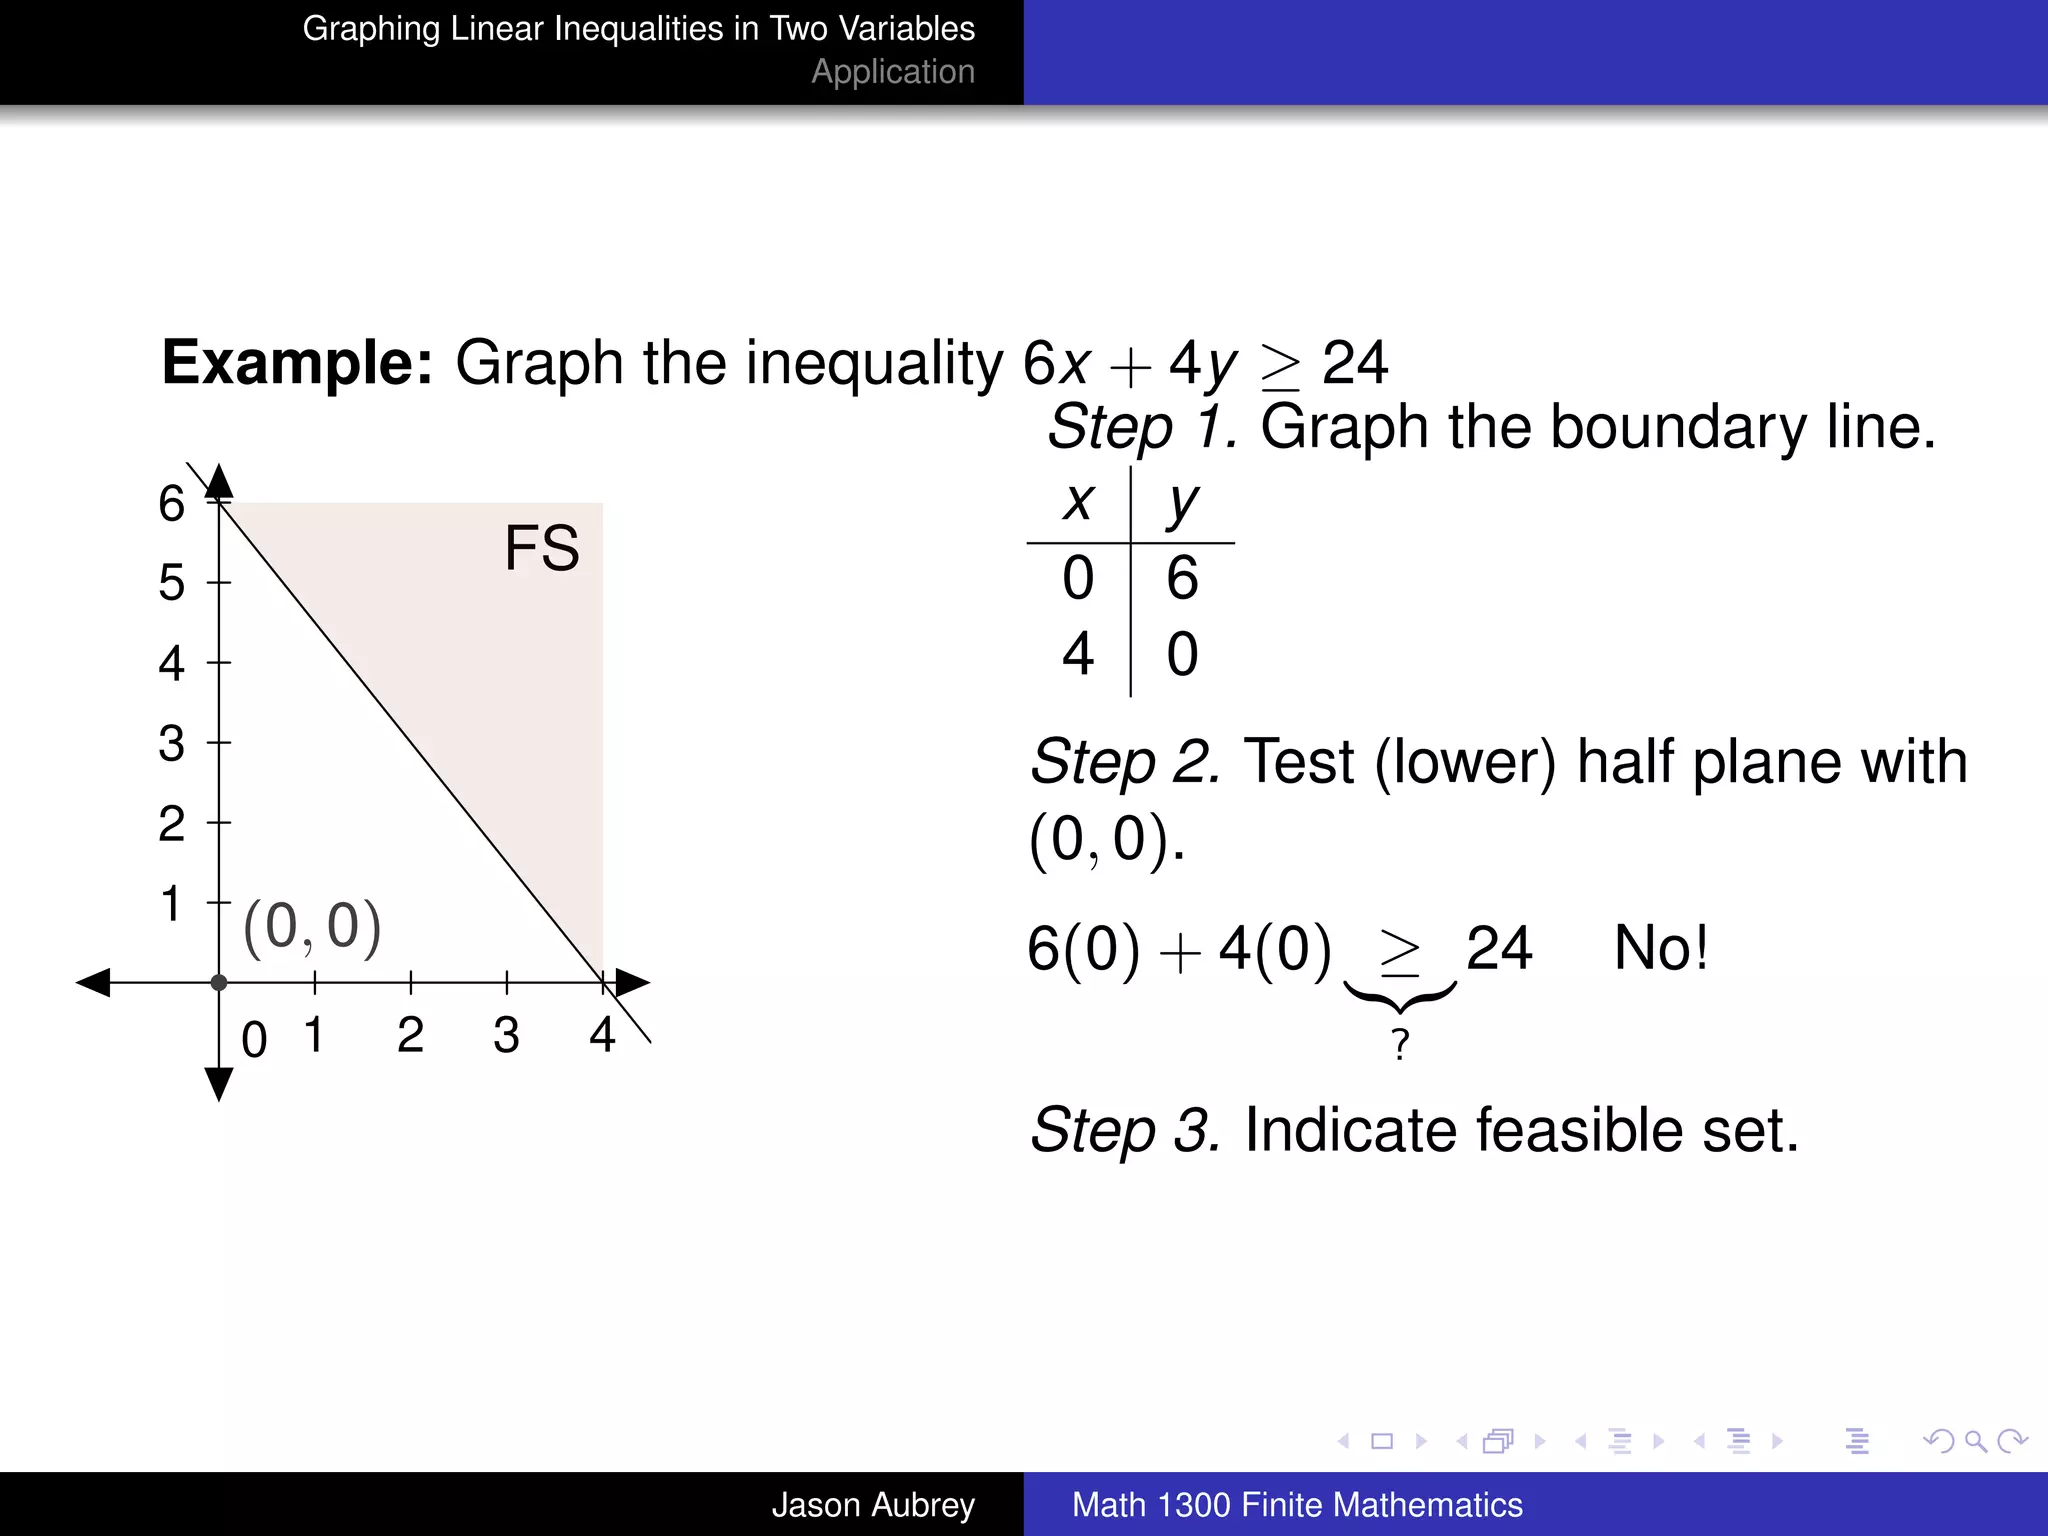
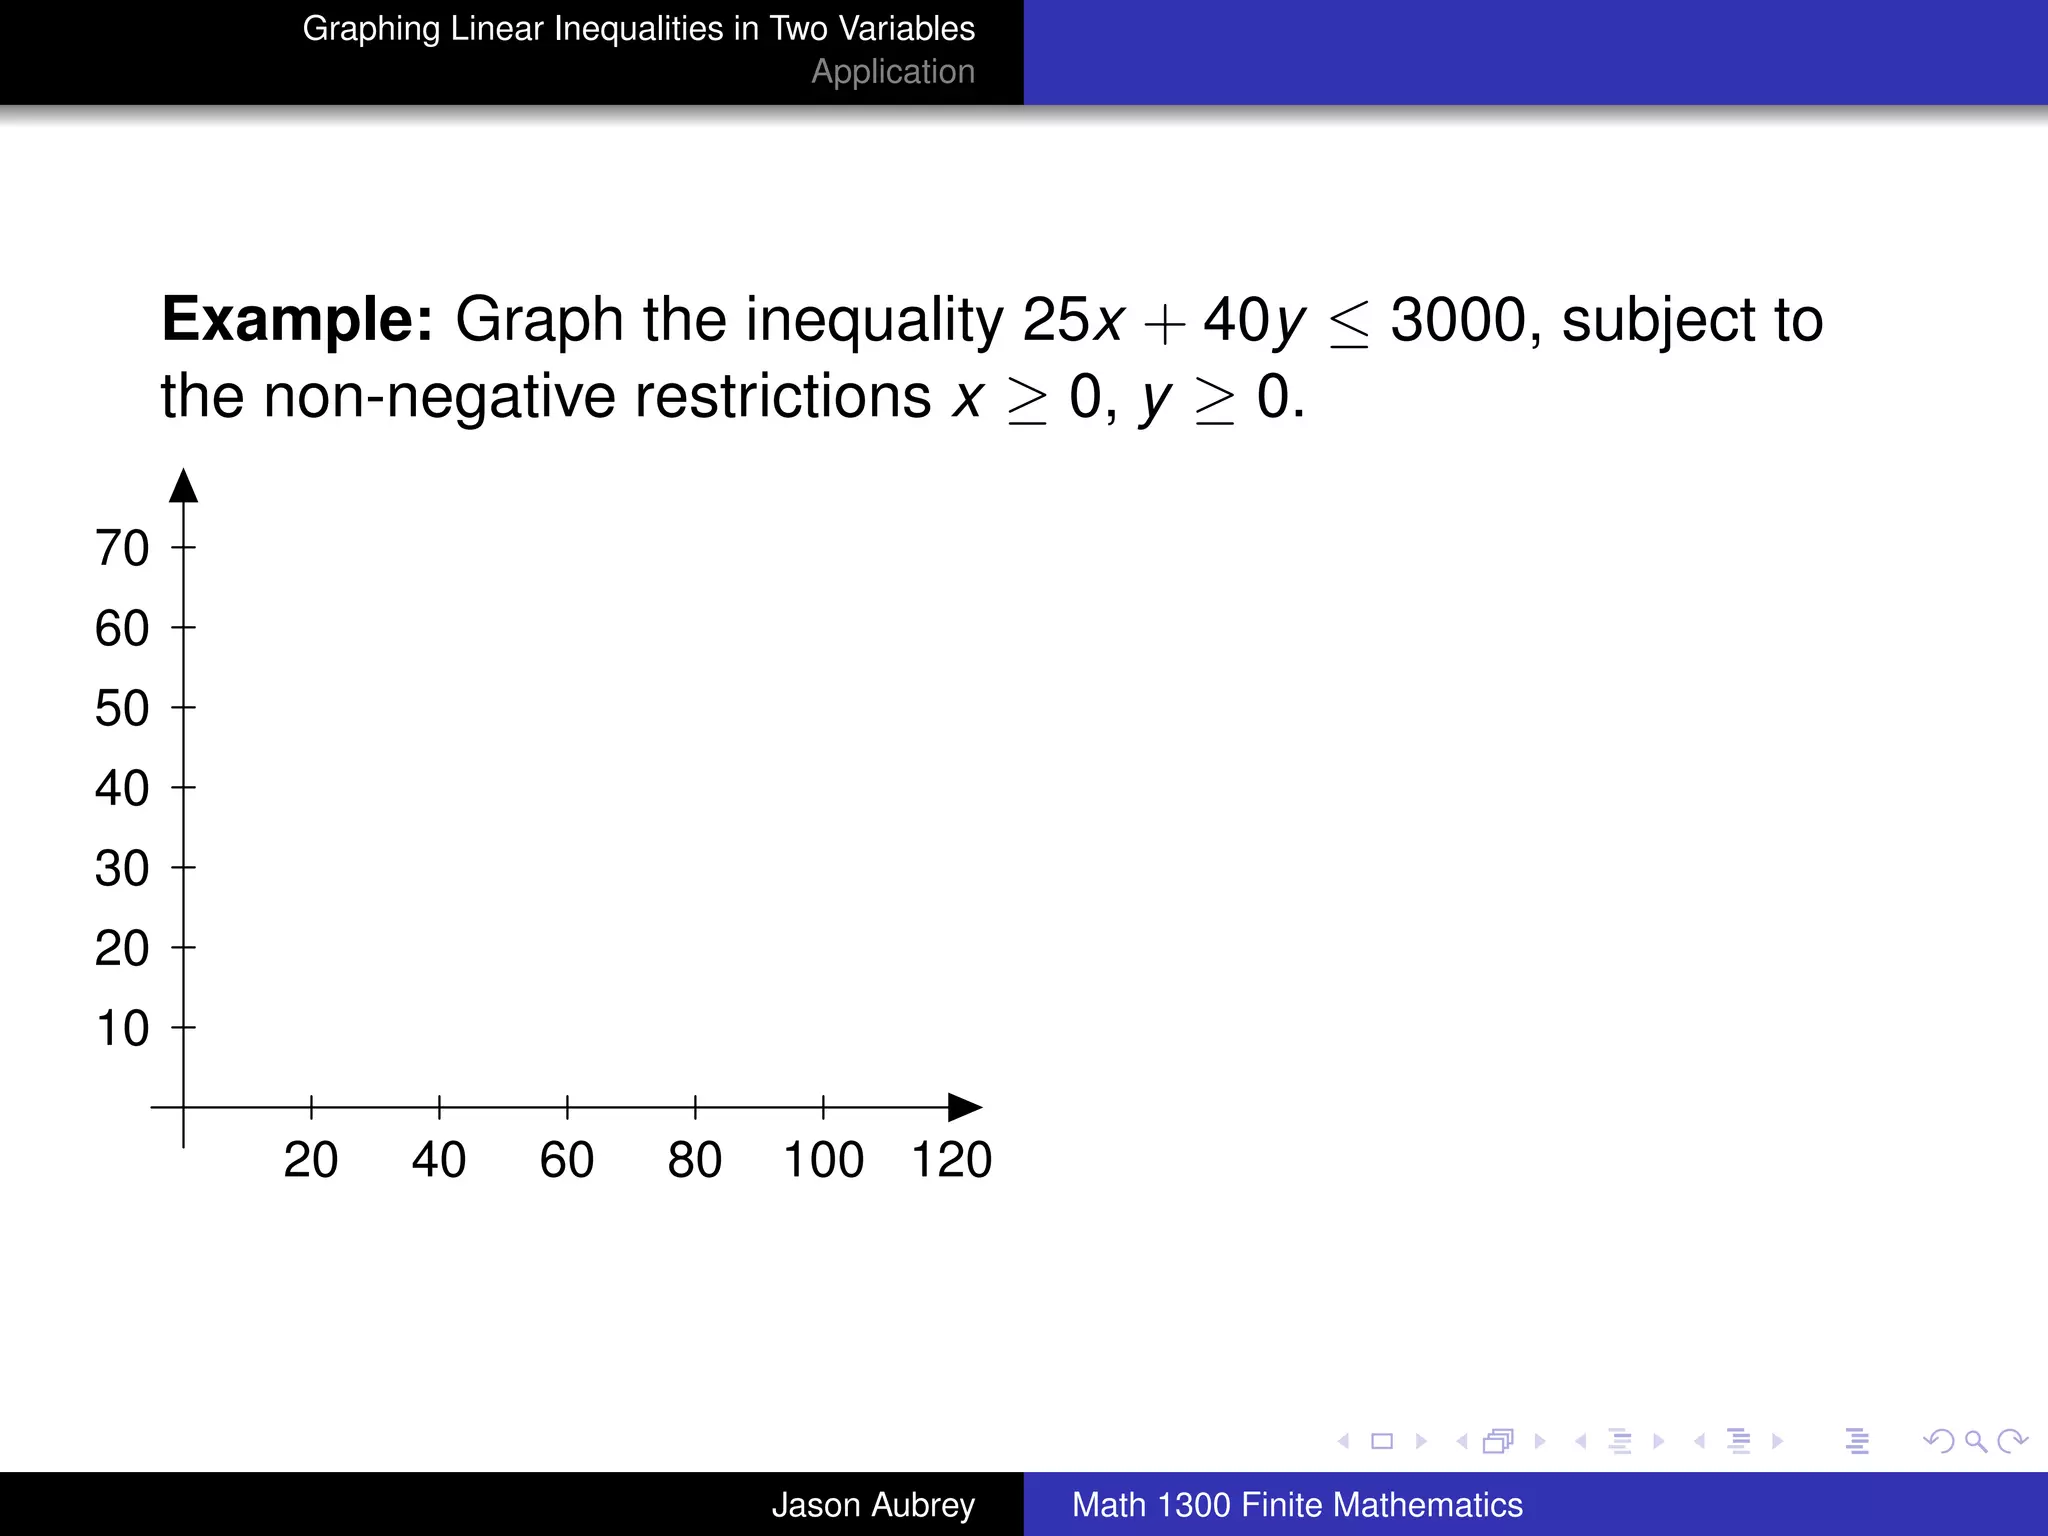
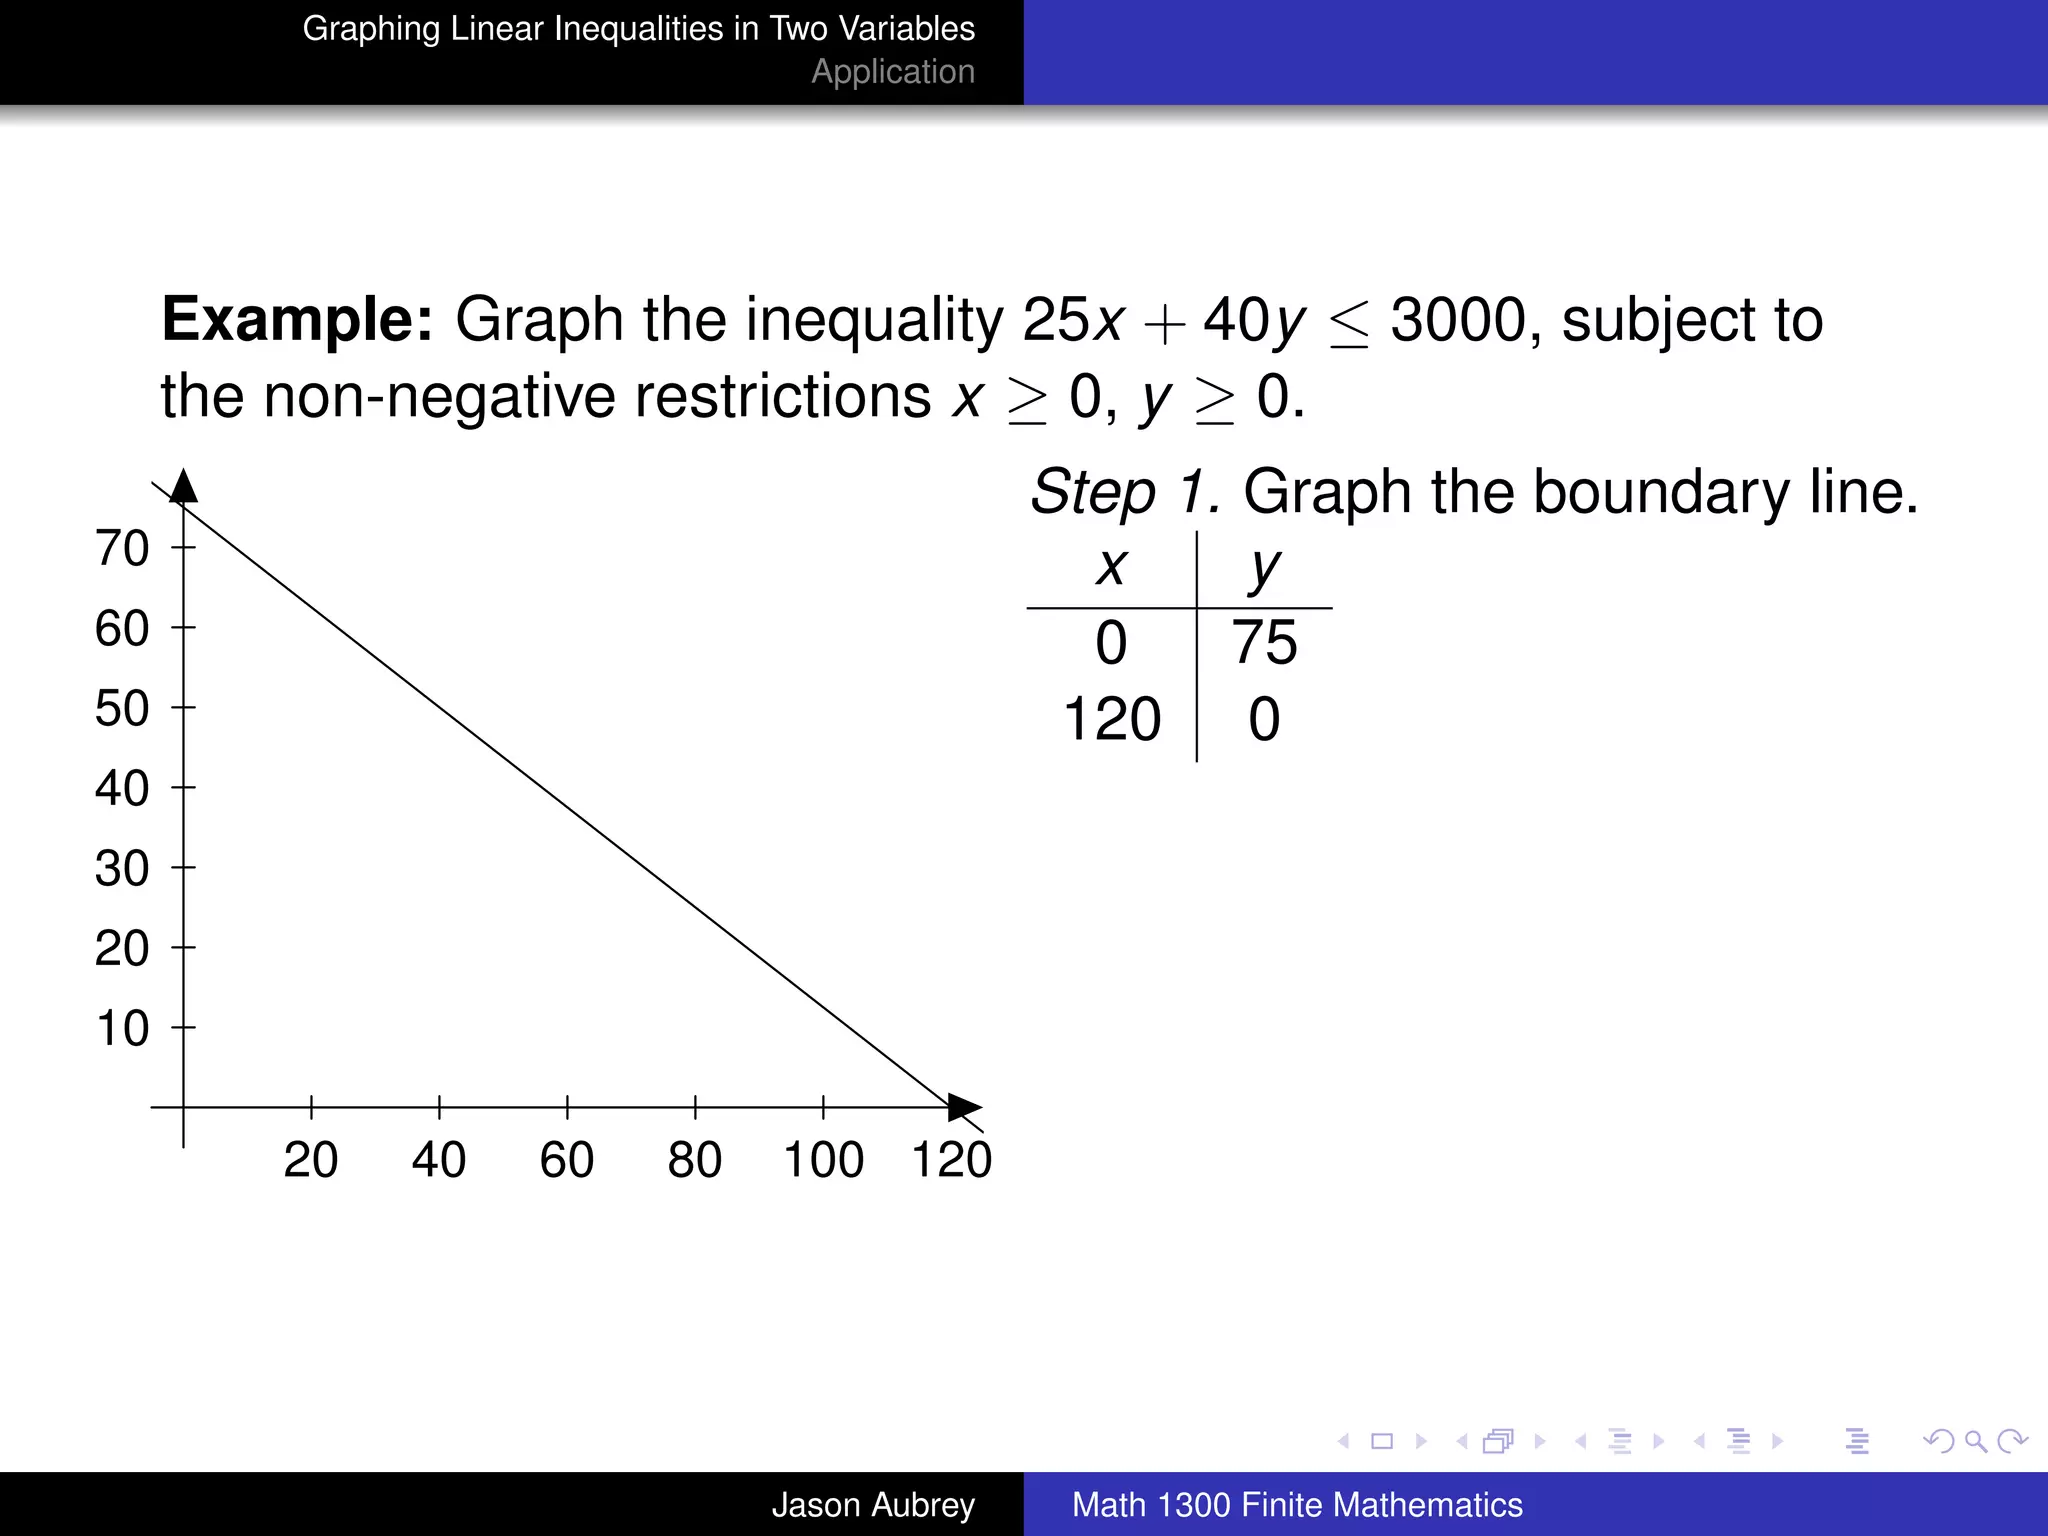
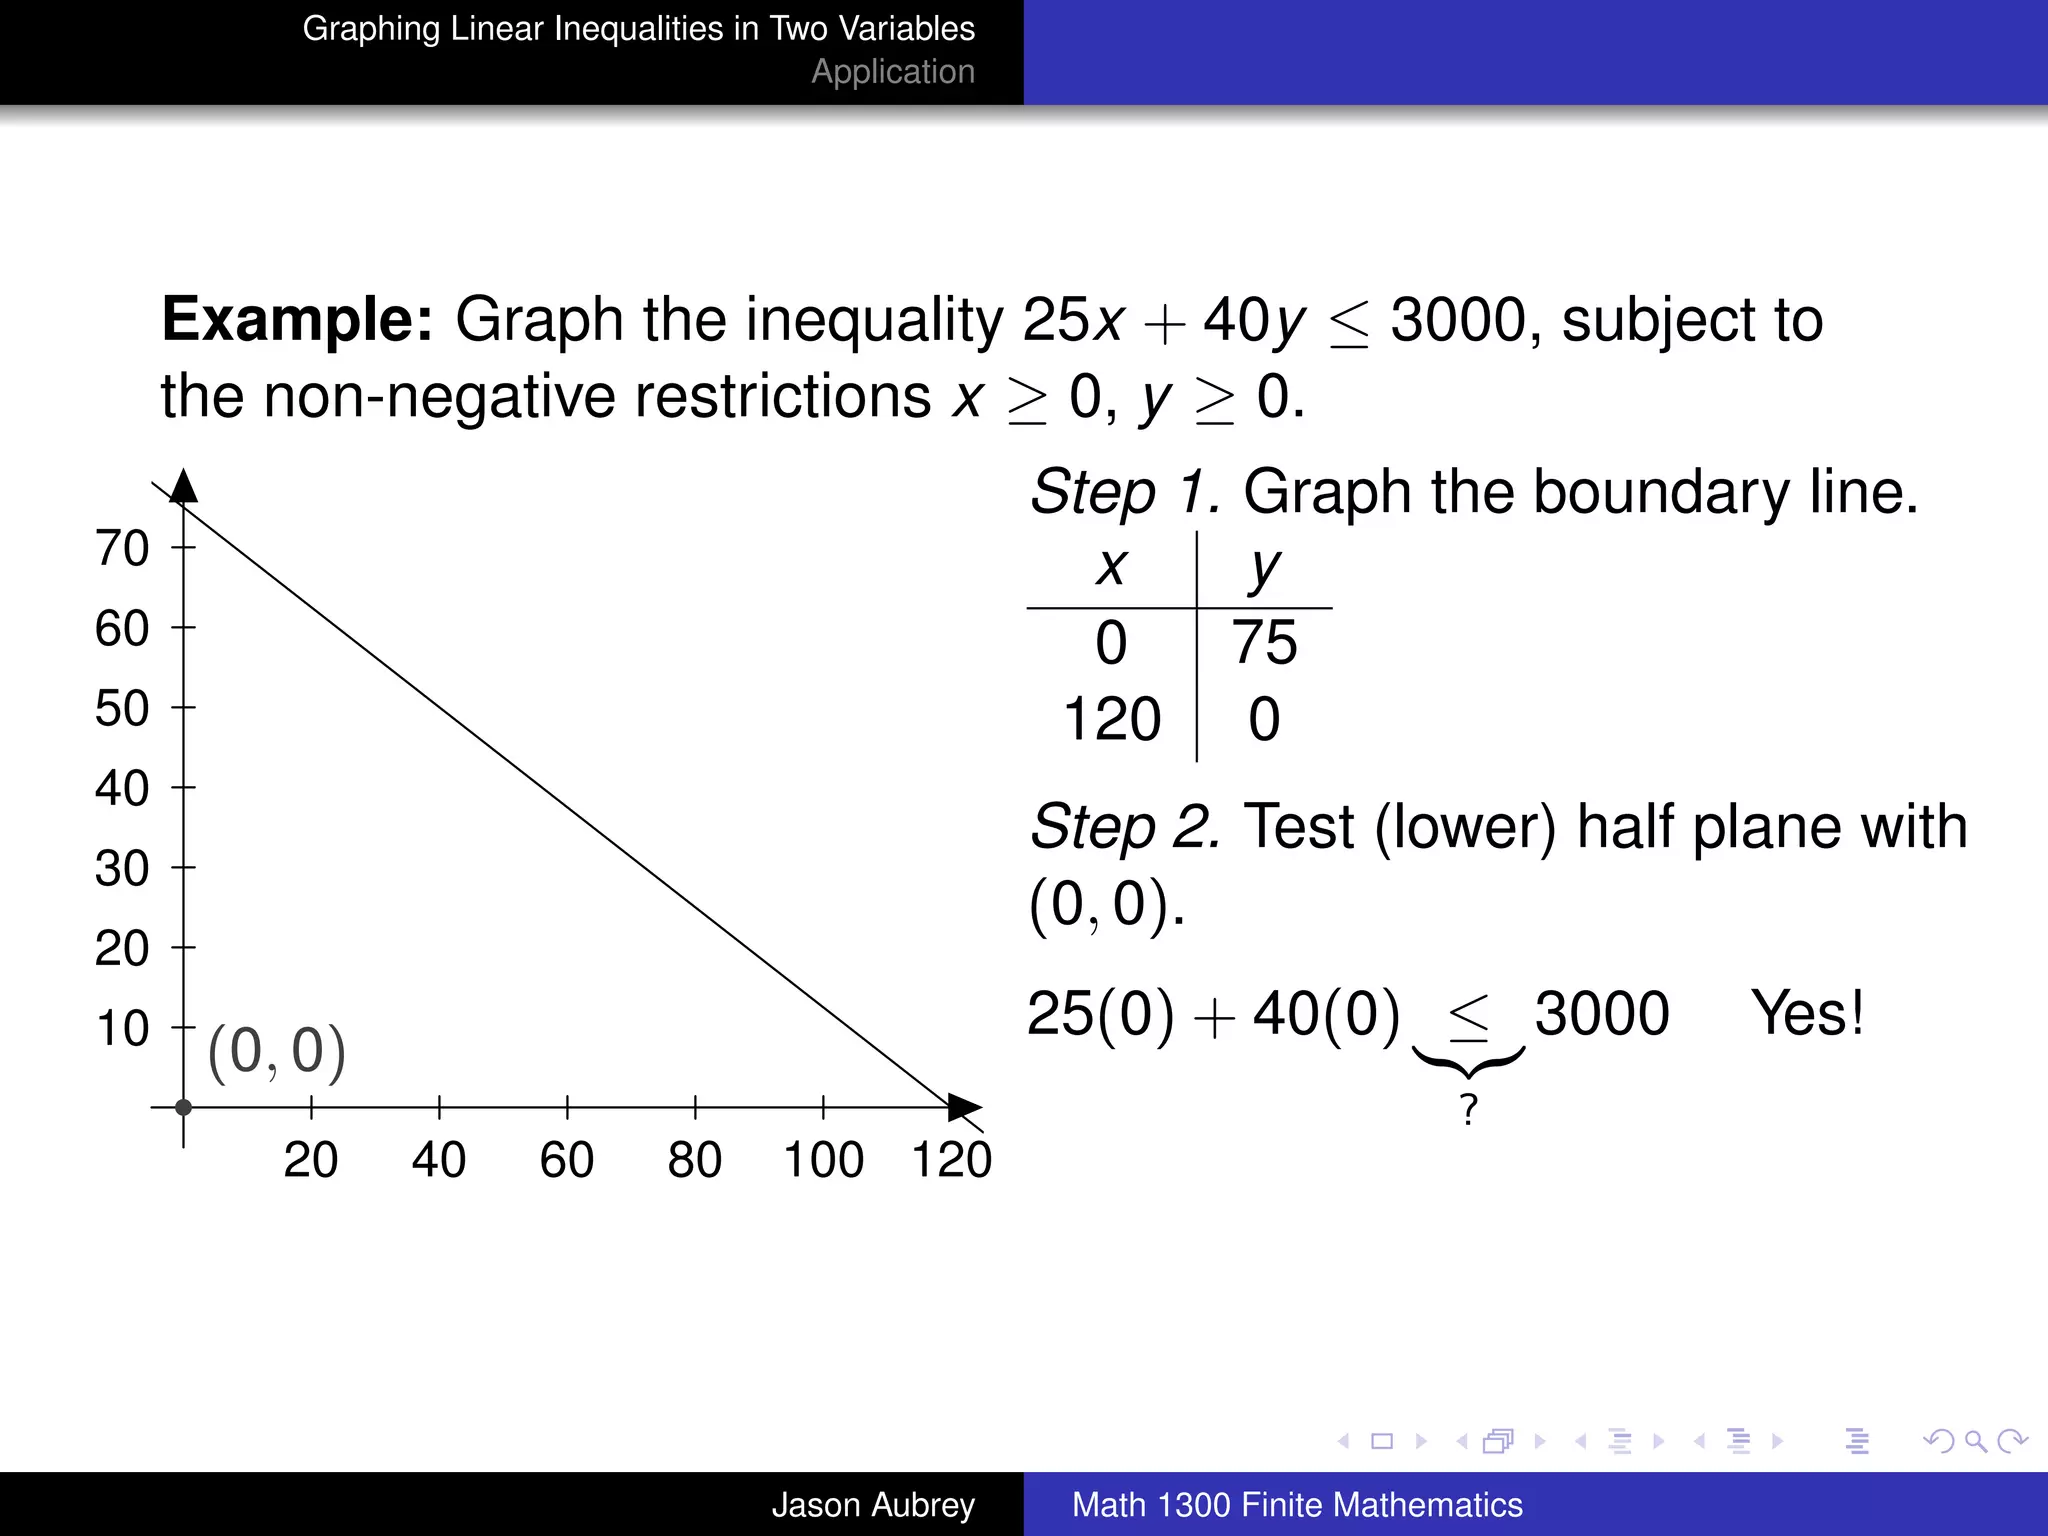
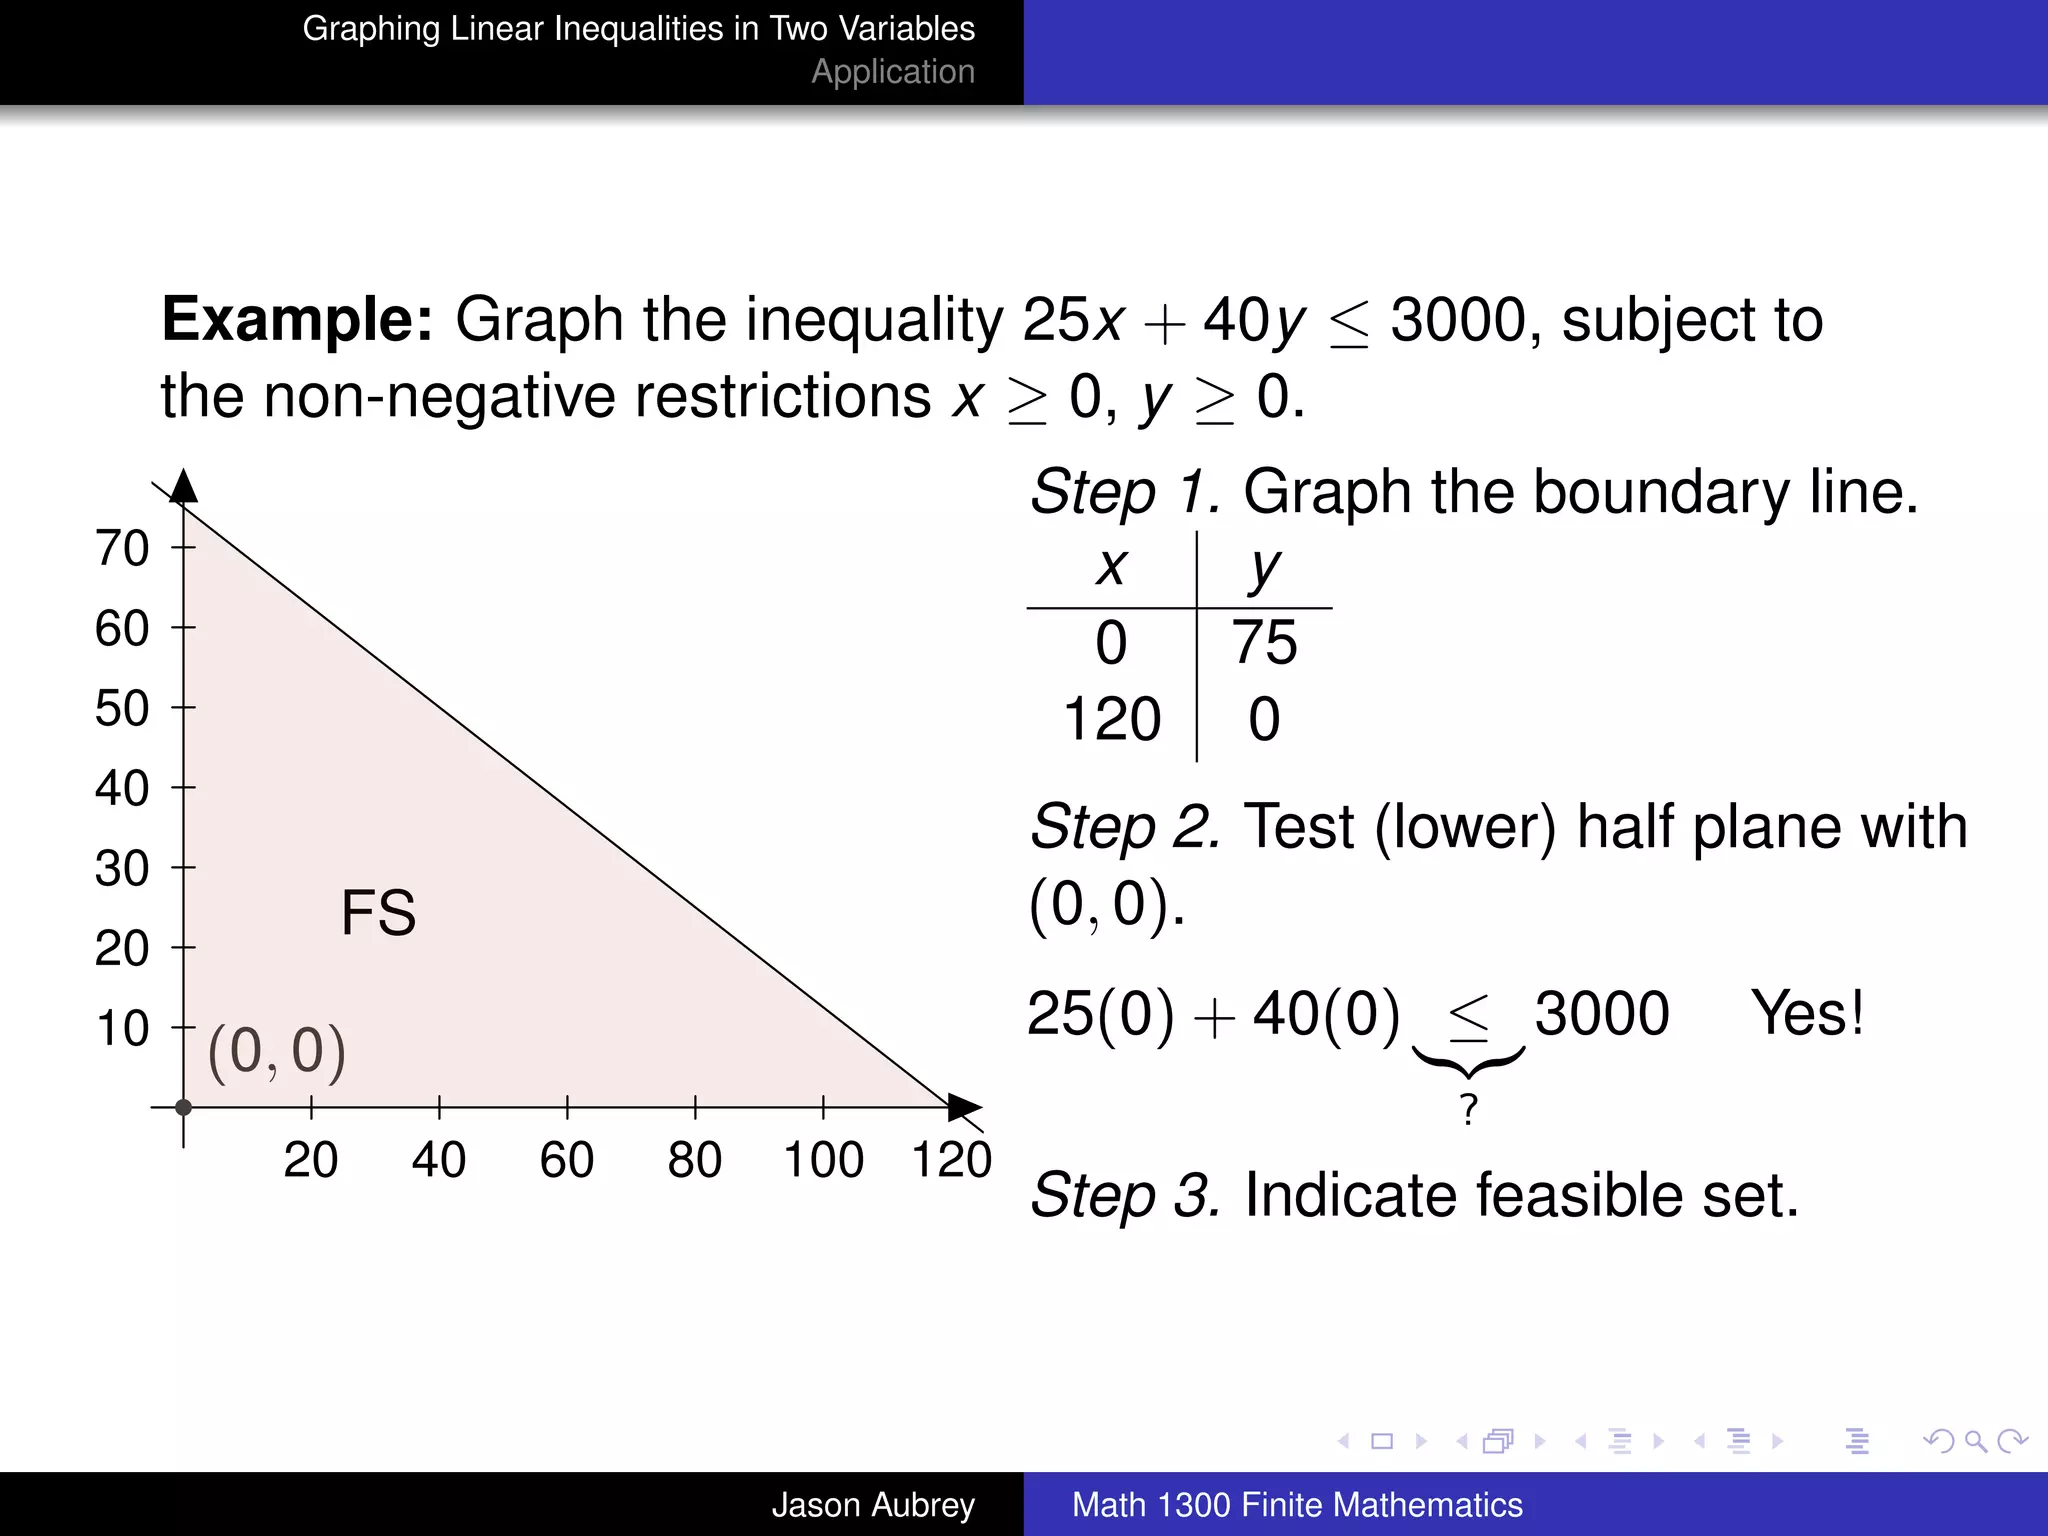
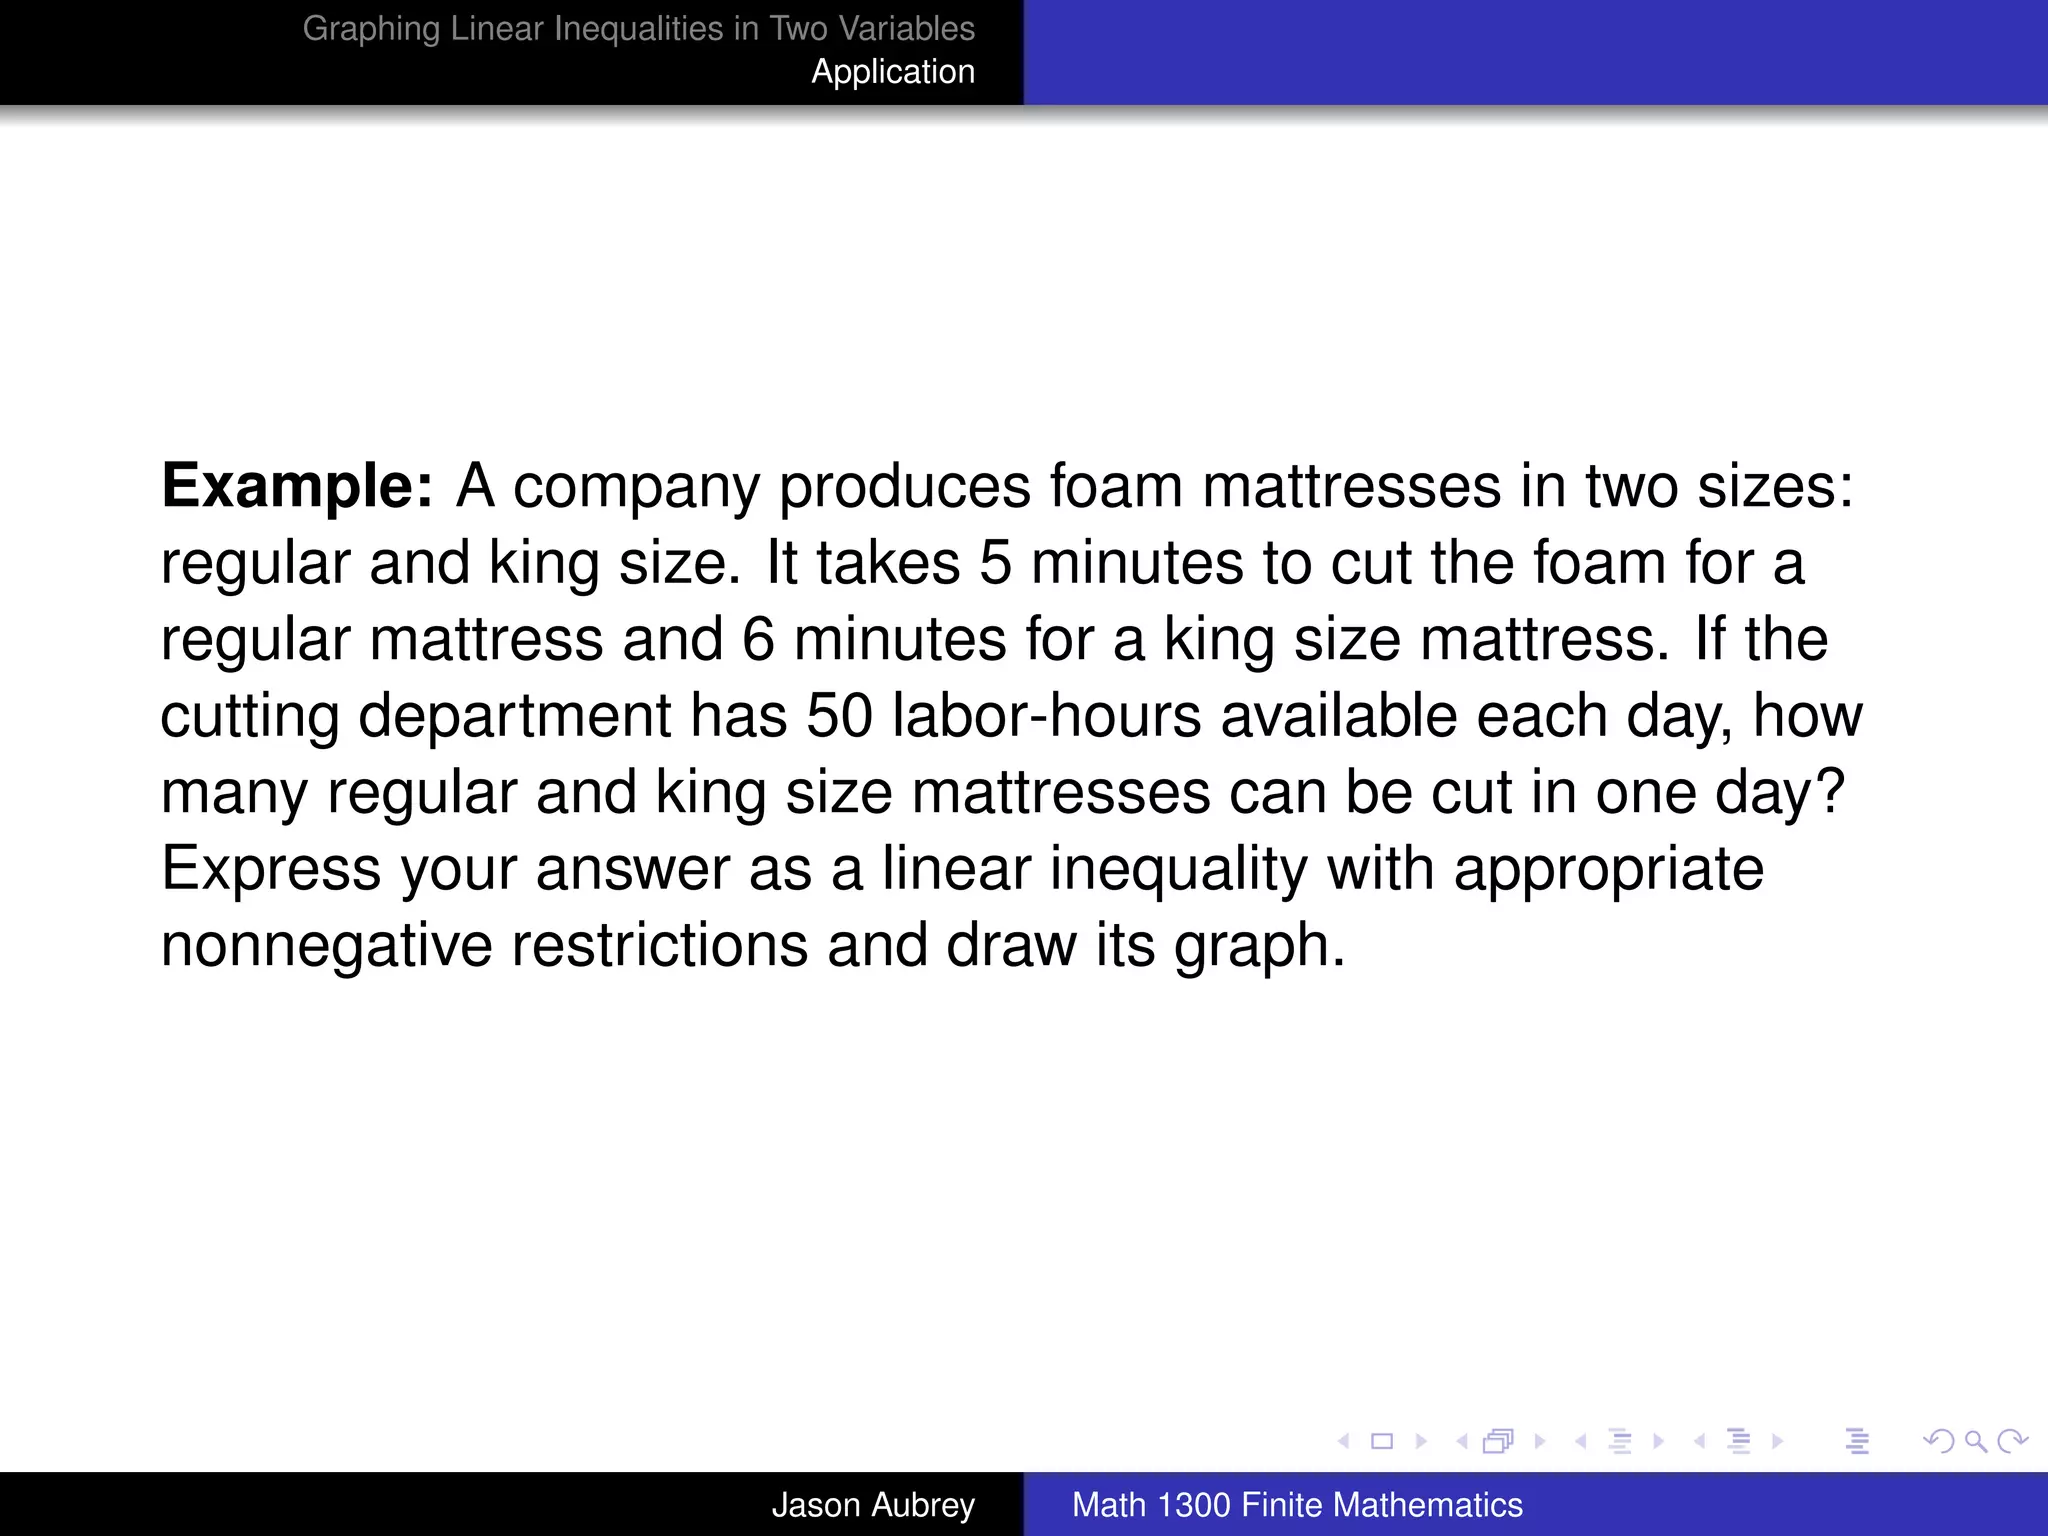
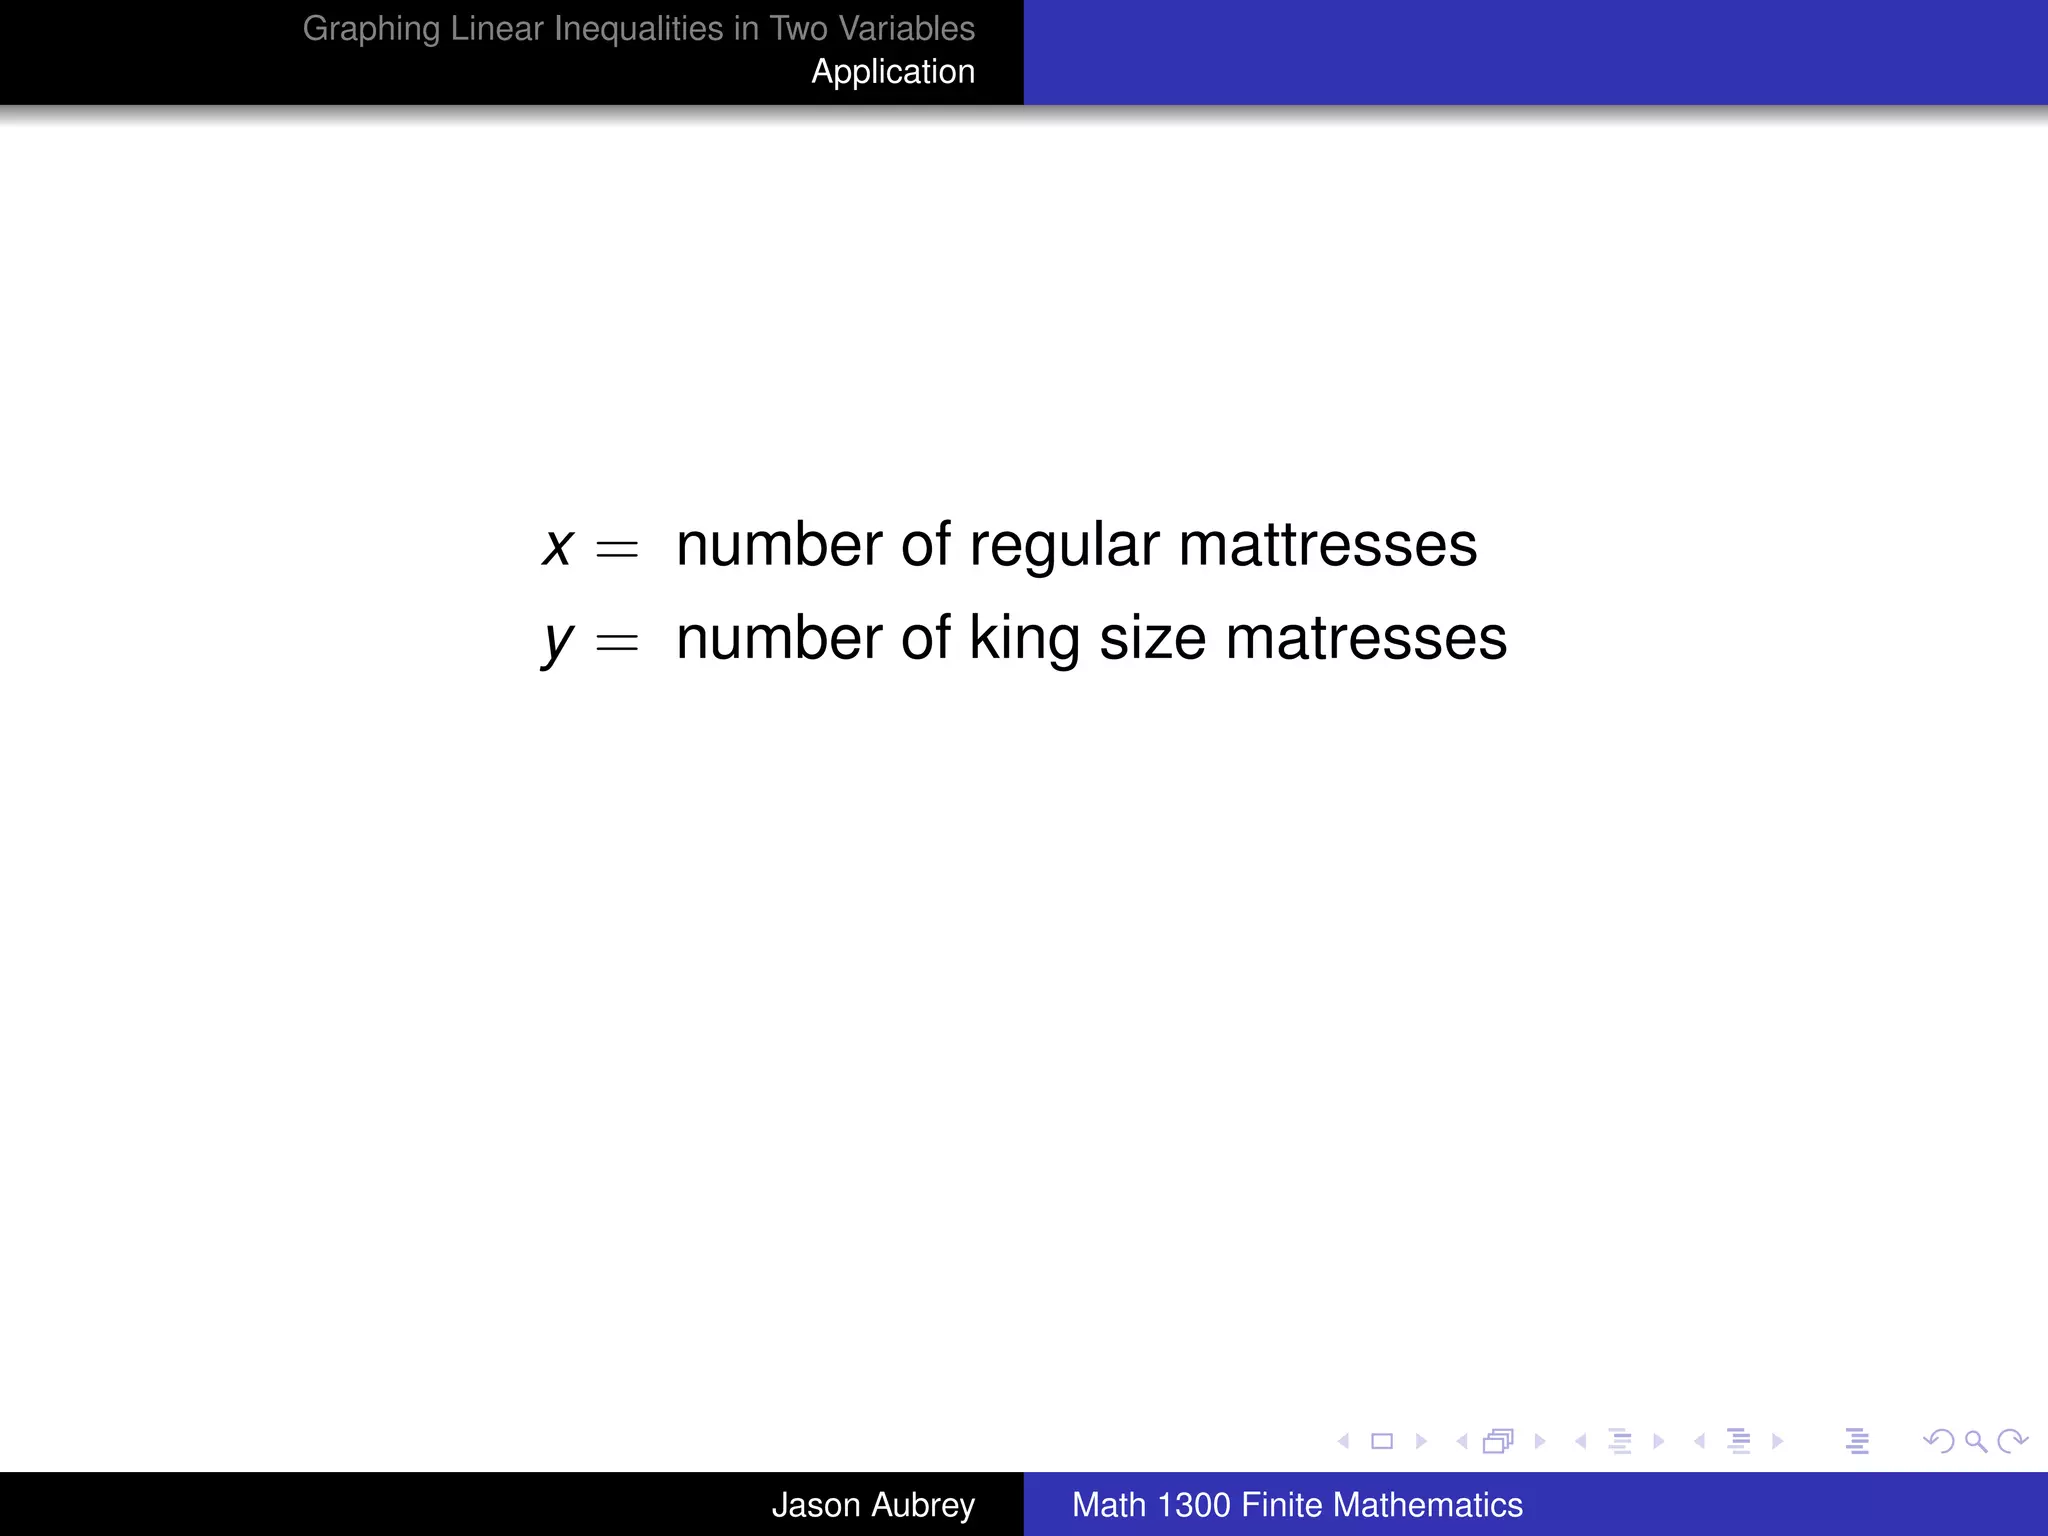
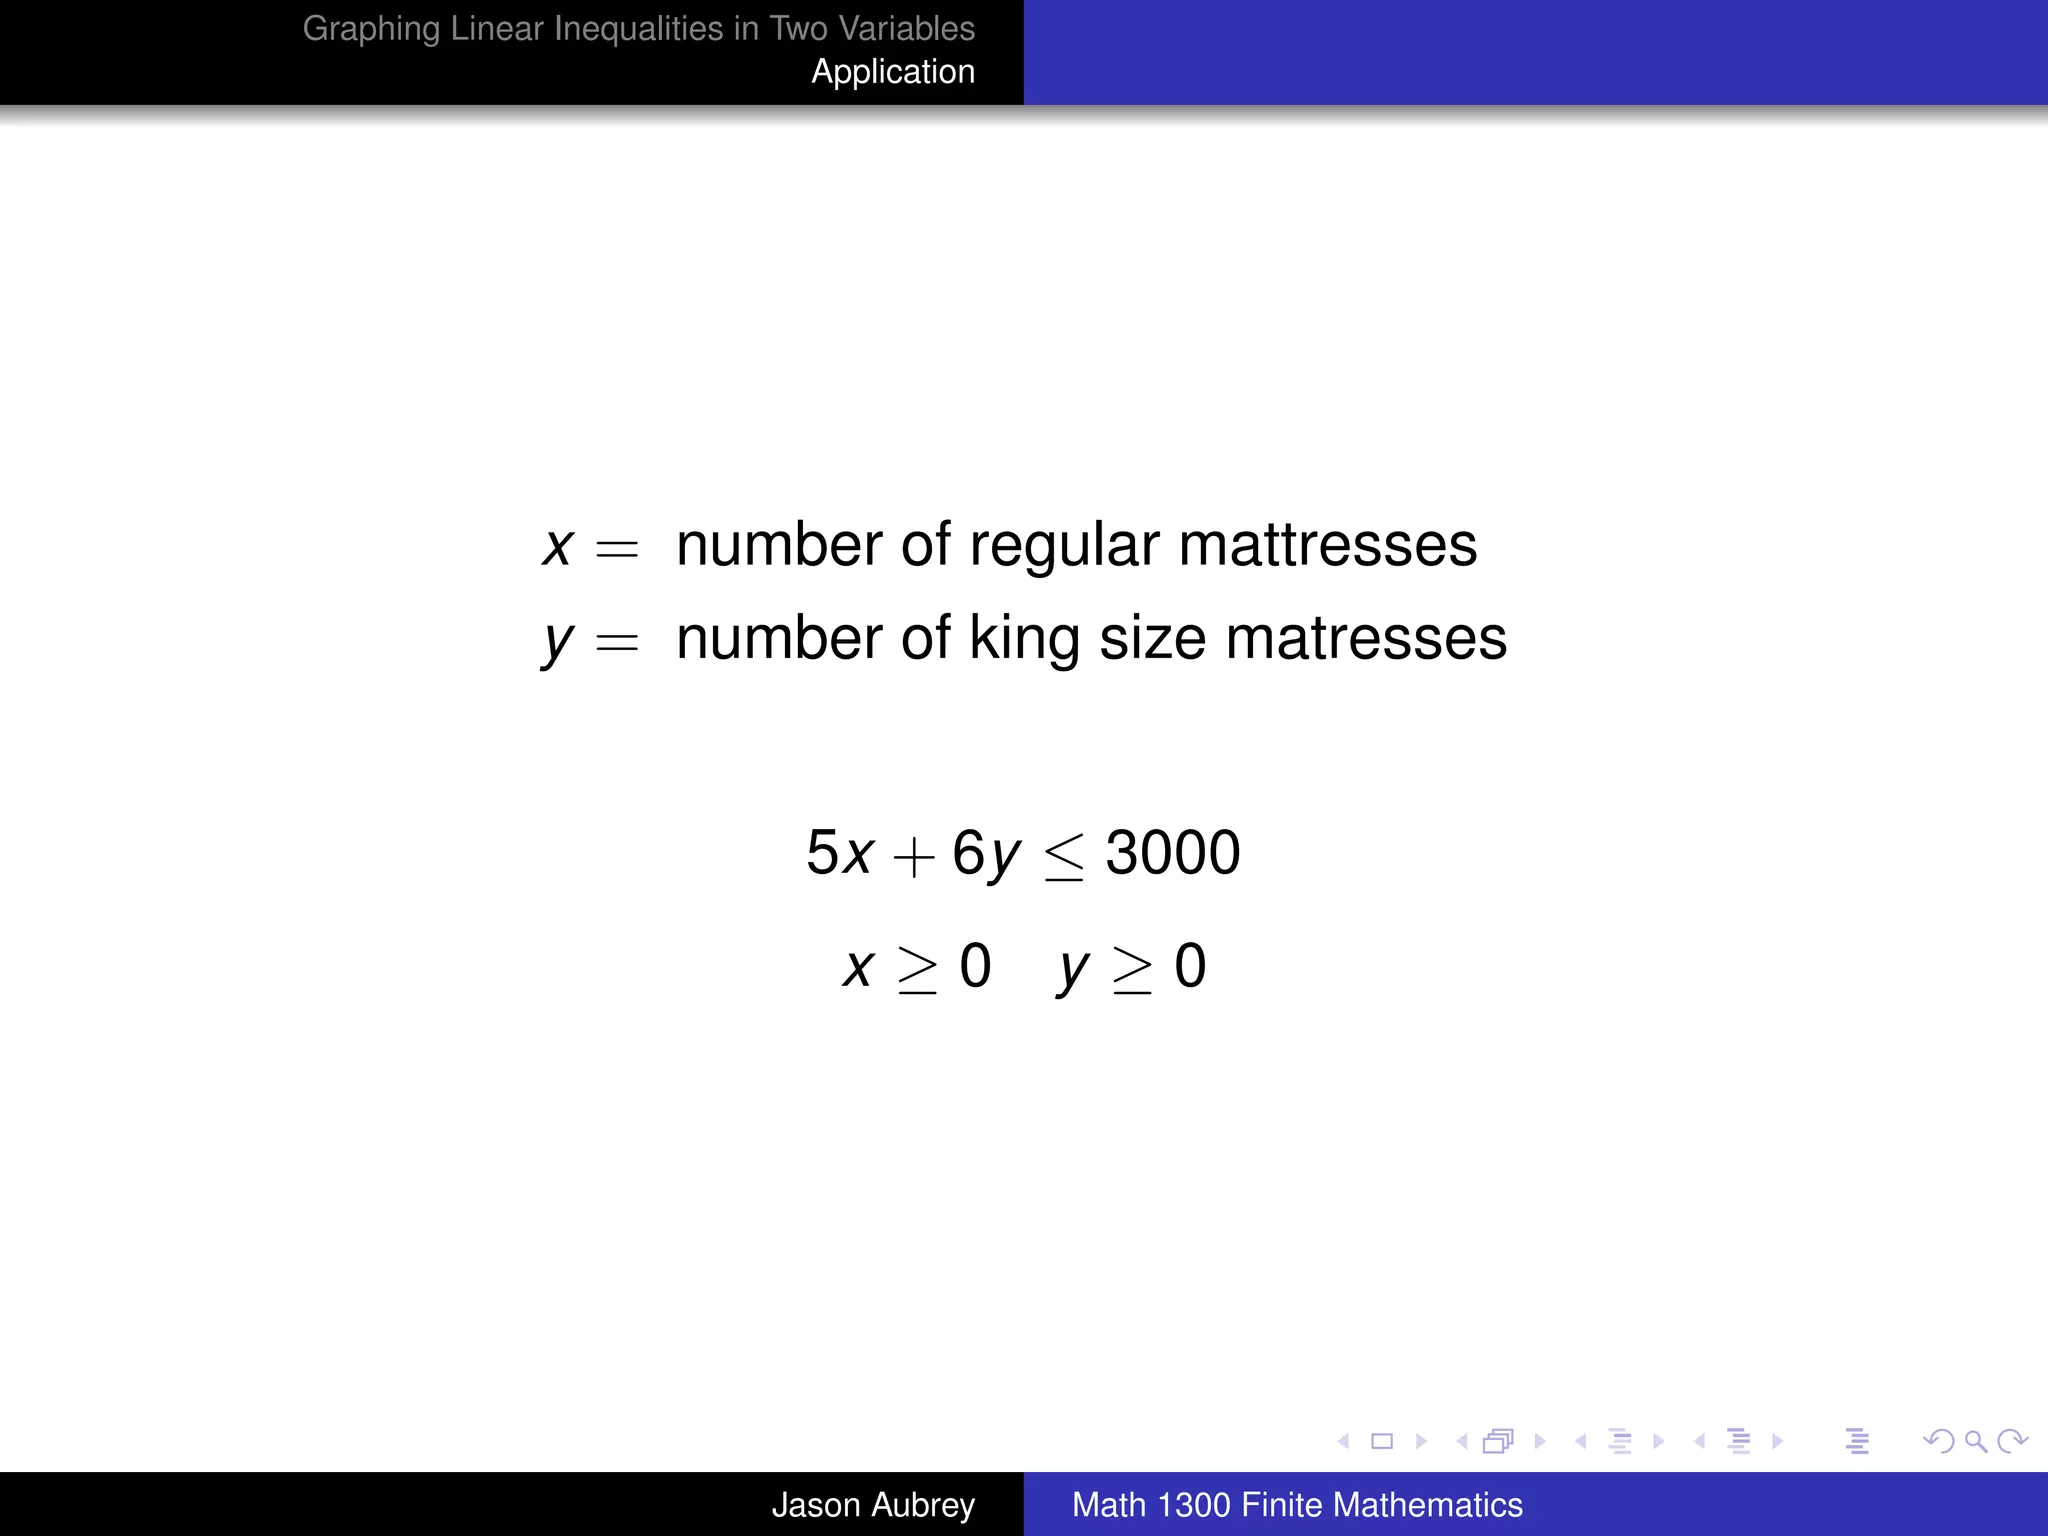

This document discusses how to graph linear inequalities in two variables. It begins by introducing linear equations and noting that linear inequalities need to be graphed differently. Key terminology for half-planes divided by boundary lines is provided. The procedure is then outlined as graphing the boundary line and testing a point to determine which half-plane satisfies the inequality. An example of graphing the inequality y ≤ x - 1 is worked through step-by-step.