Download as PDF, PPTX


![AWK Script to compute Avg Delay
#== =avgDelay.awk ===
# Run with: awk -f avgDelay.awk < trace.tr
BEGIN {
for (i in pktSent) {
pktSent[i] = 0
}
for (i in pktRecvd) {
pktRecvd[i] = 0
}
delay = avgDelay = 0
} # begin ends here
NS-2/AN/Intro/ 20](https://image.slidesharecdn.com/ns2awkplotlab3-170531091213/85/NS2-AWK-and-GNUplot-PArt-III-20-320.jpg)
![Avg Delay script contd.
{
event = $1
time = $2
intSrc=$3
intDest=$4
src=$9
dest=$10
pktSeq = $12
intSrc = (intSrc".0")
intDest = (intDest".0")
# Store packets send times
if (pktSent[pktSeq] == 0 && event == "+" && intSrc == src) {
pktSent[pktSeq] = time
} NS-2/AN/Intro/ 21](https://image.slidesharecdn.com/ns2awkplotlab3-170531091213/85/NS2-AWK-and-GNUplot-PArt-III-21-320.jpg)
![Avg Delay script contd. - I
# Store packets arrival time
if (event == "r" && intDest == dest) {
pktRecvd[pktSeq] = time
}
}
END {
# Compute average delay
for (i in pktRecvd) {
if (pktSent[i] == 0) {
printf("nError %gn",i)
}
delay += pktRecvd[i] - pktSent[i]
num ++
} NS-2/AN/Intro/ 22](https://image.slidesharecdn.com/ns2awkplotlab3-170531091213/85/NS2-AWK-and-GNUplot-PArt-III-22-320.jpg)

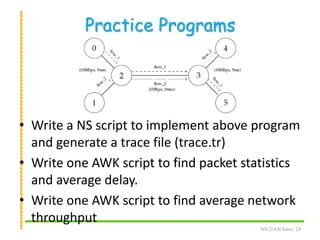


This document provides an introduction to the scripting languages AWK and GNUPlot. It discusses basics of AWK including its structure and examples of using AWK to parse text files and extract fields. It also covers basics of GNUPlot including how to generate different plot types from data files and customize plots. Finally, it provides examples of using AWK to analyze network simulation trace files generated by NS-2 to calculate packet statistics and average delay.


![Data Analytics Life Cycle [EMC² - Data Science and Big data analytics]](https://cdn.slidesharecdn.com/ss_thumbnails/bdalifecycle-slideshare-211028070344-thumbnail.jpg?width=640&height=640&fit=bounds)