Download as PDF, PPTX


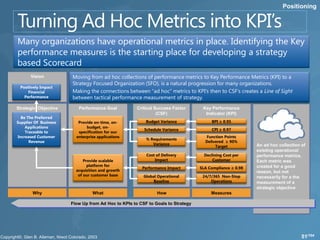
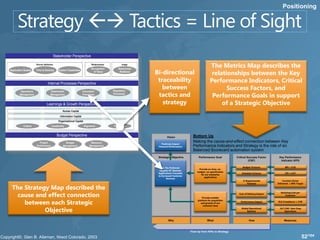
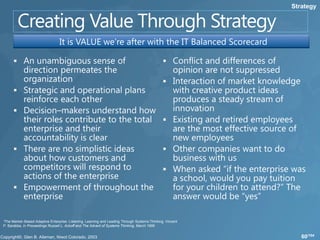
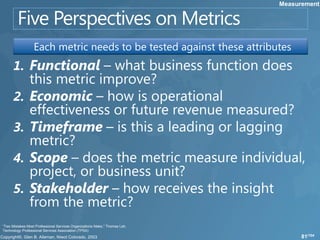
![Positioning
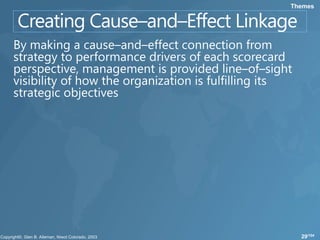
Instituting change is at the heart of a successful Scorecard
In many studies of patients who have undergone coronary bypass
surgery, only one in nine people, on average, adopts healthier day-to-day
habits […] [even if] they clearly see the value of changing their behavior.
“The Neuroscience of Leadership,” David Rock and Jeffery Schwartz, strategy+business, Summer 2006
43/104](https://image.slidesharecdn.com/notesonbalancedscorecardmsftformat-110226103727-phpapp02/85/Notes-on-balanced-scorecard-43-320.jpg)

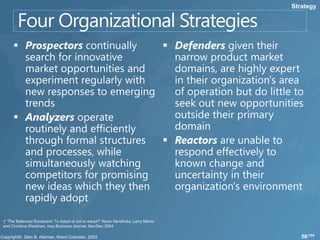
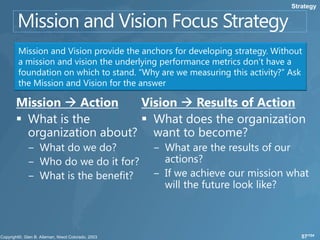
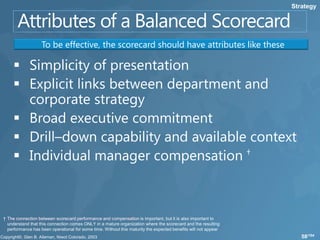
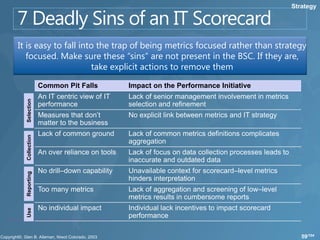


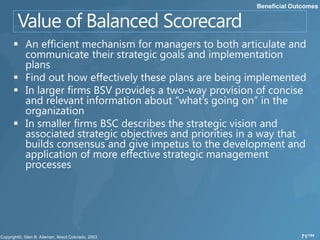


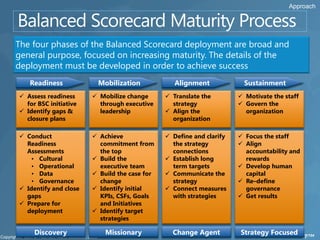
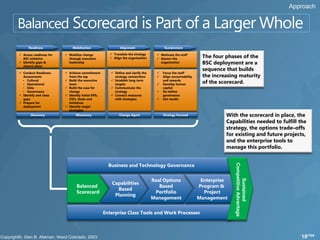
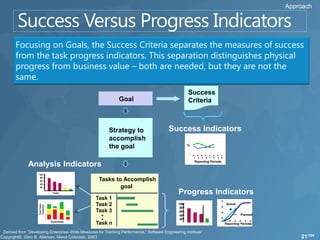
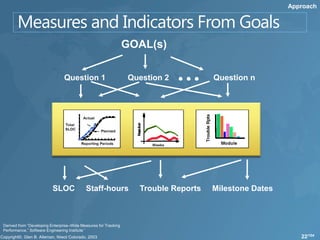
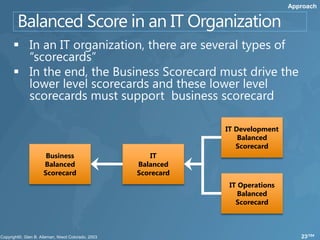
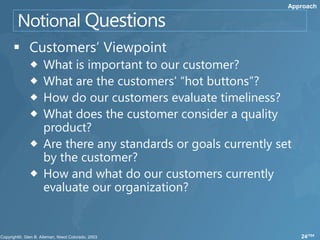
The document outlines the balanced scorecard (BSC) as a vital performance management tool that aligns business and IT strategies through a structured framework. It discusses key components such as mission and vision, strategic initiatives, and the four phases of BSC deployment: readiness, mobilization, alignment, and sustainment. Ultimately, it emphasizes the importance of connecting performance metrics to strategic goals to foster organizational success and avoid common pitfalls of strategy execution.