Downloaded 224 times


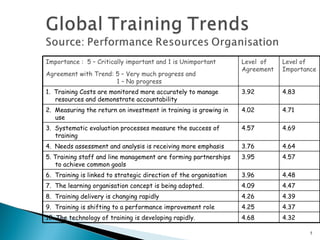
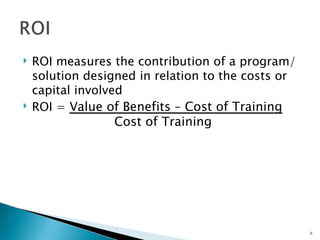

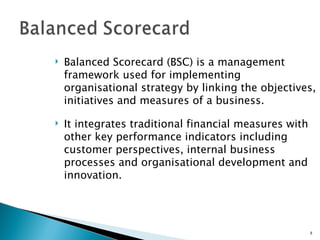
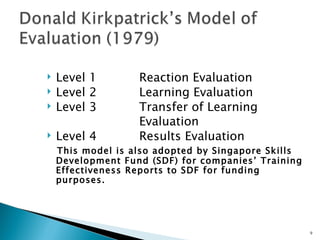


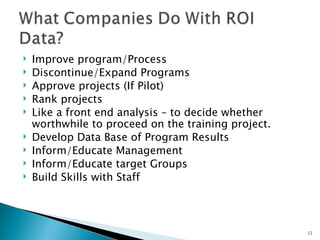
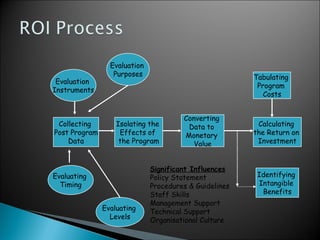

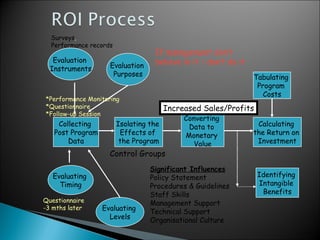


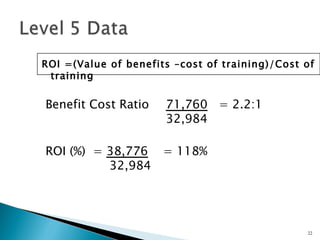

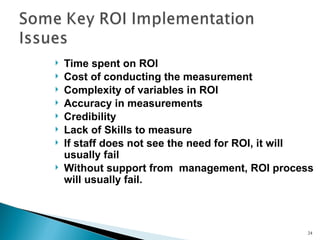
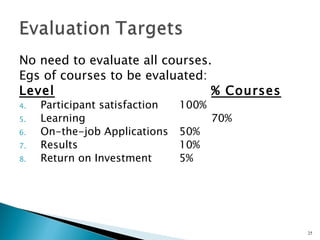


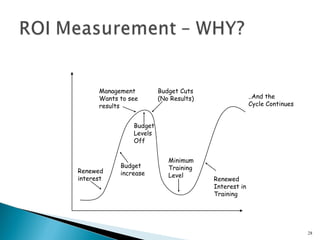


The document discusses the importance of measuring return on investment (ROI) in training programs to evaluate their effectiveness as training budgets increase in various regions. It outlines several key evaluation models and frameworks, such as the balanced scorecard and Kirkpatrick's four-level evaluation, emphasizing the need for systematic evaluation and accountability. Additionally, various companies are highlighted to exemplify successful ROI calculations, illustrating how training initiatives can positively impact productivity and profitability.