Downloaded 1,232 times


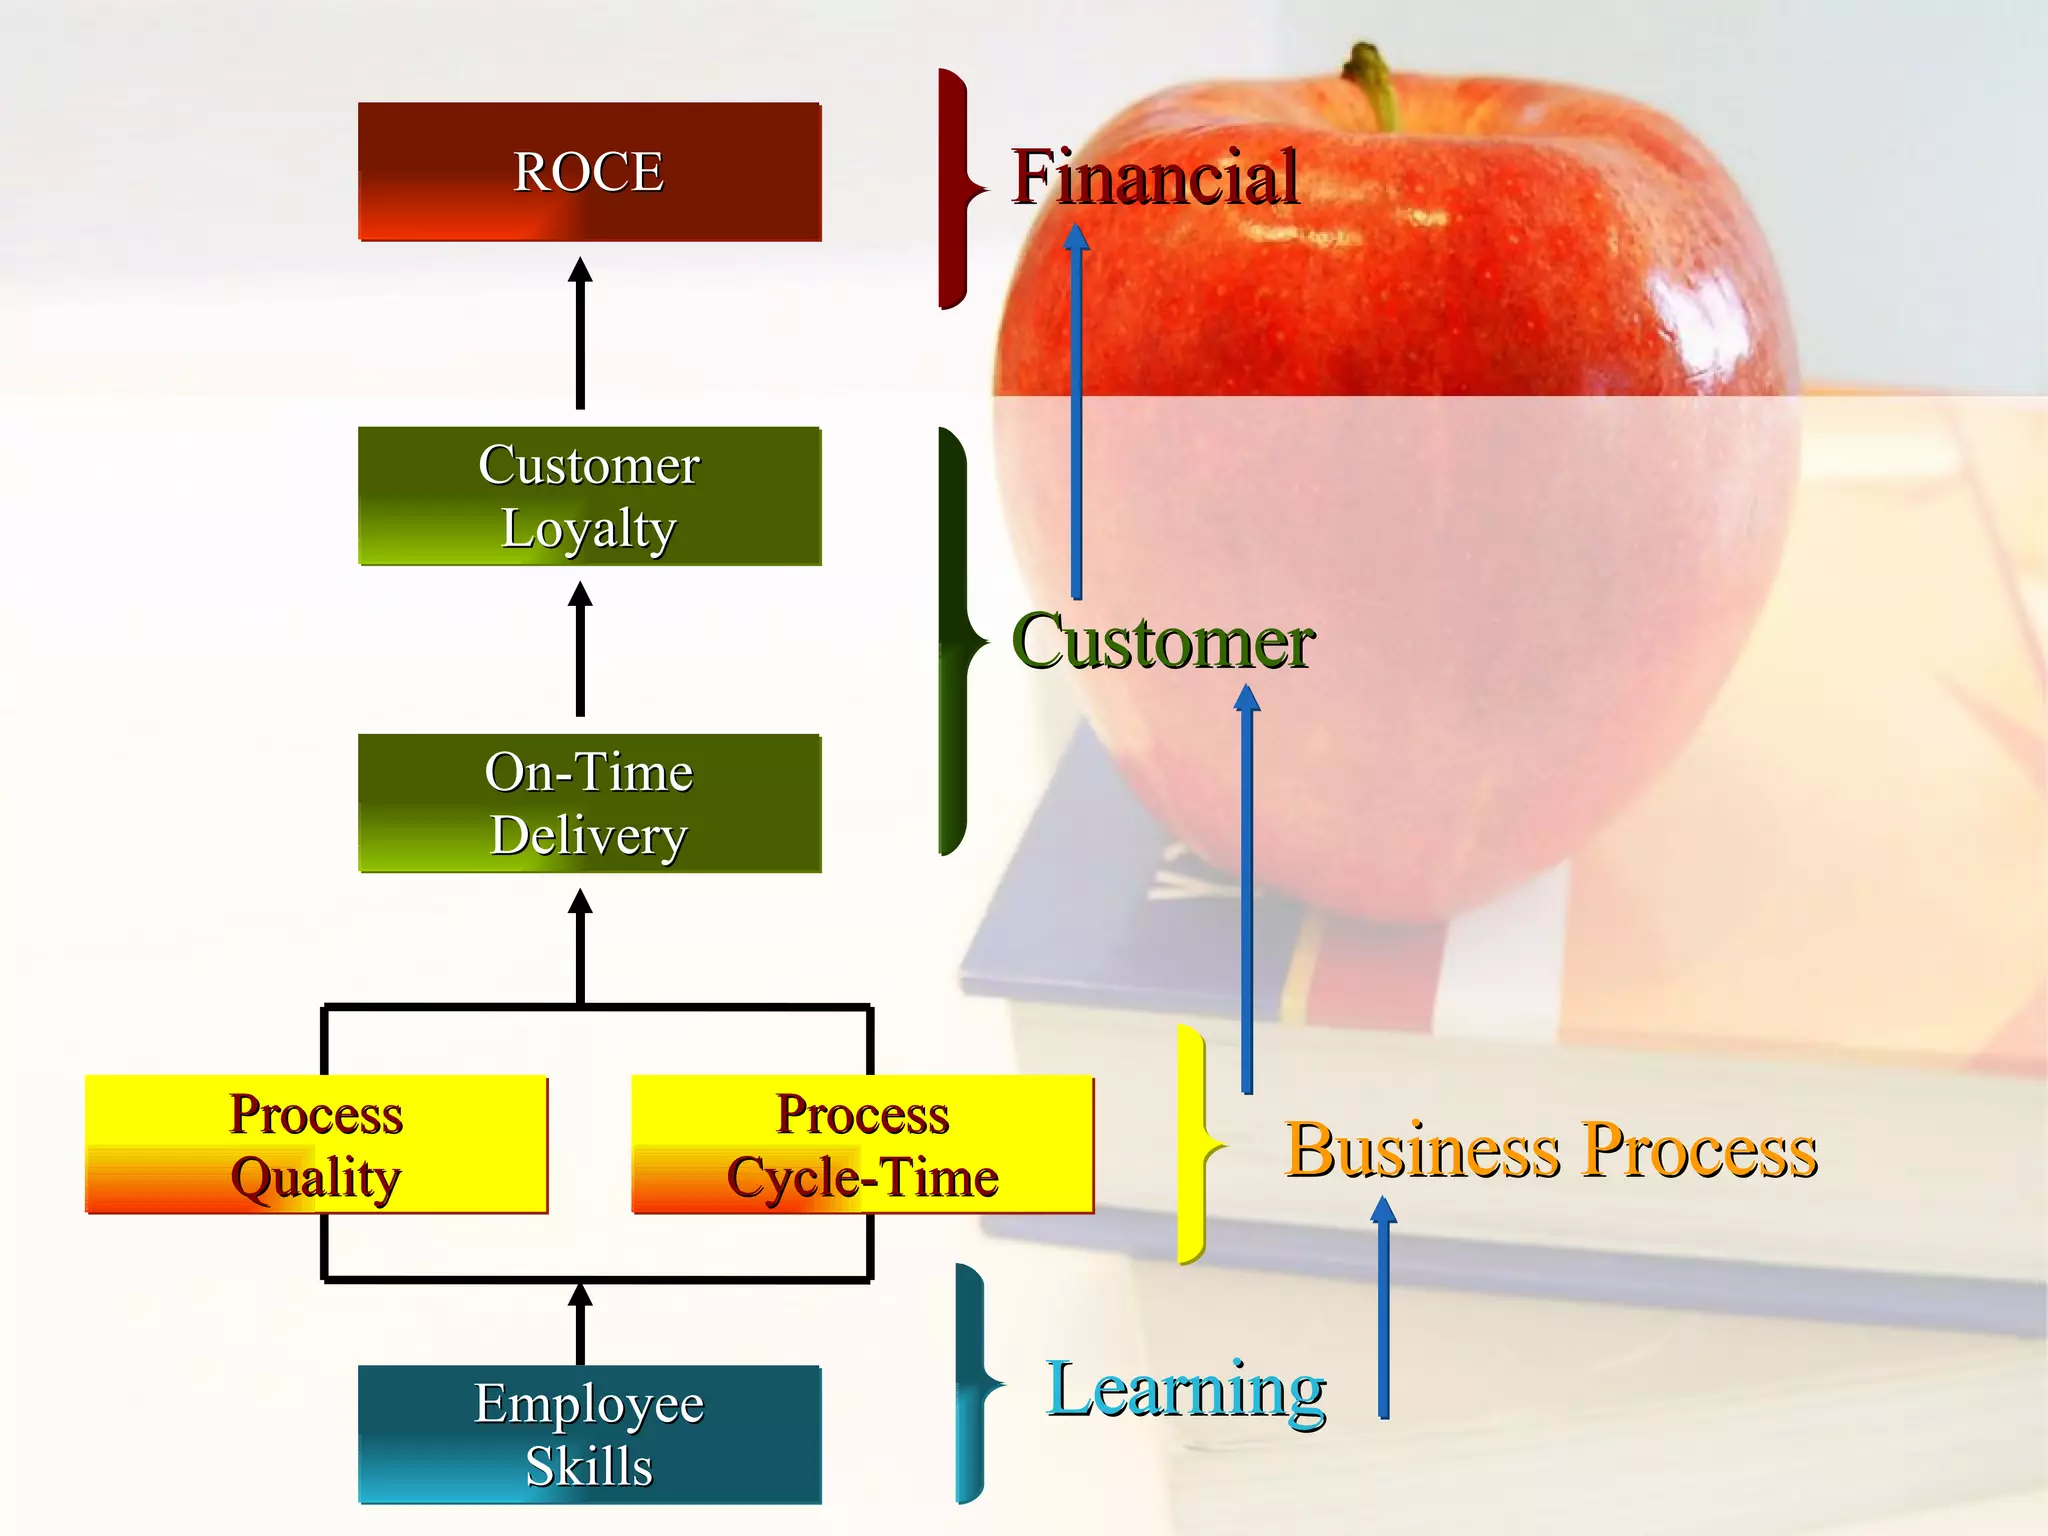
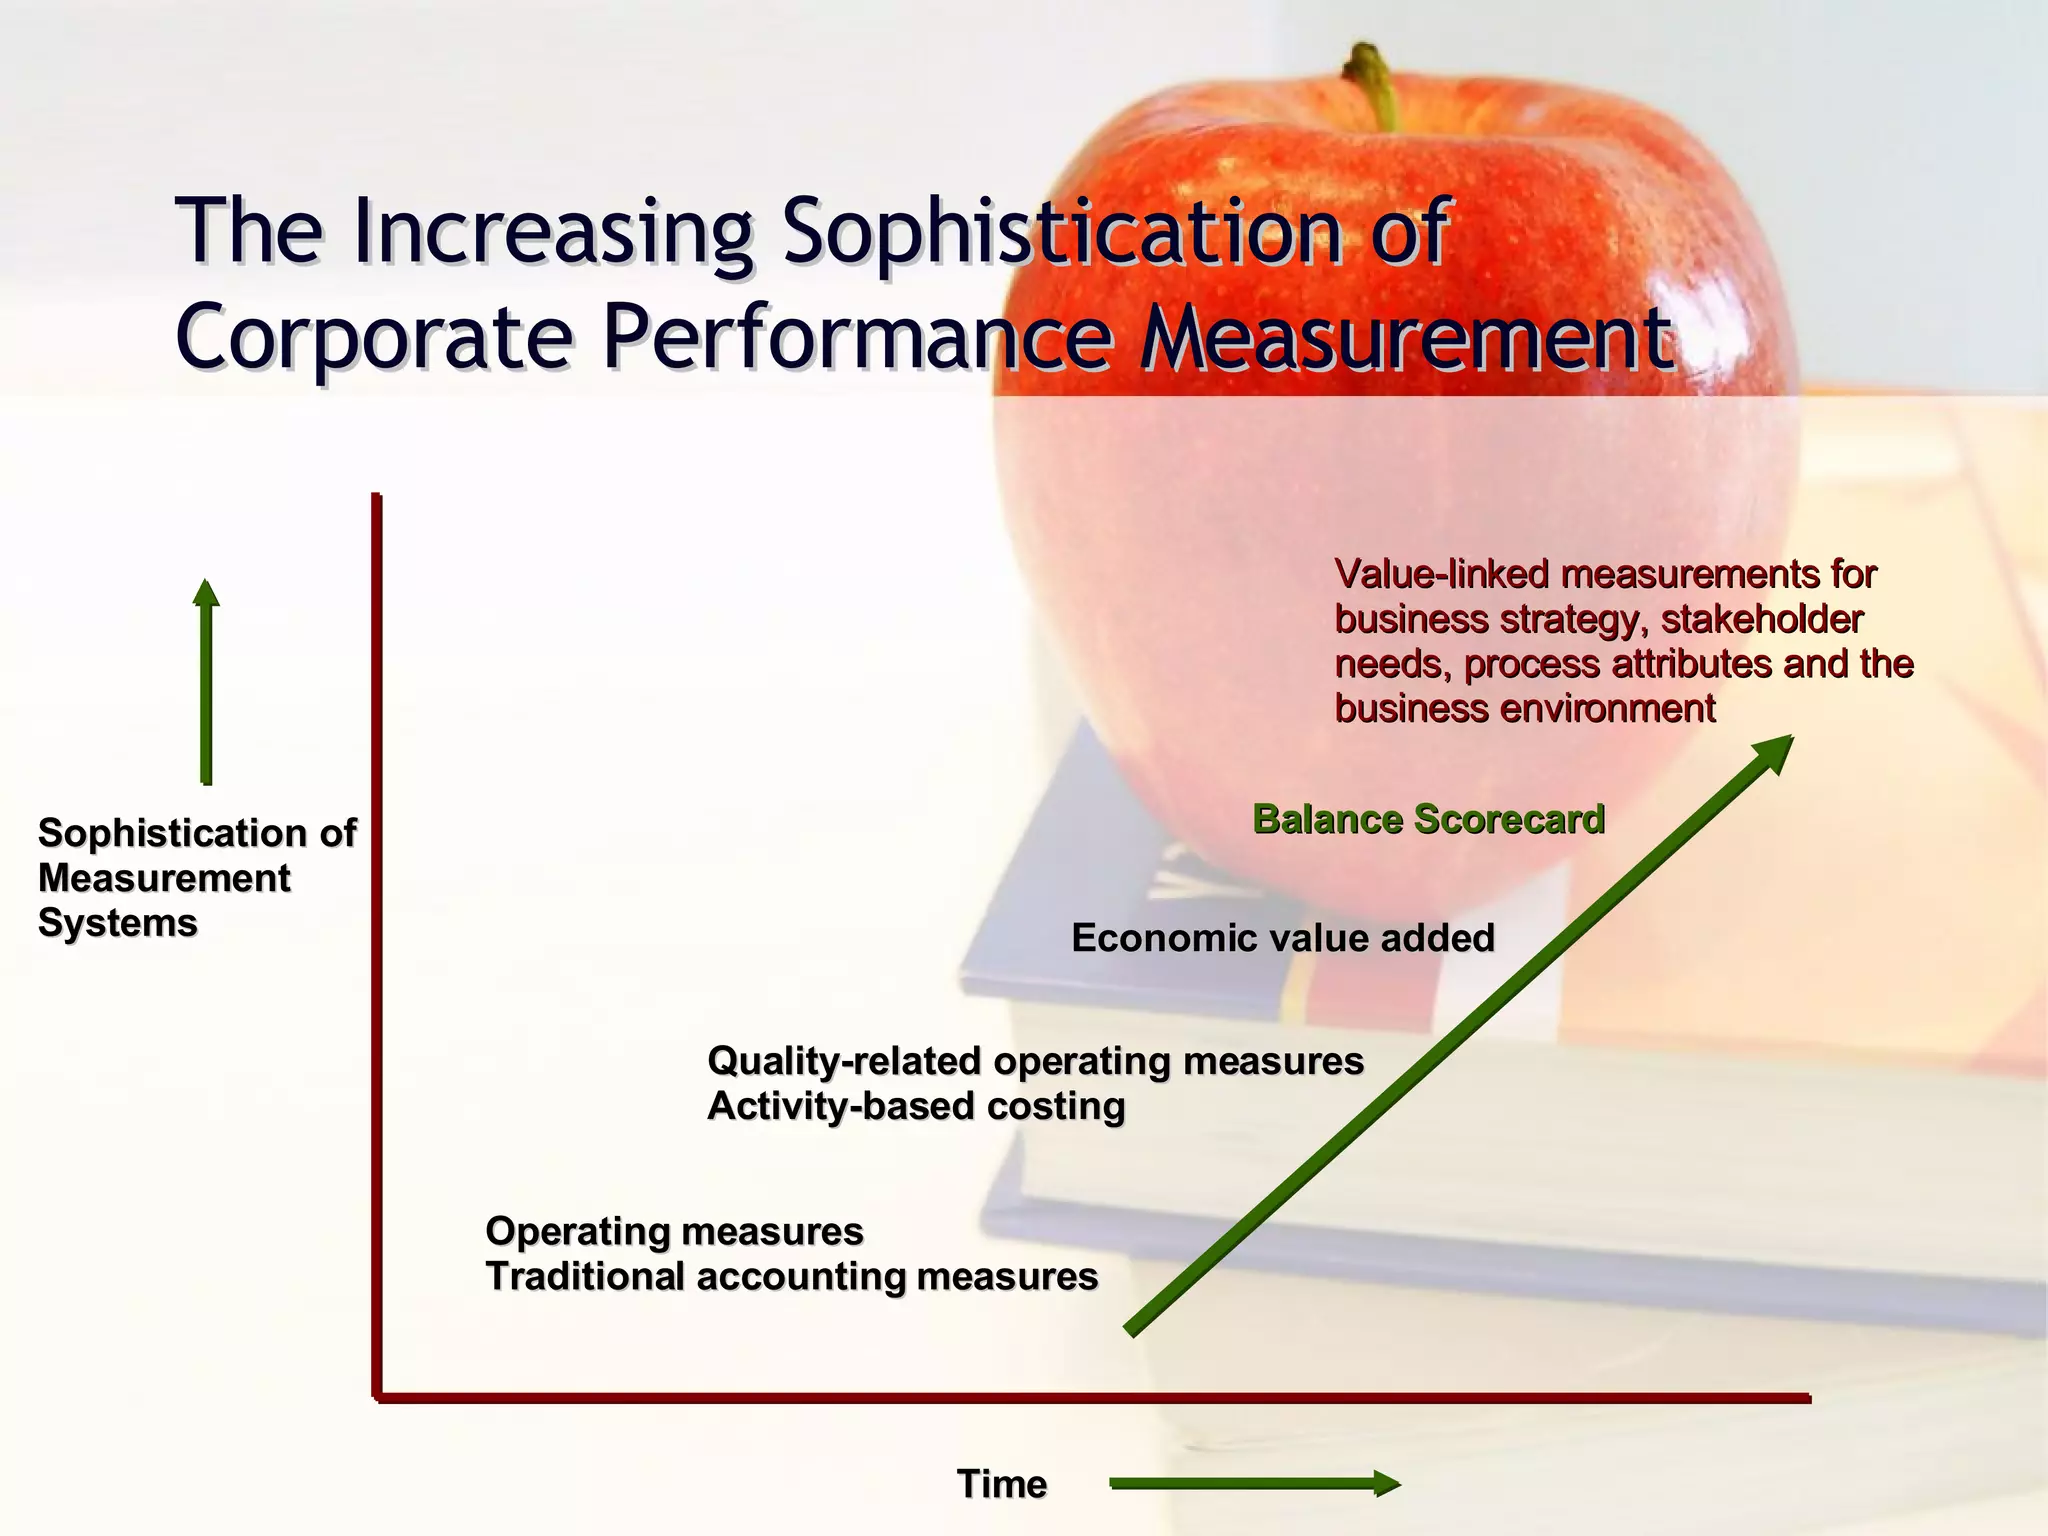
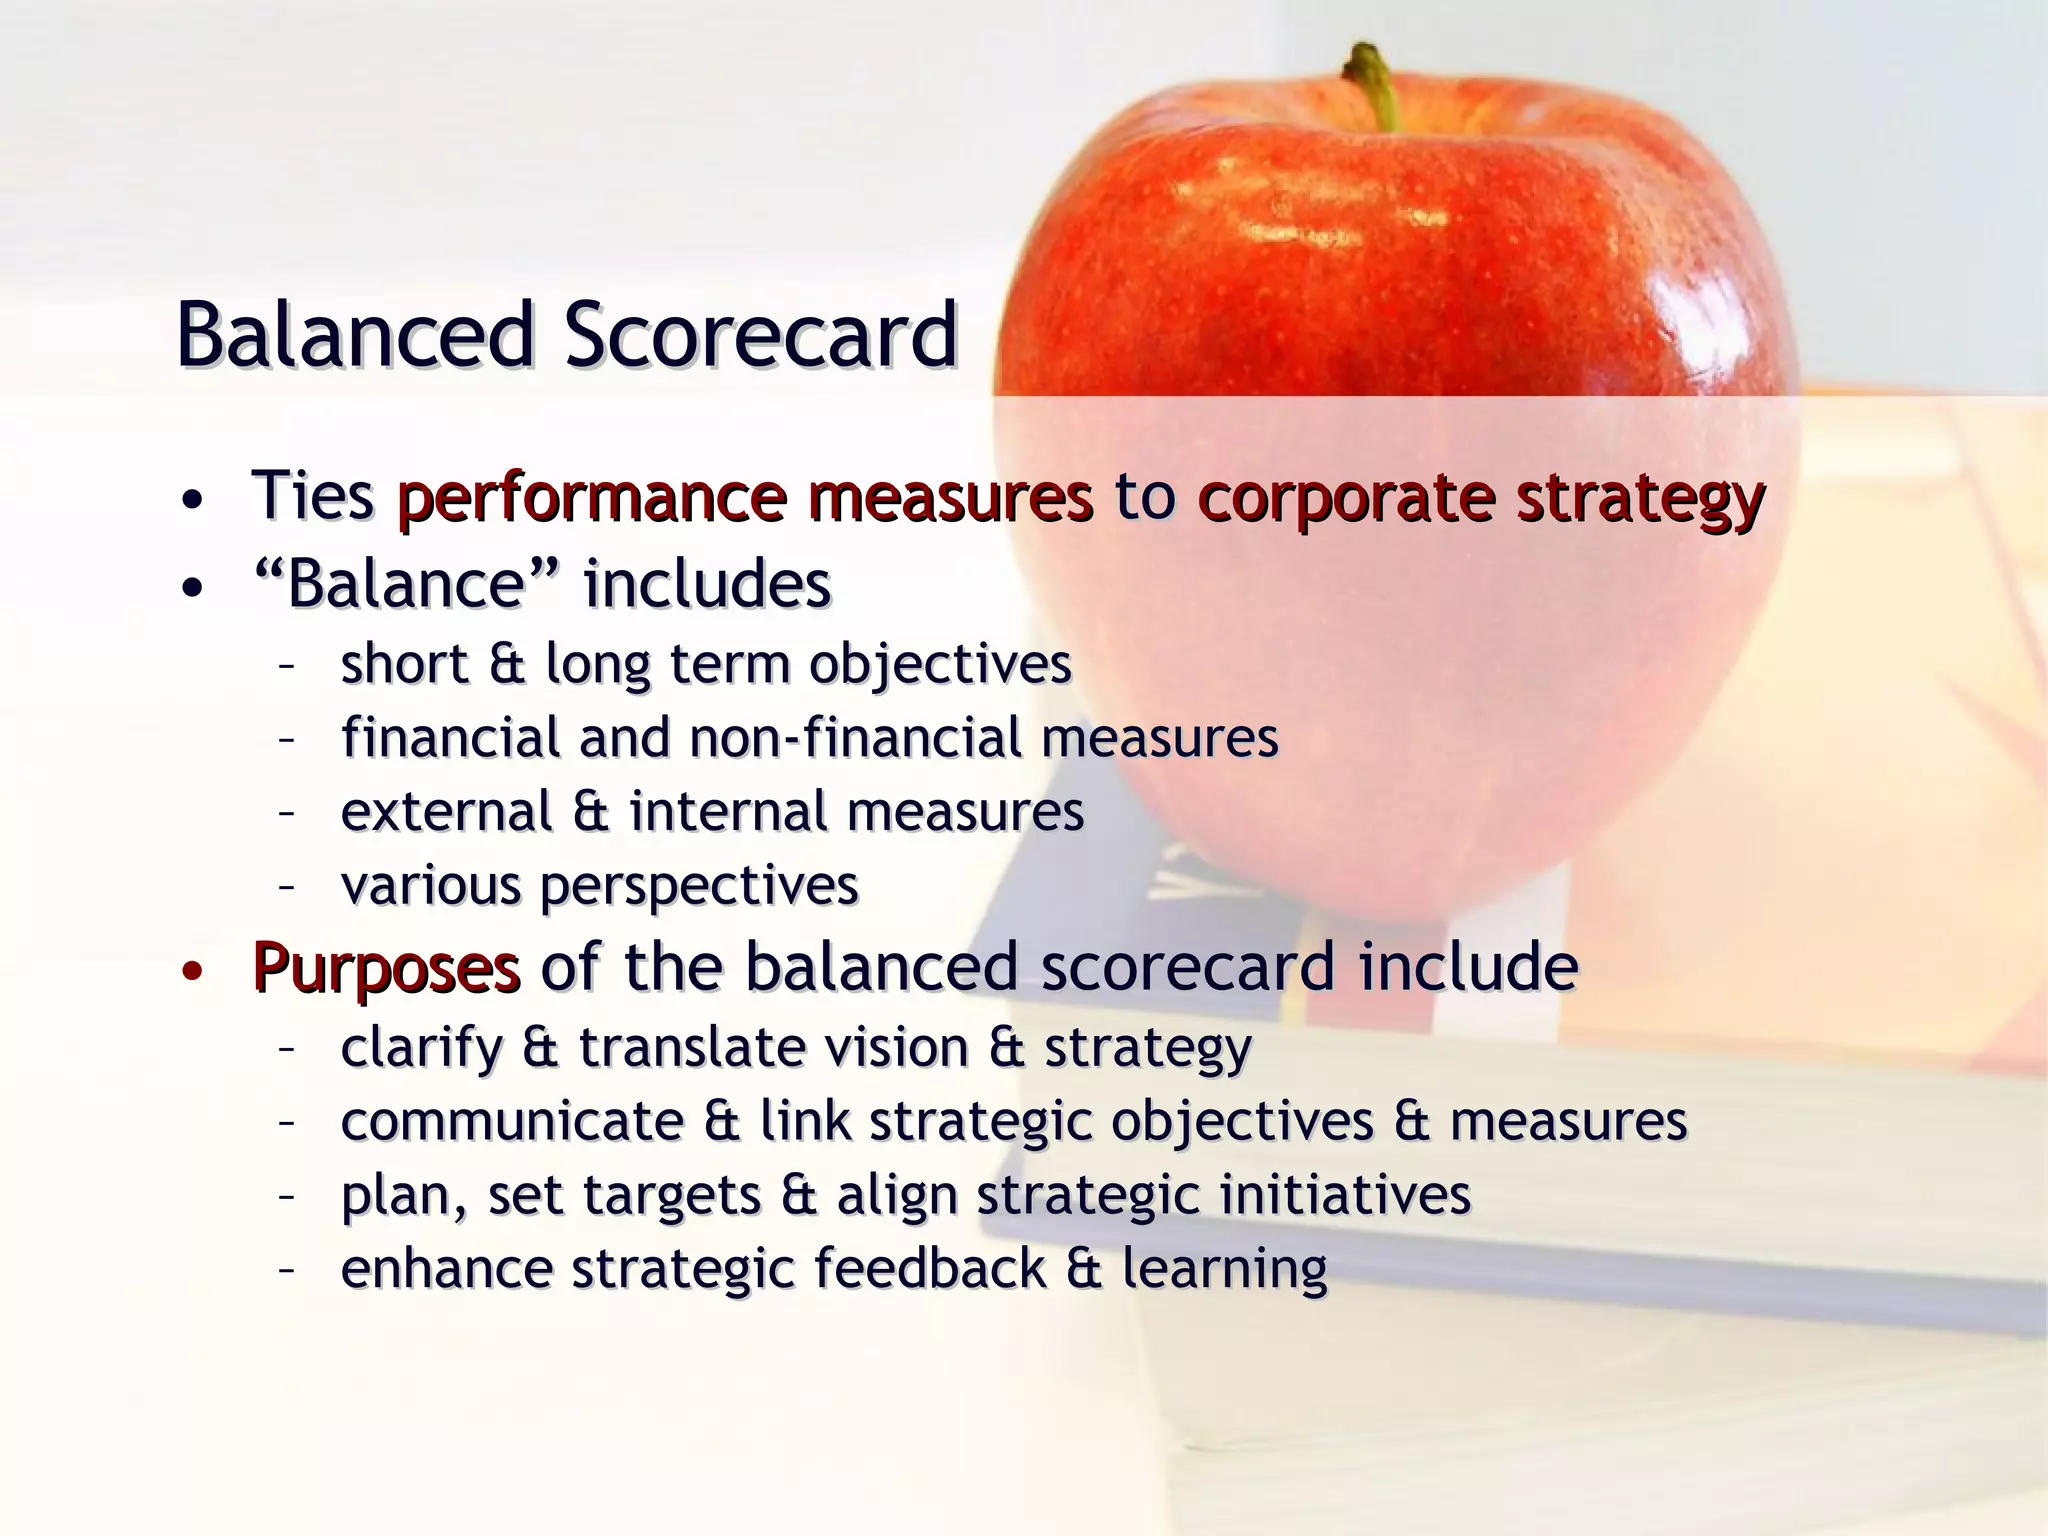
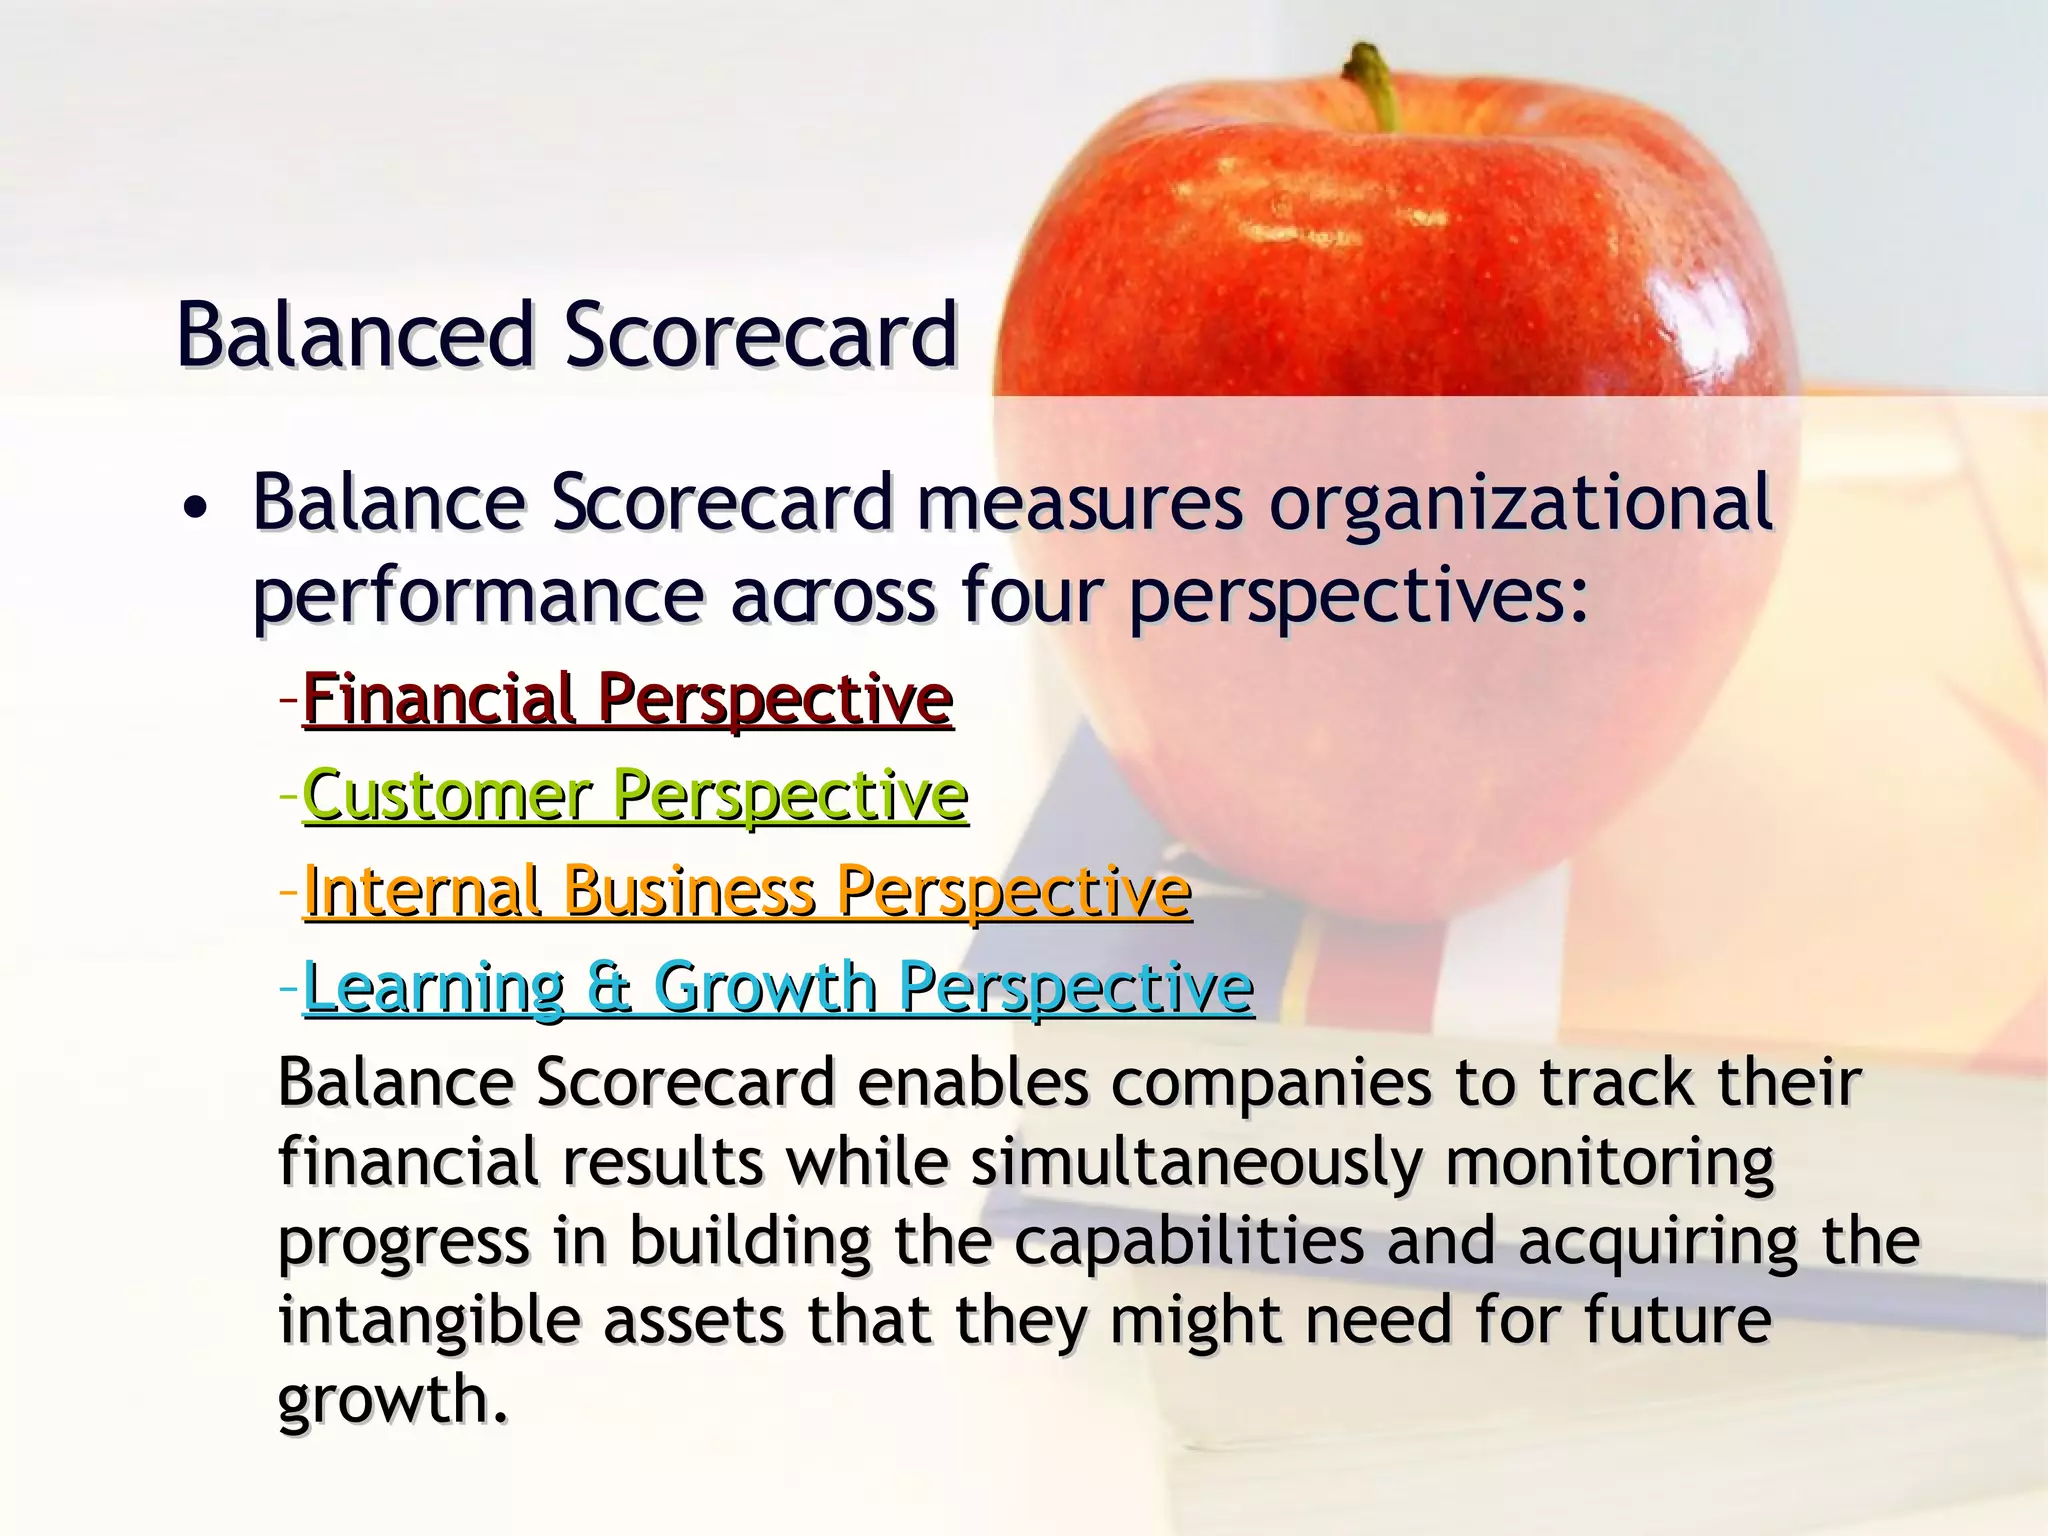
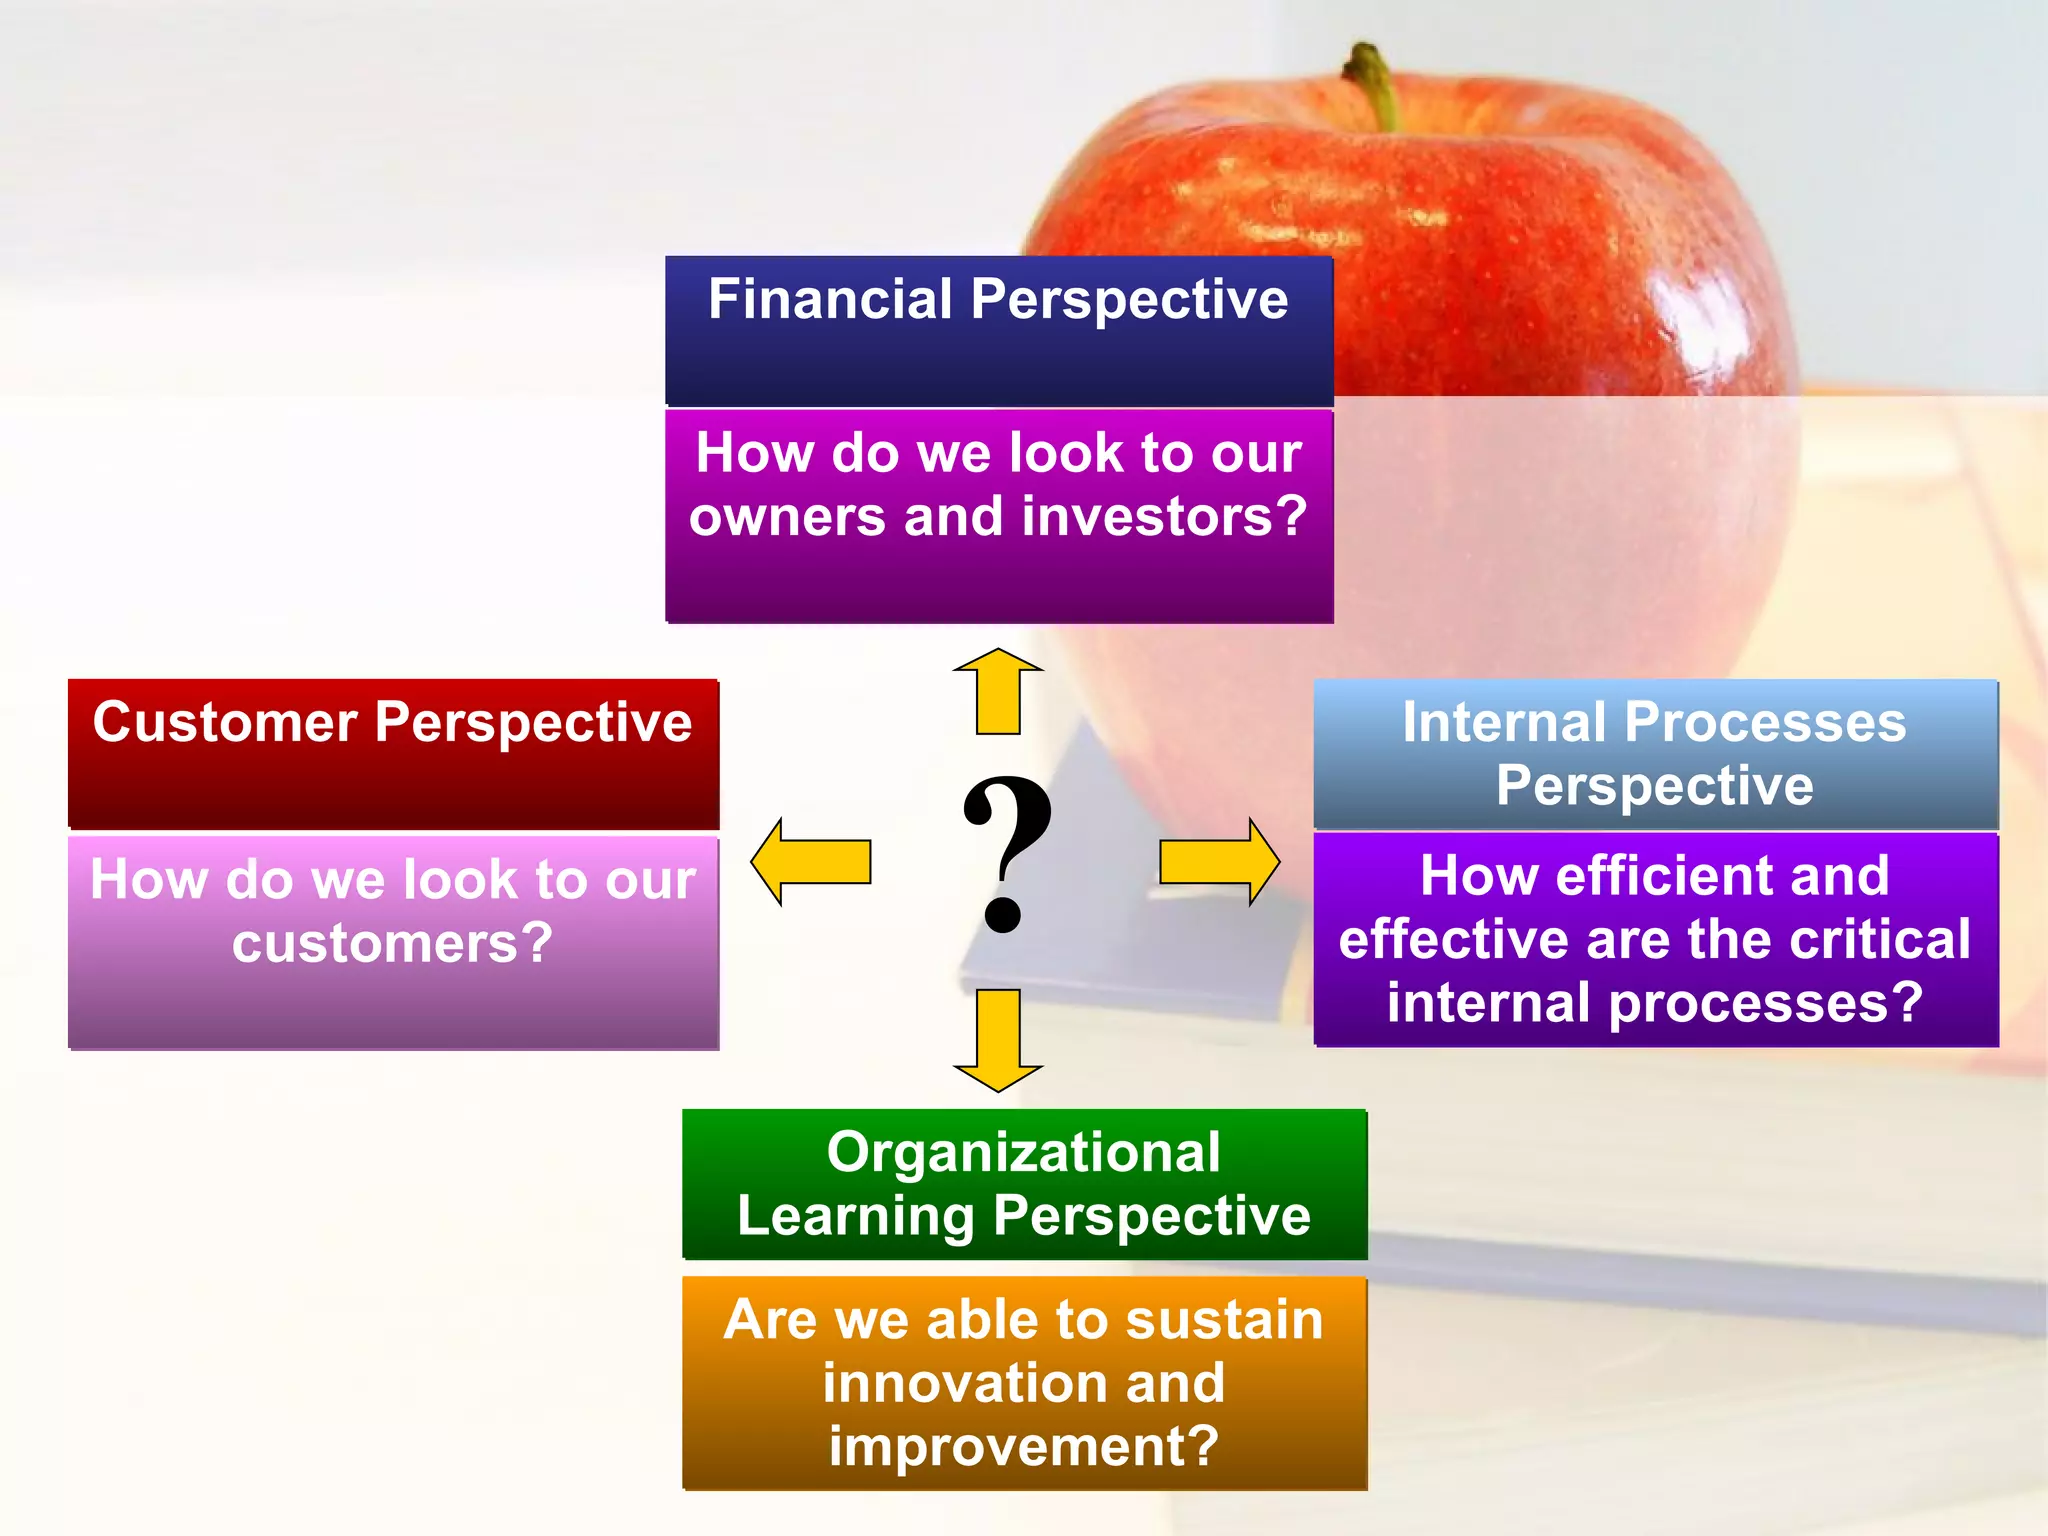
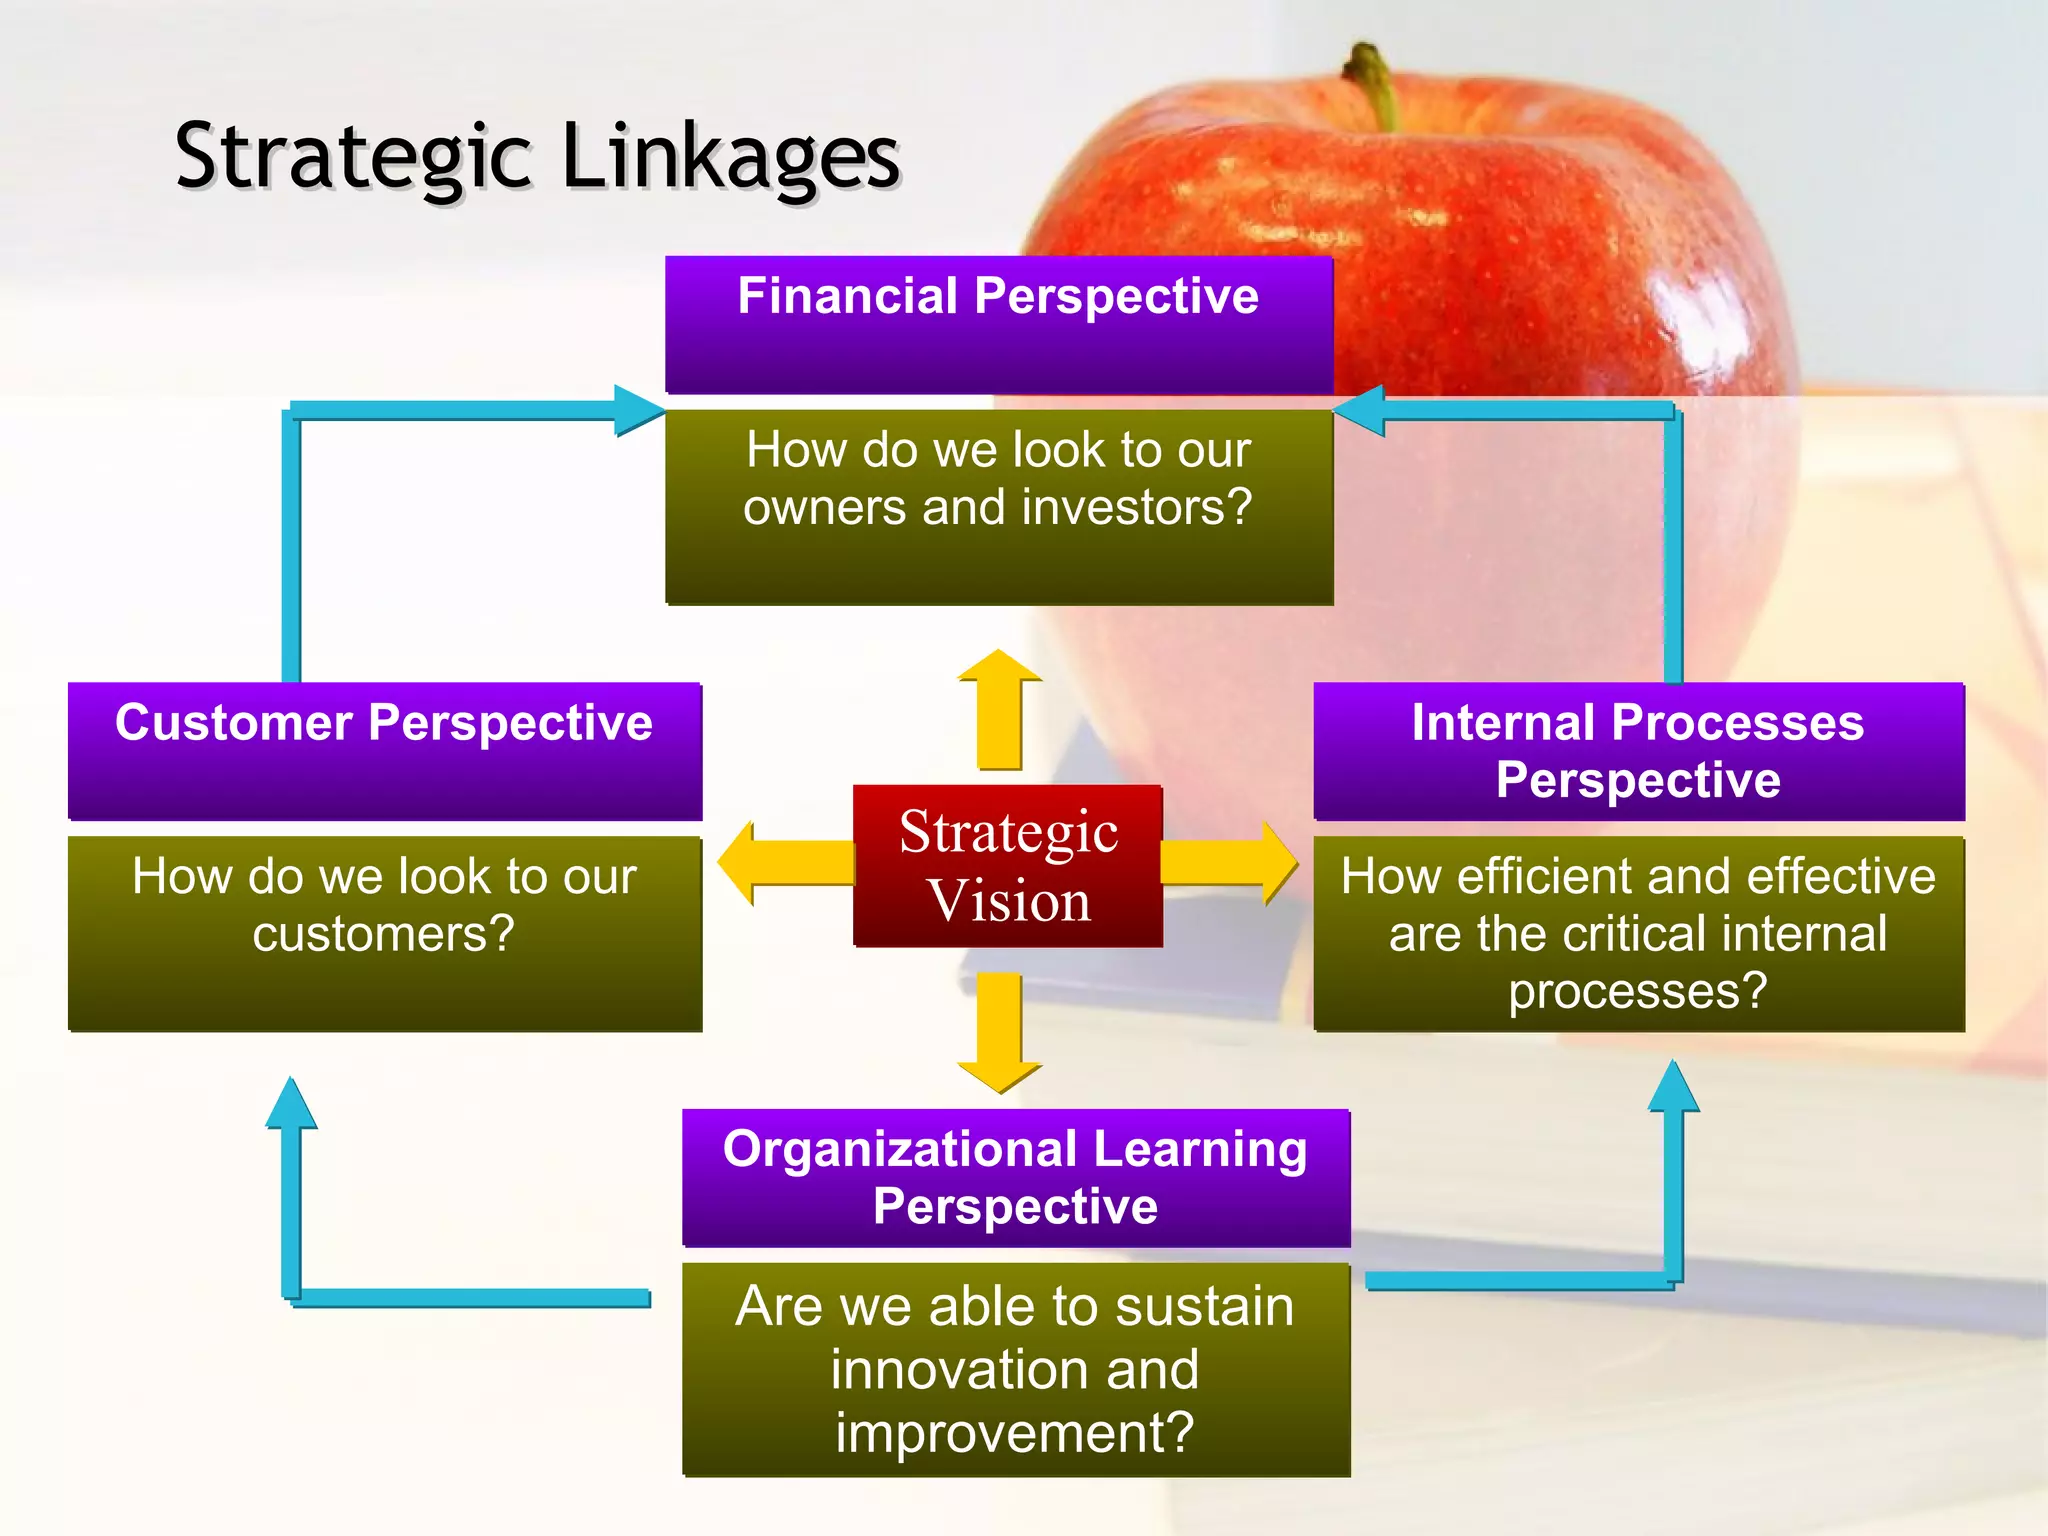
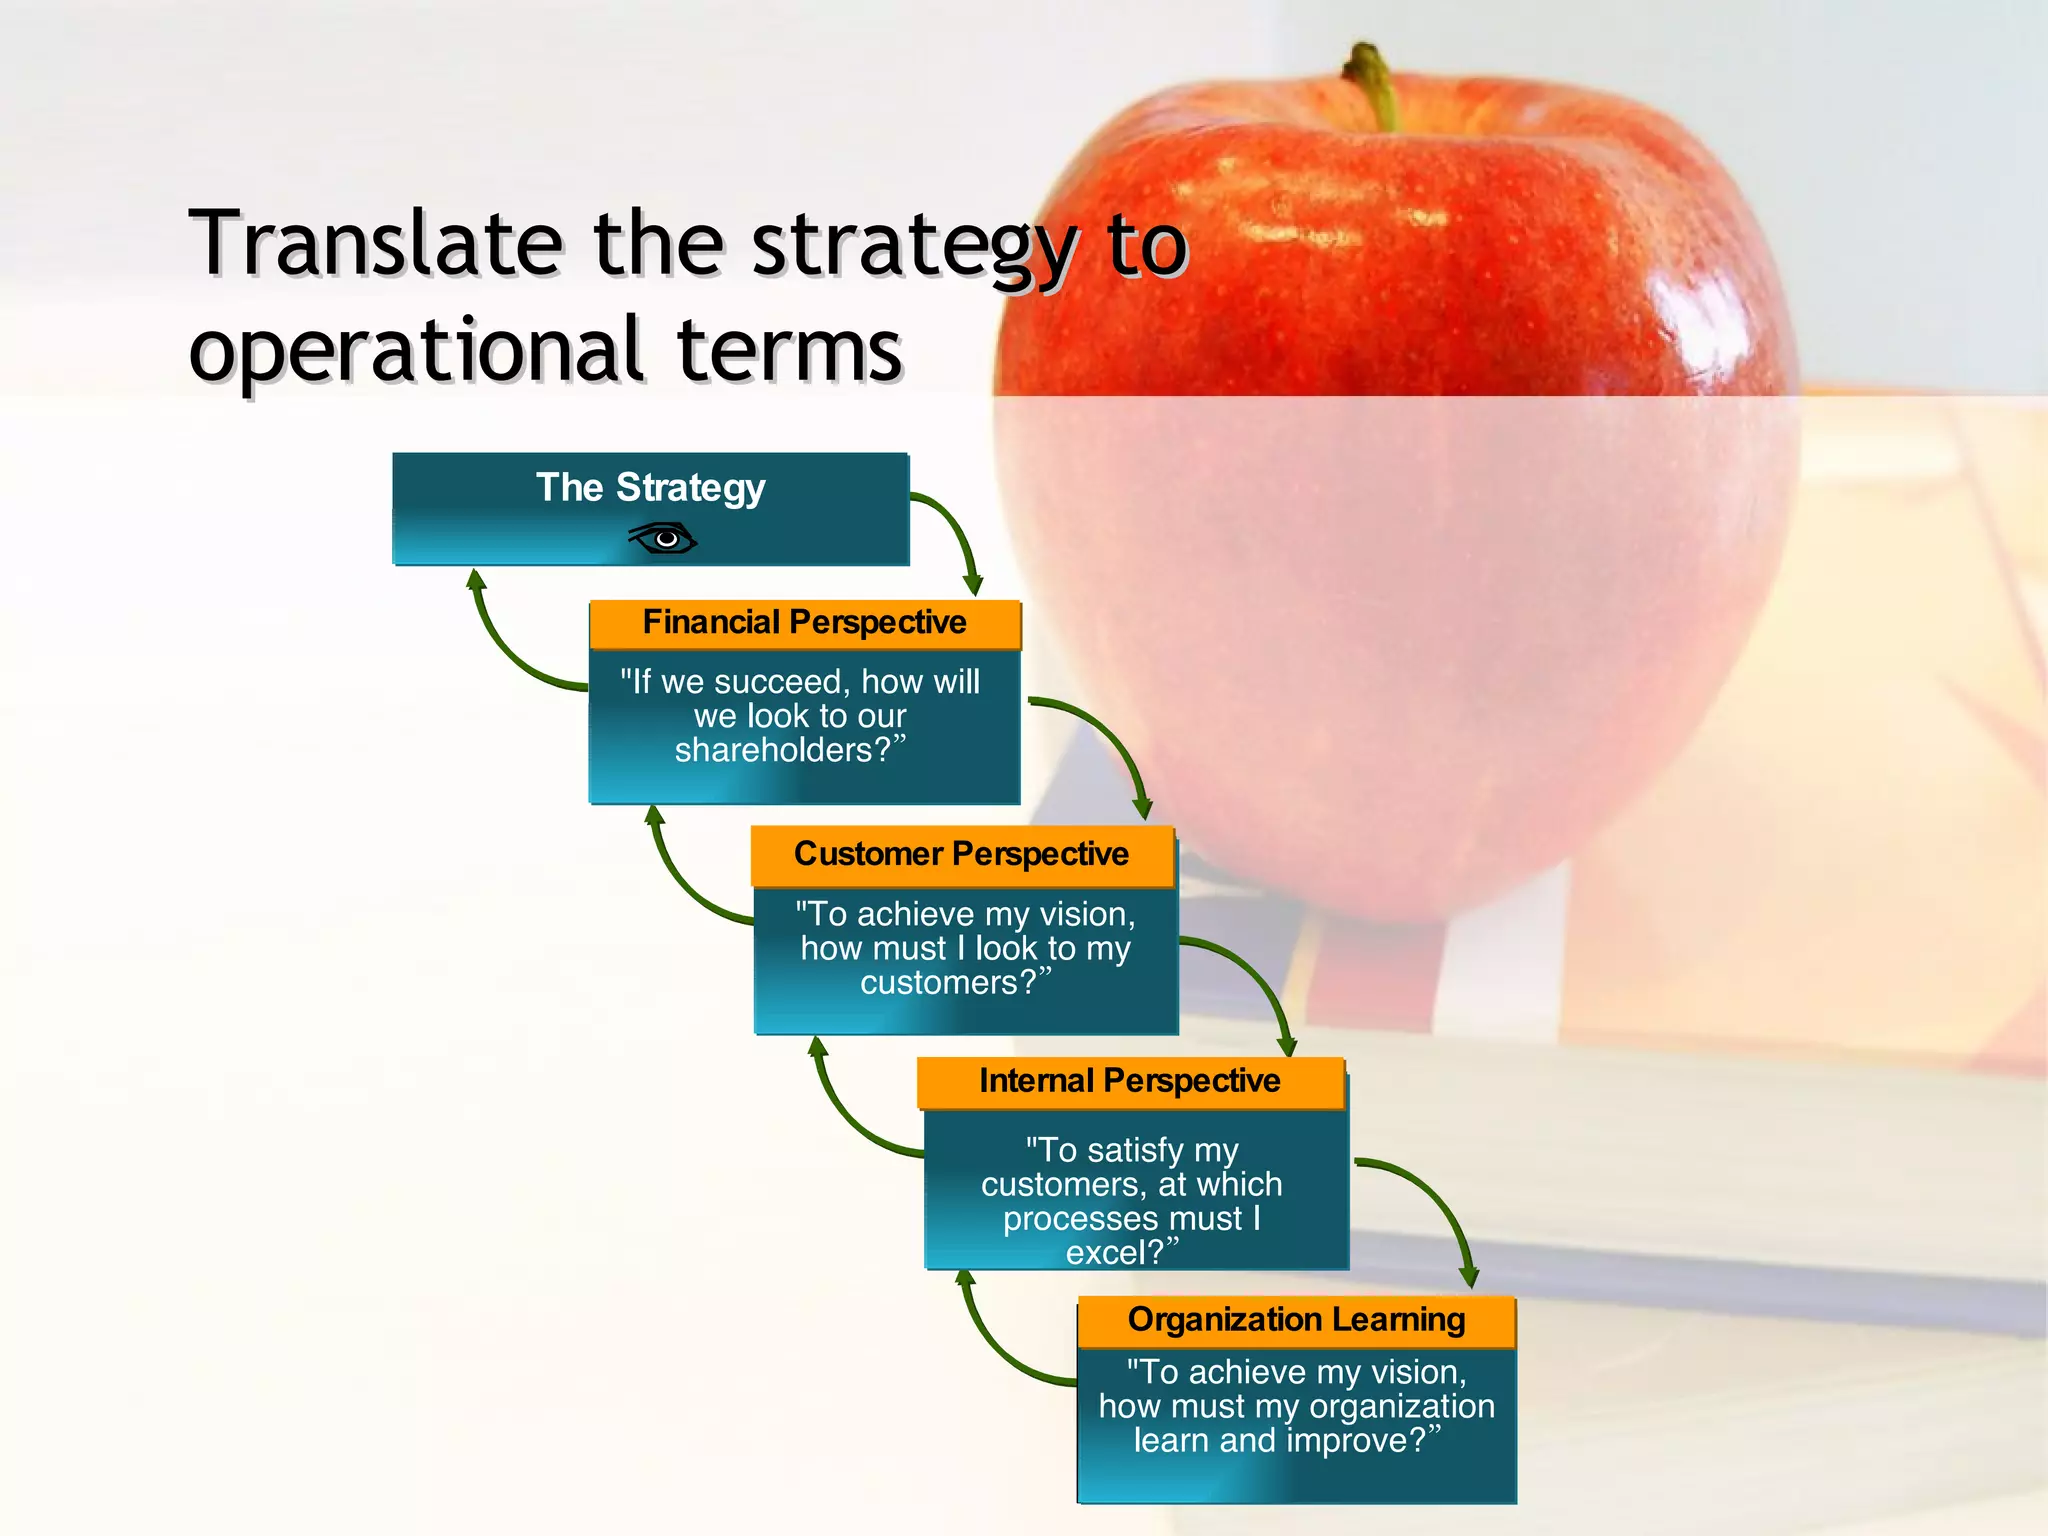
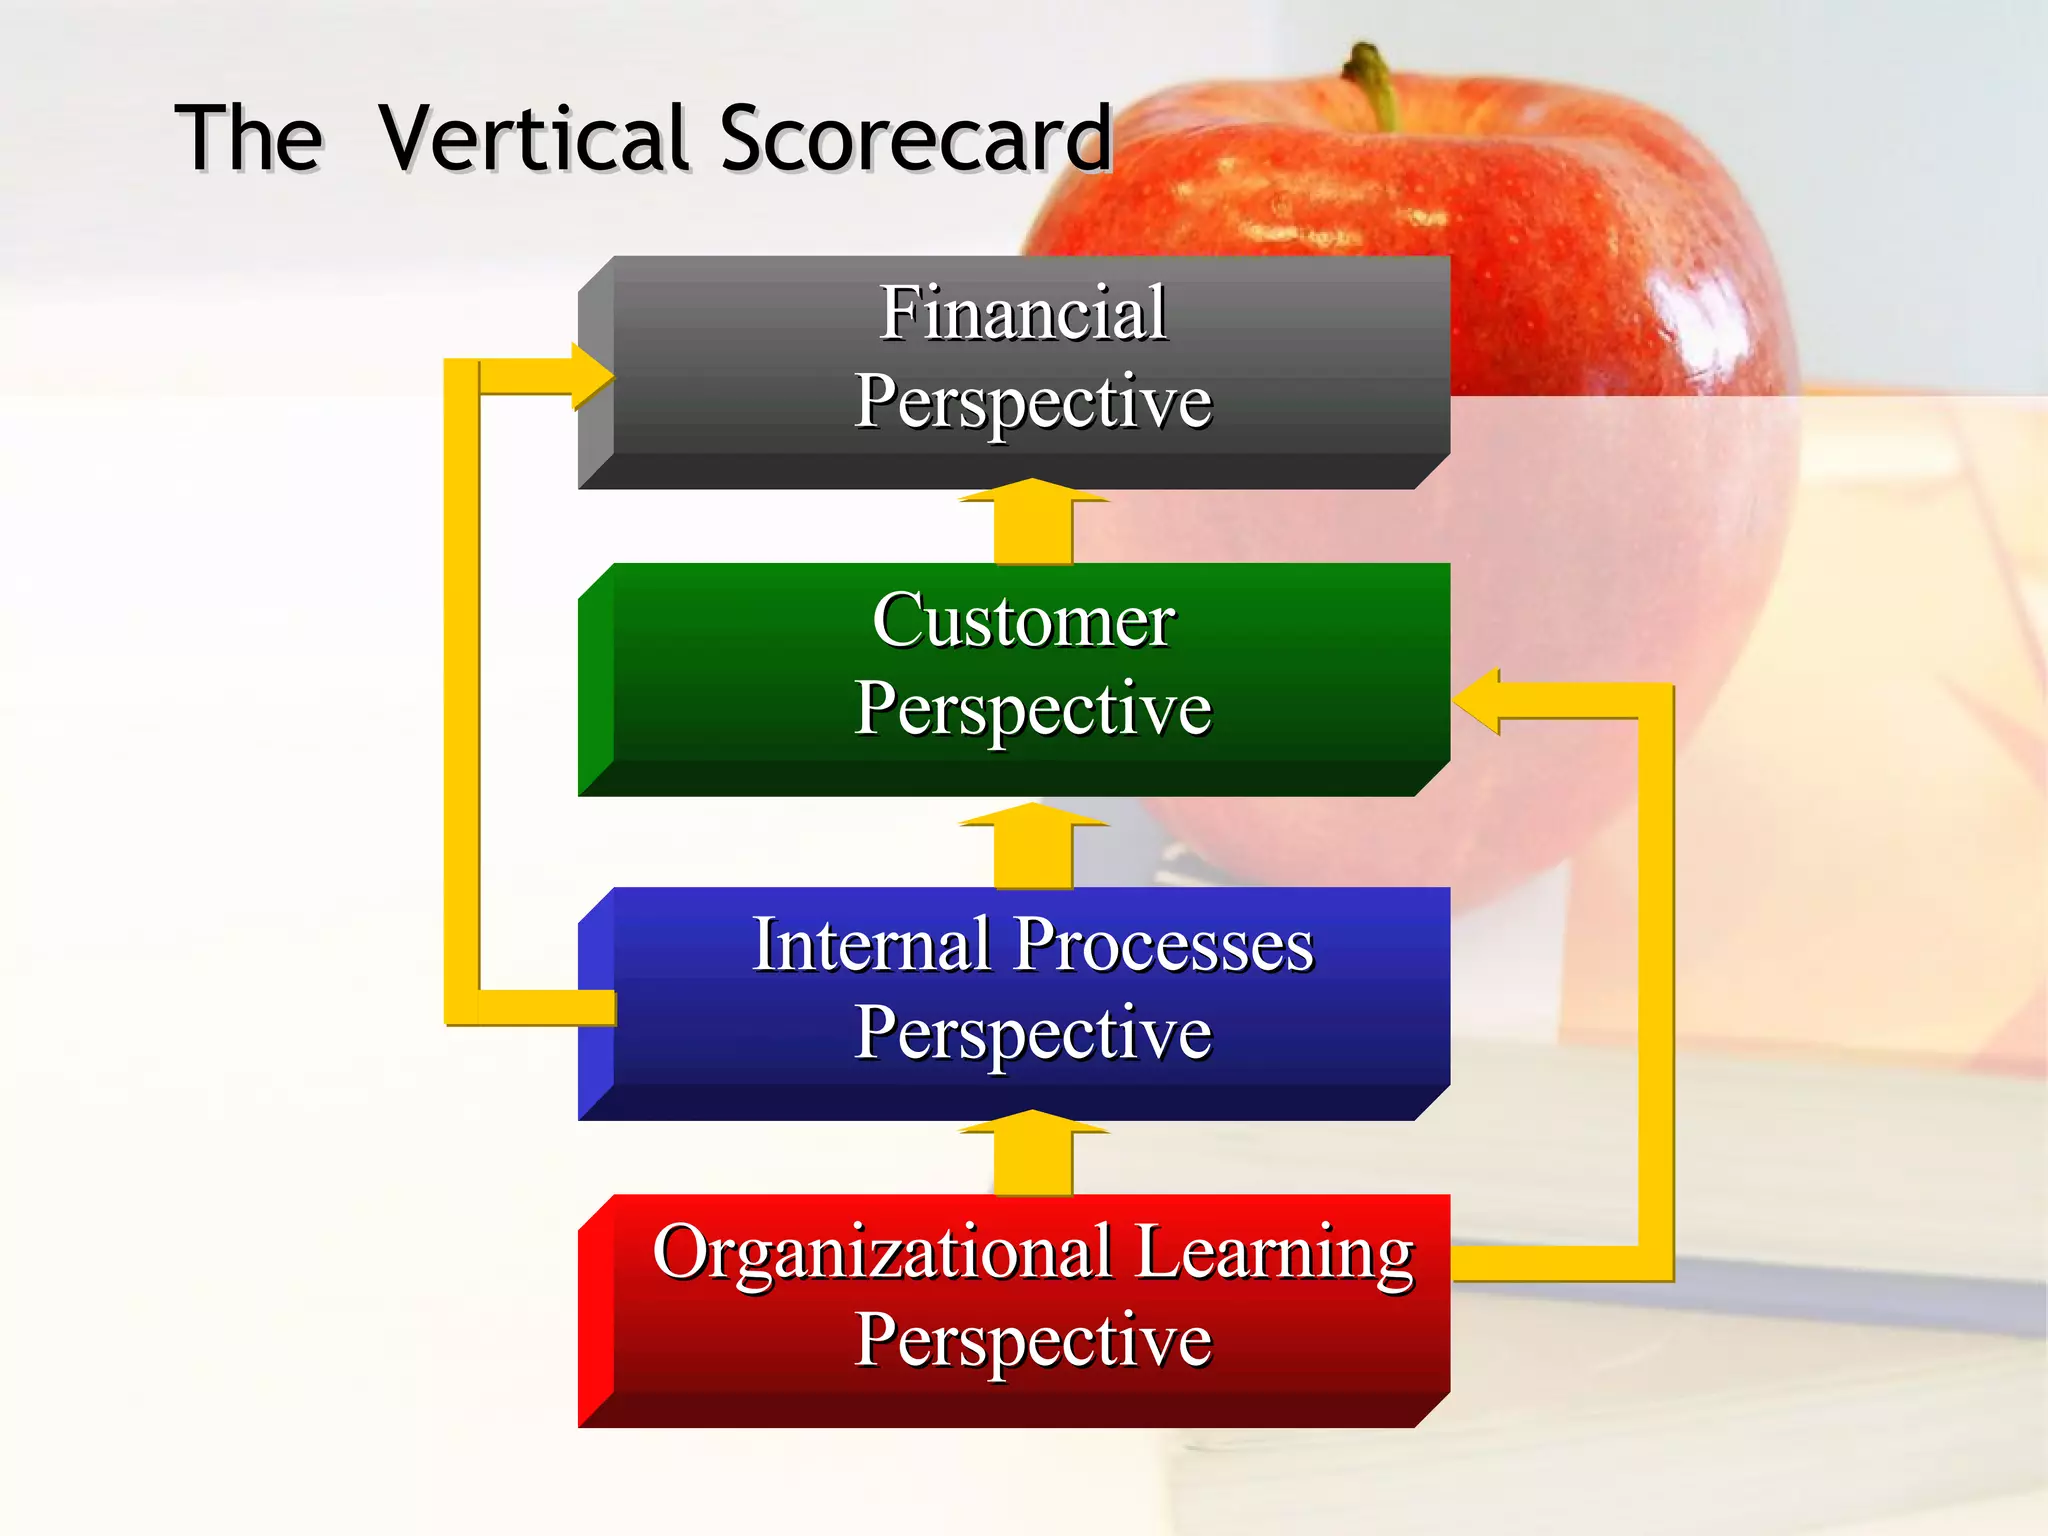
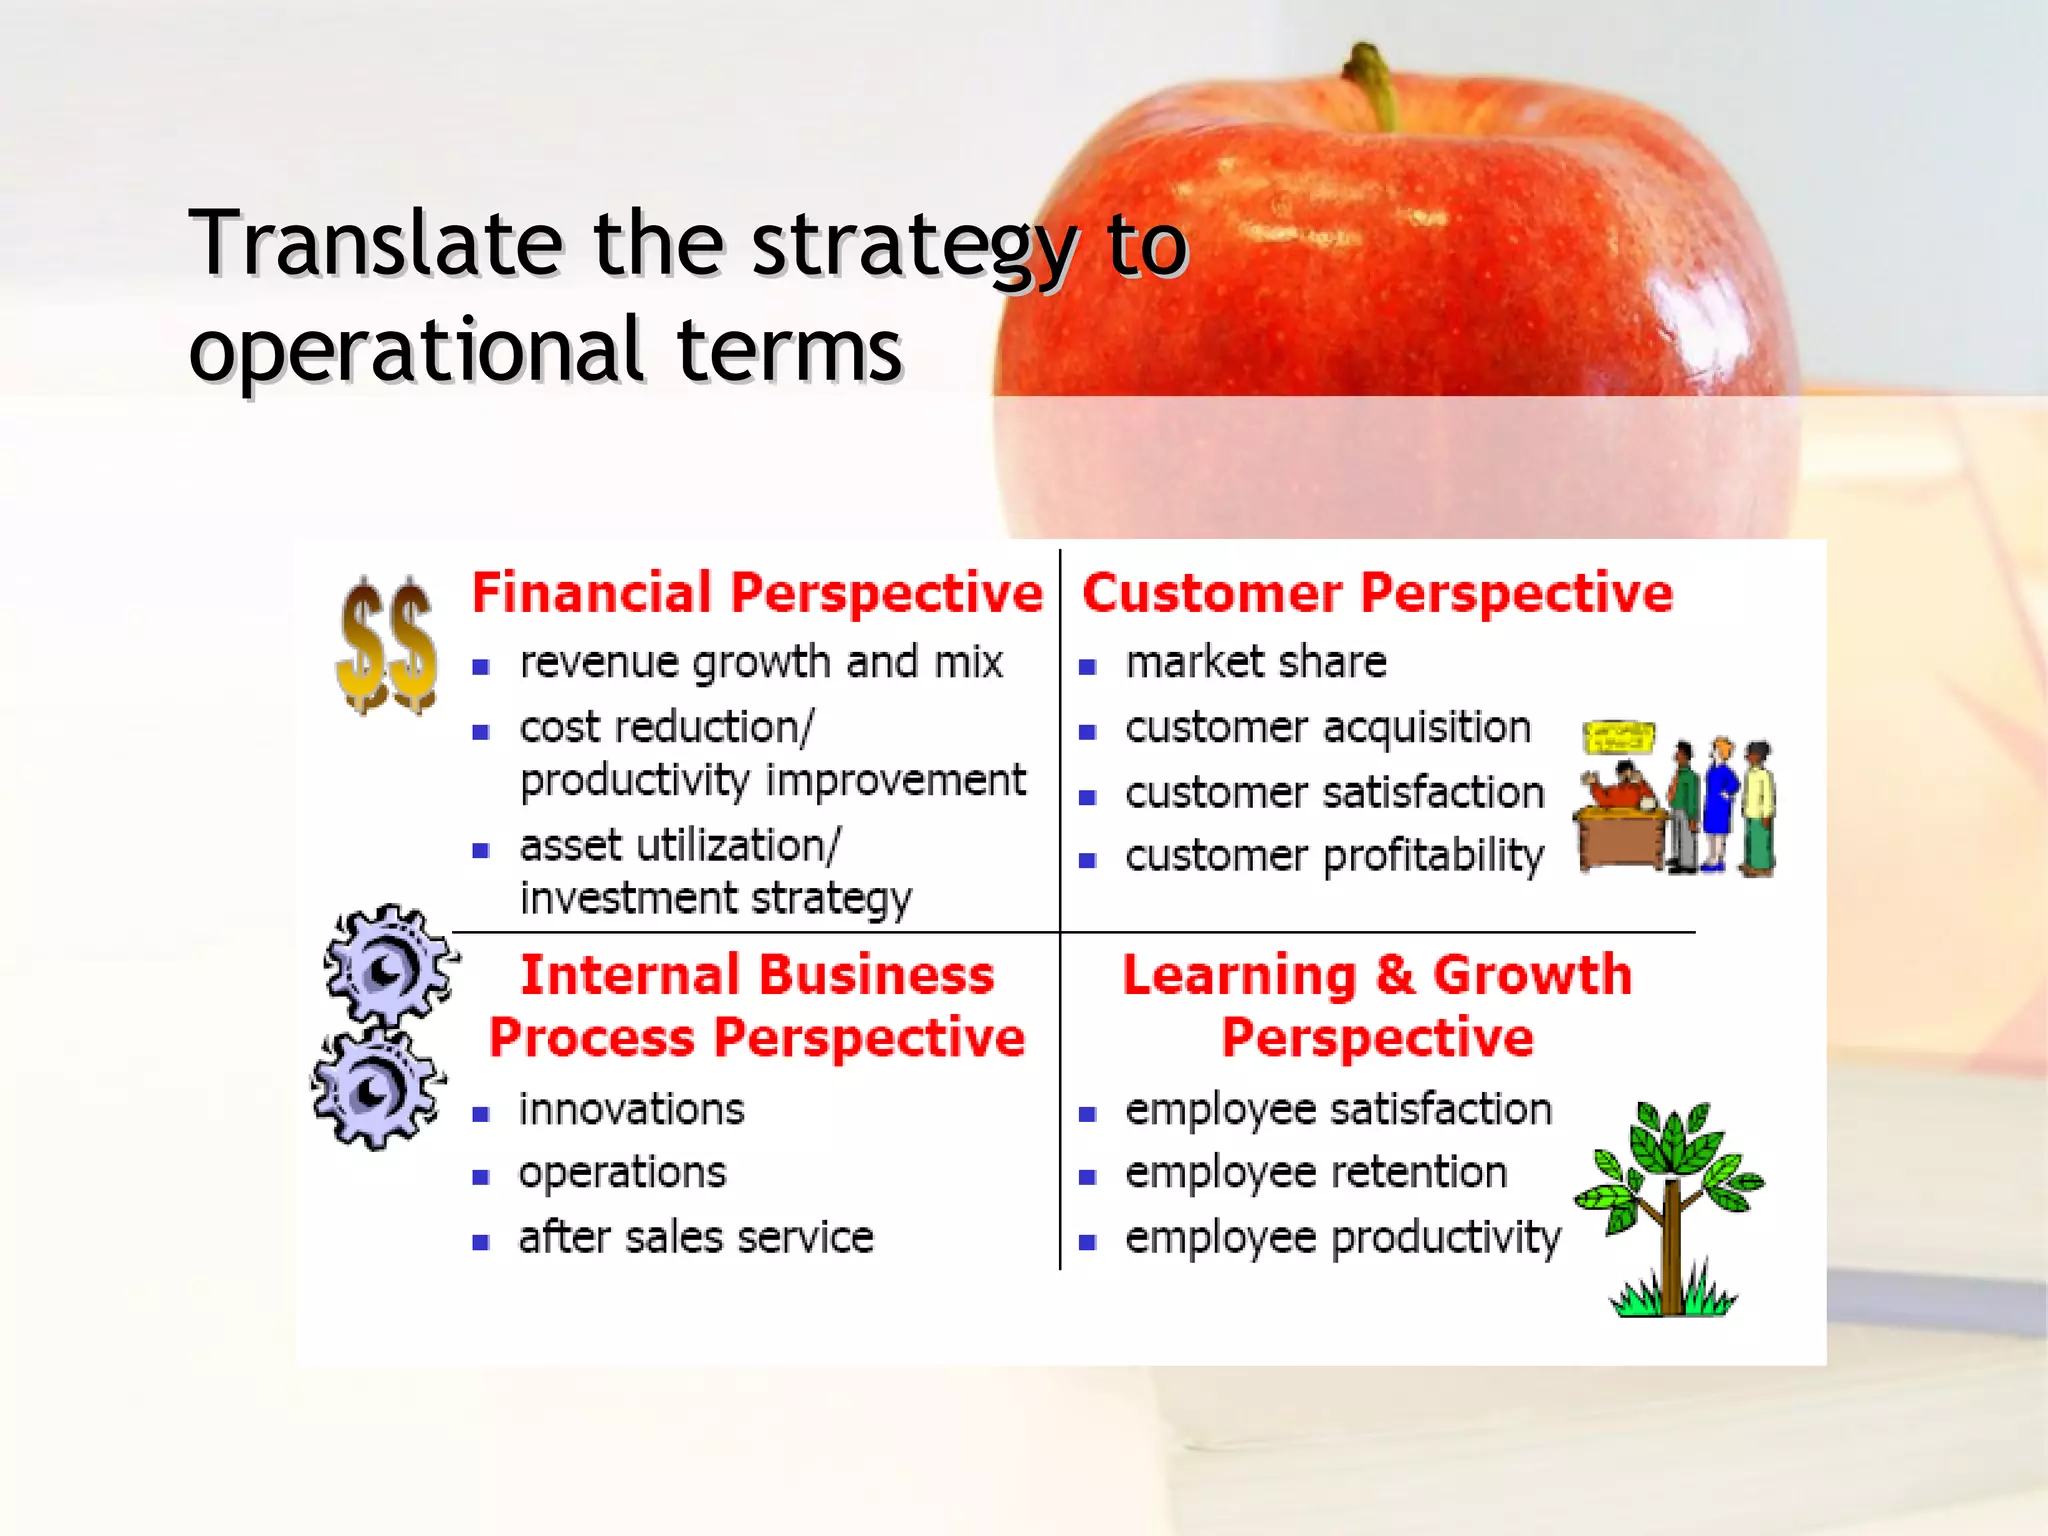
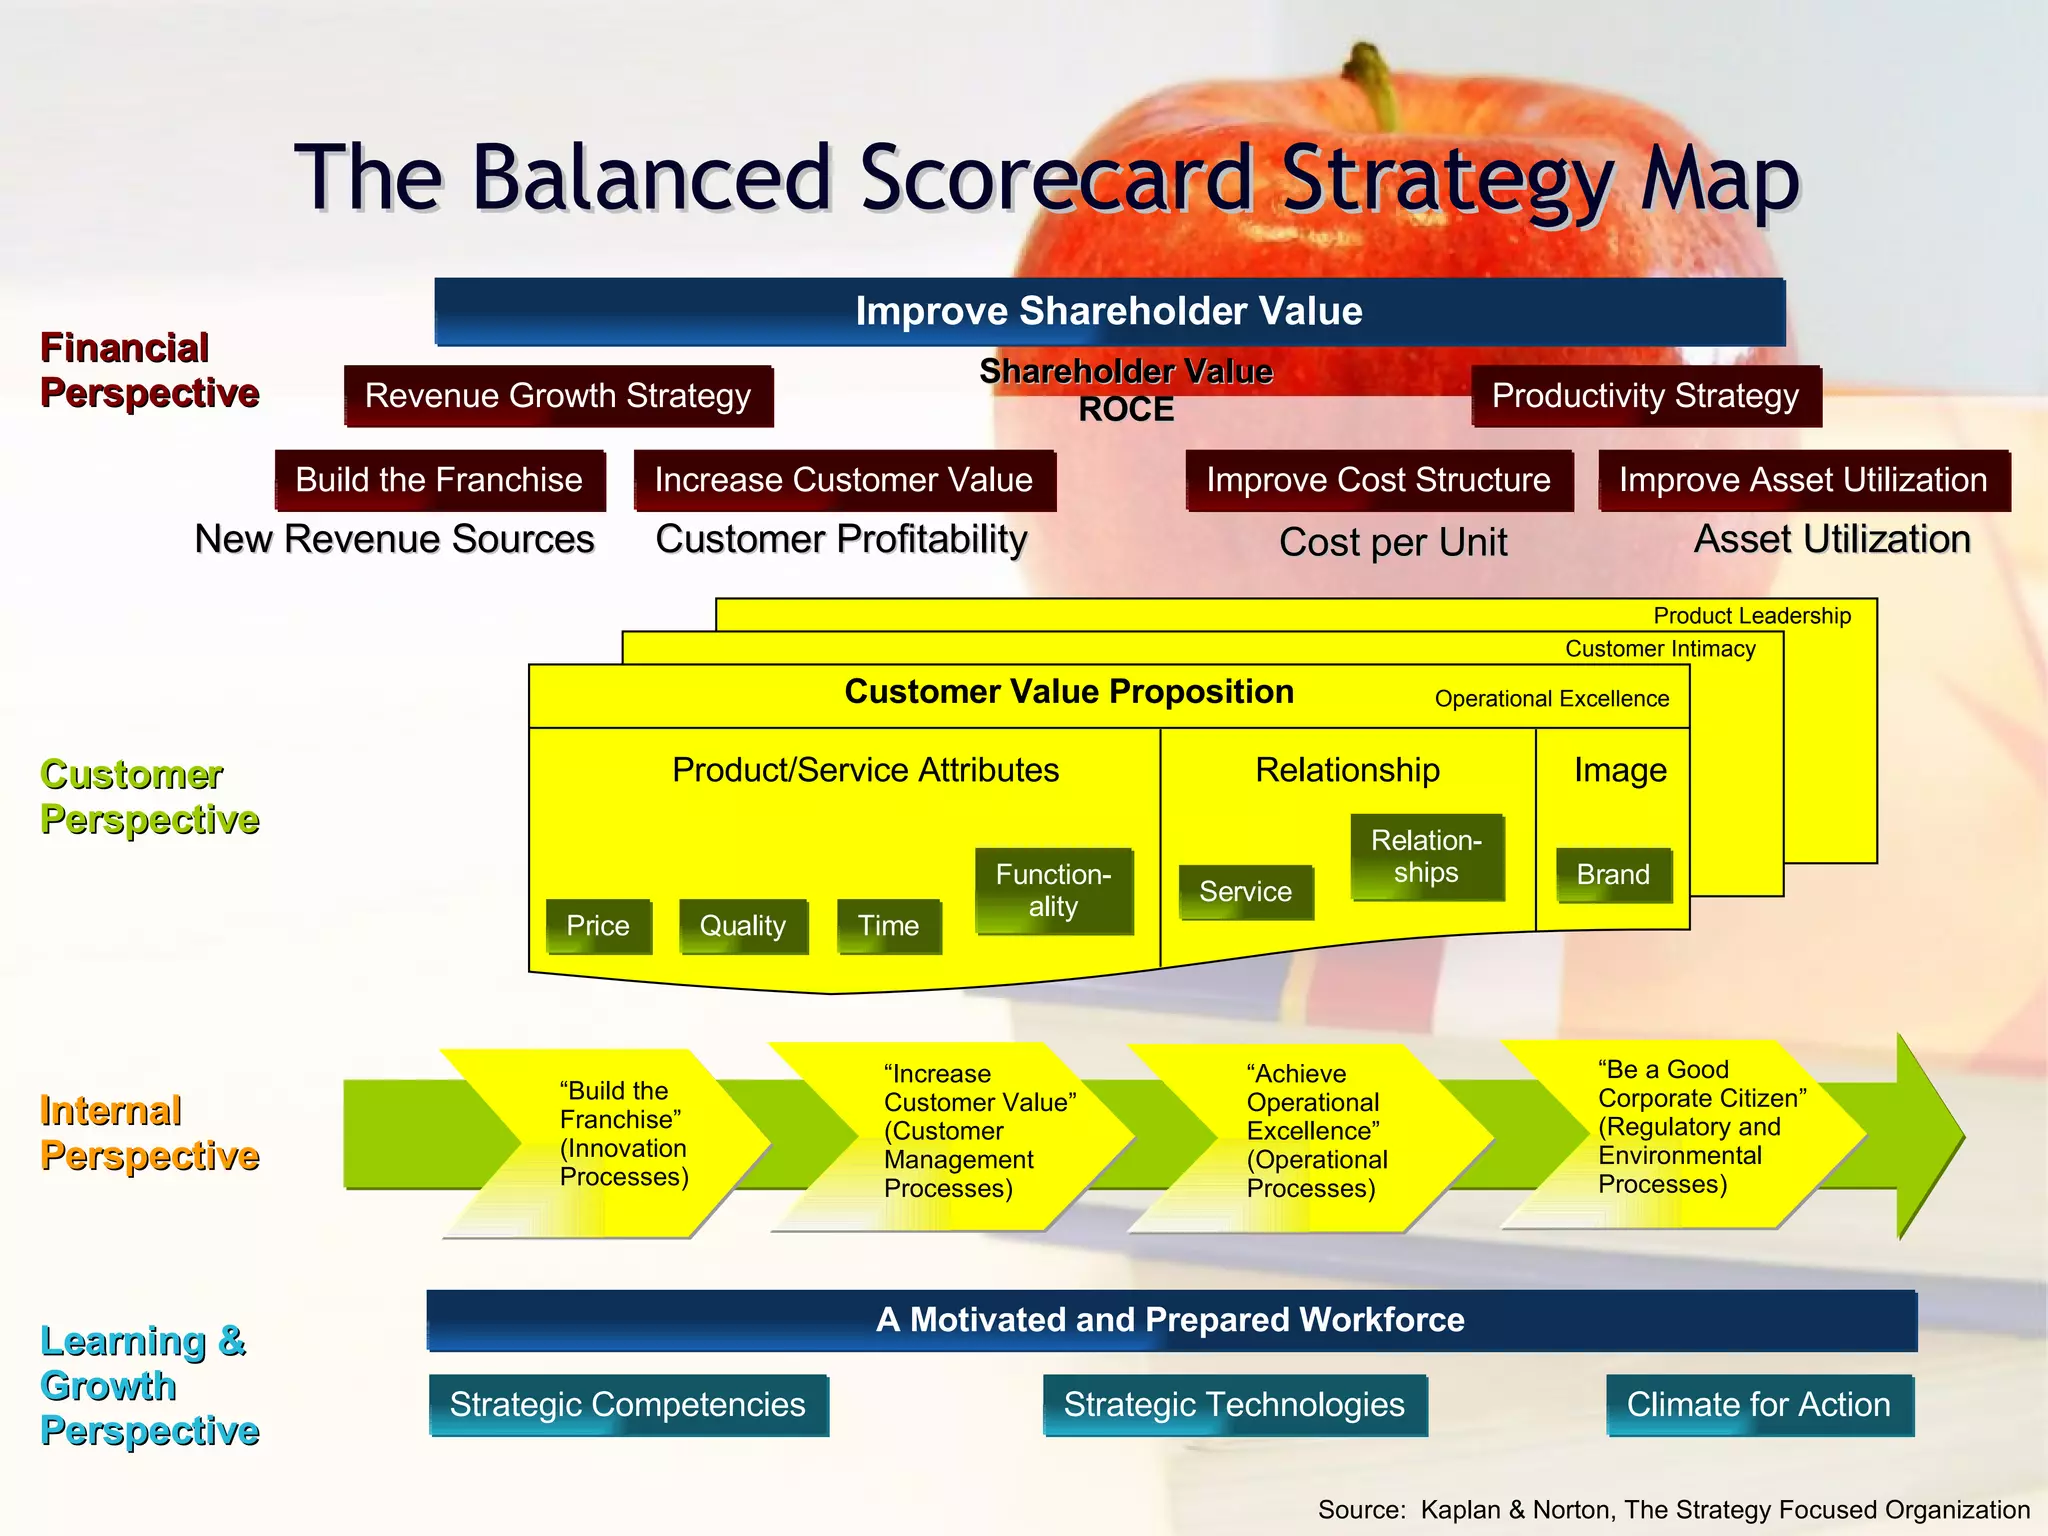
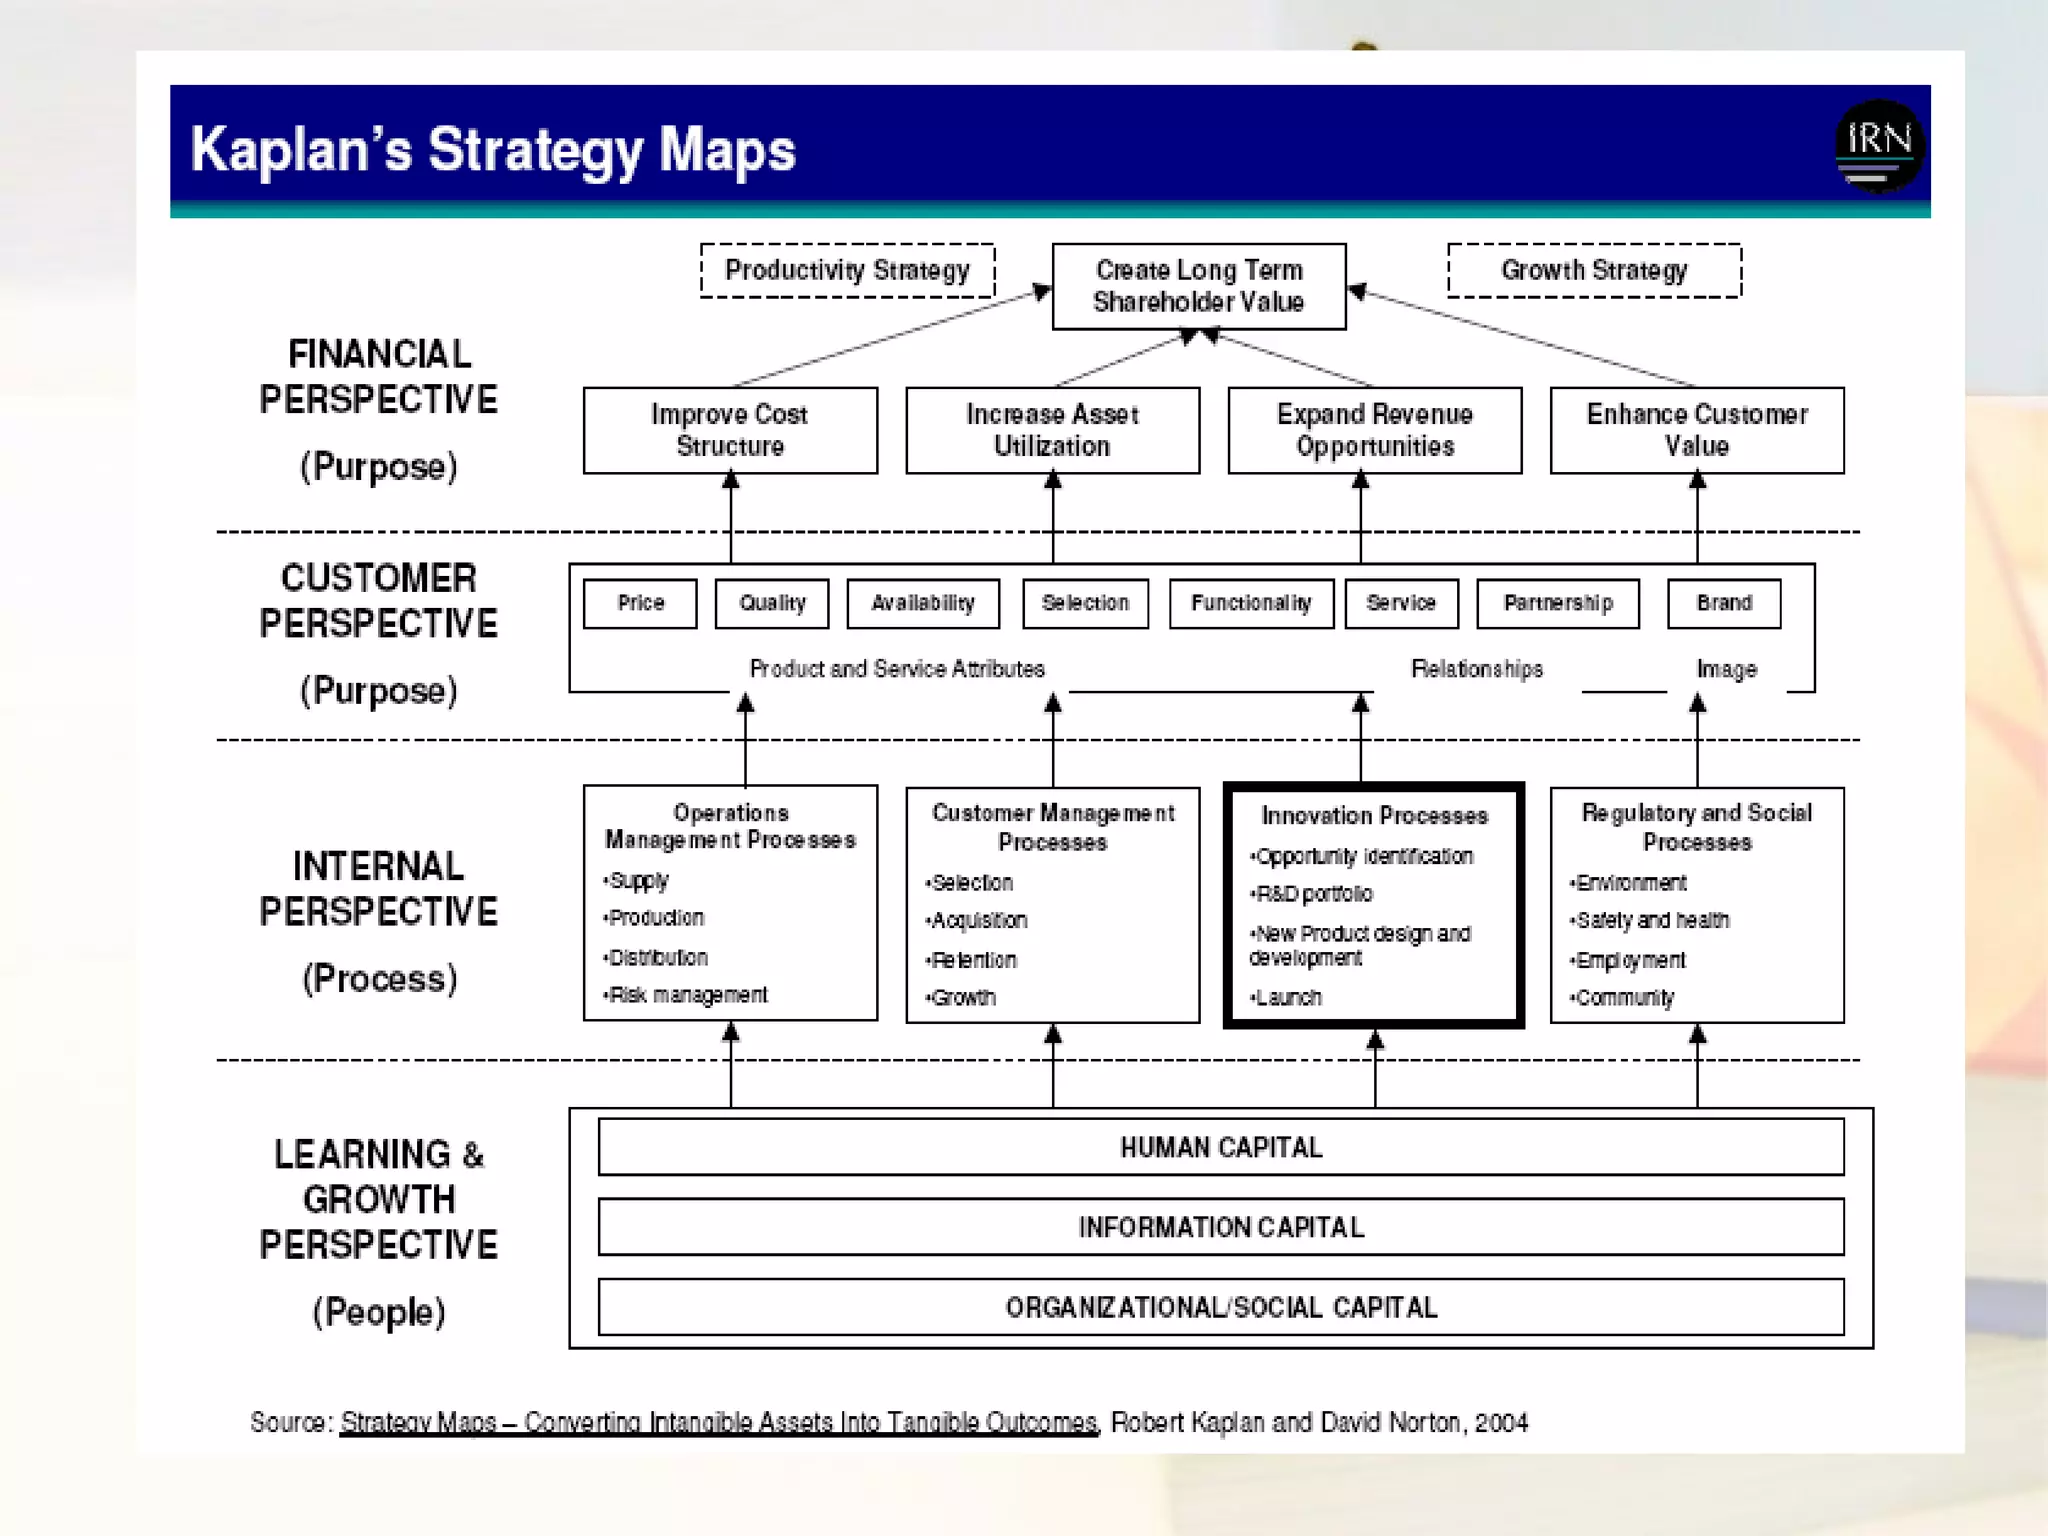
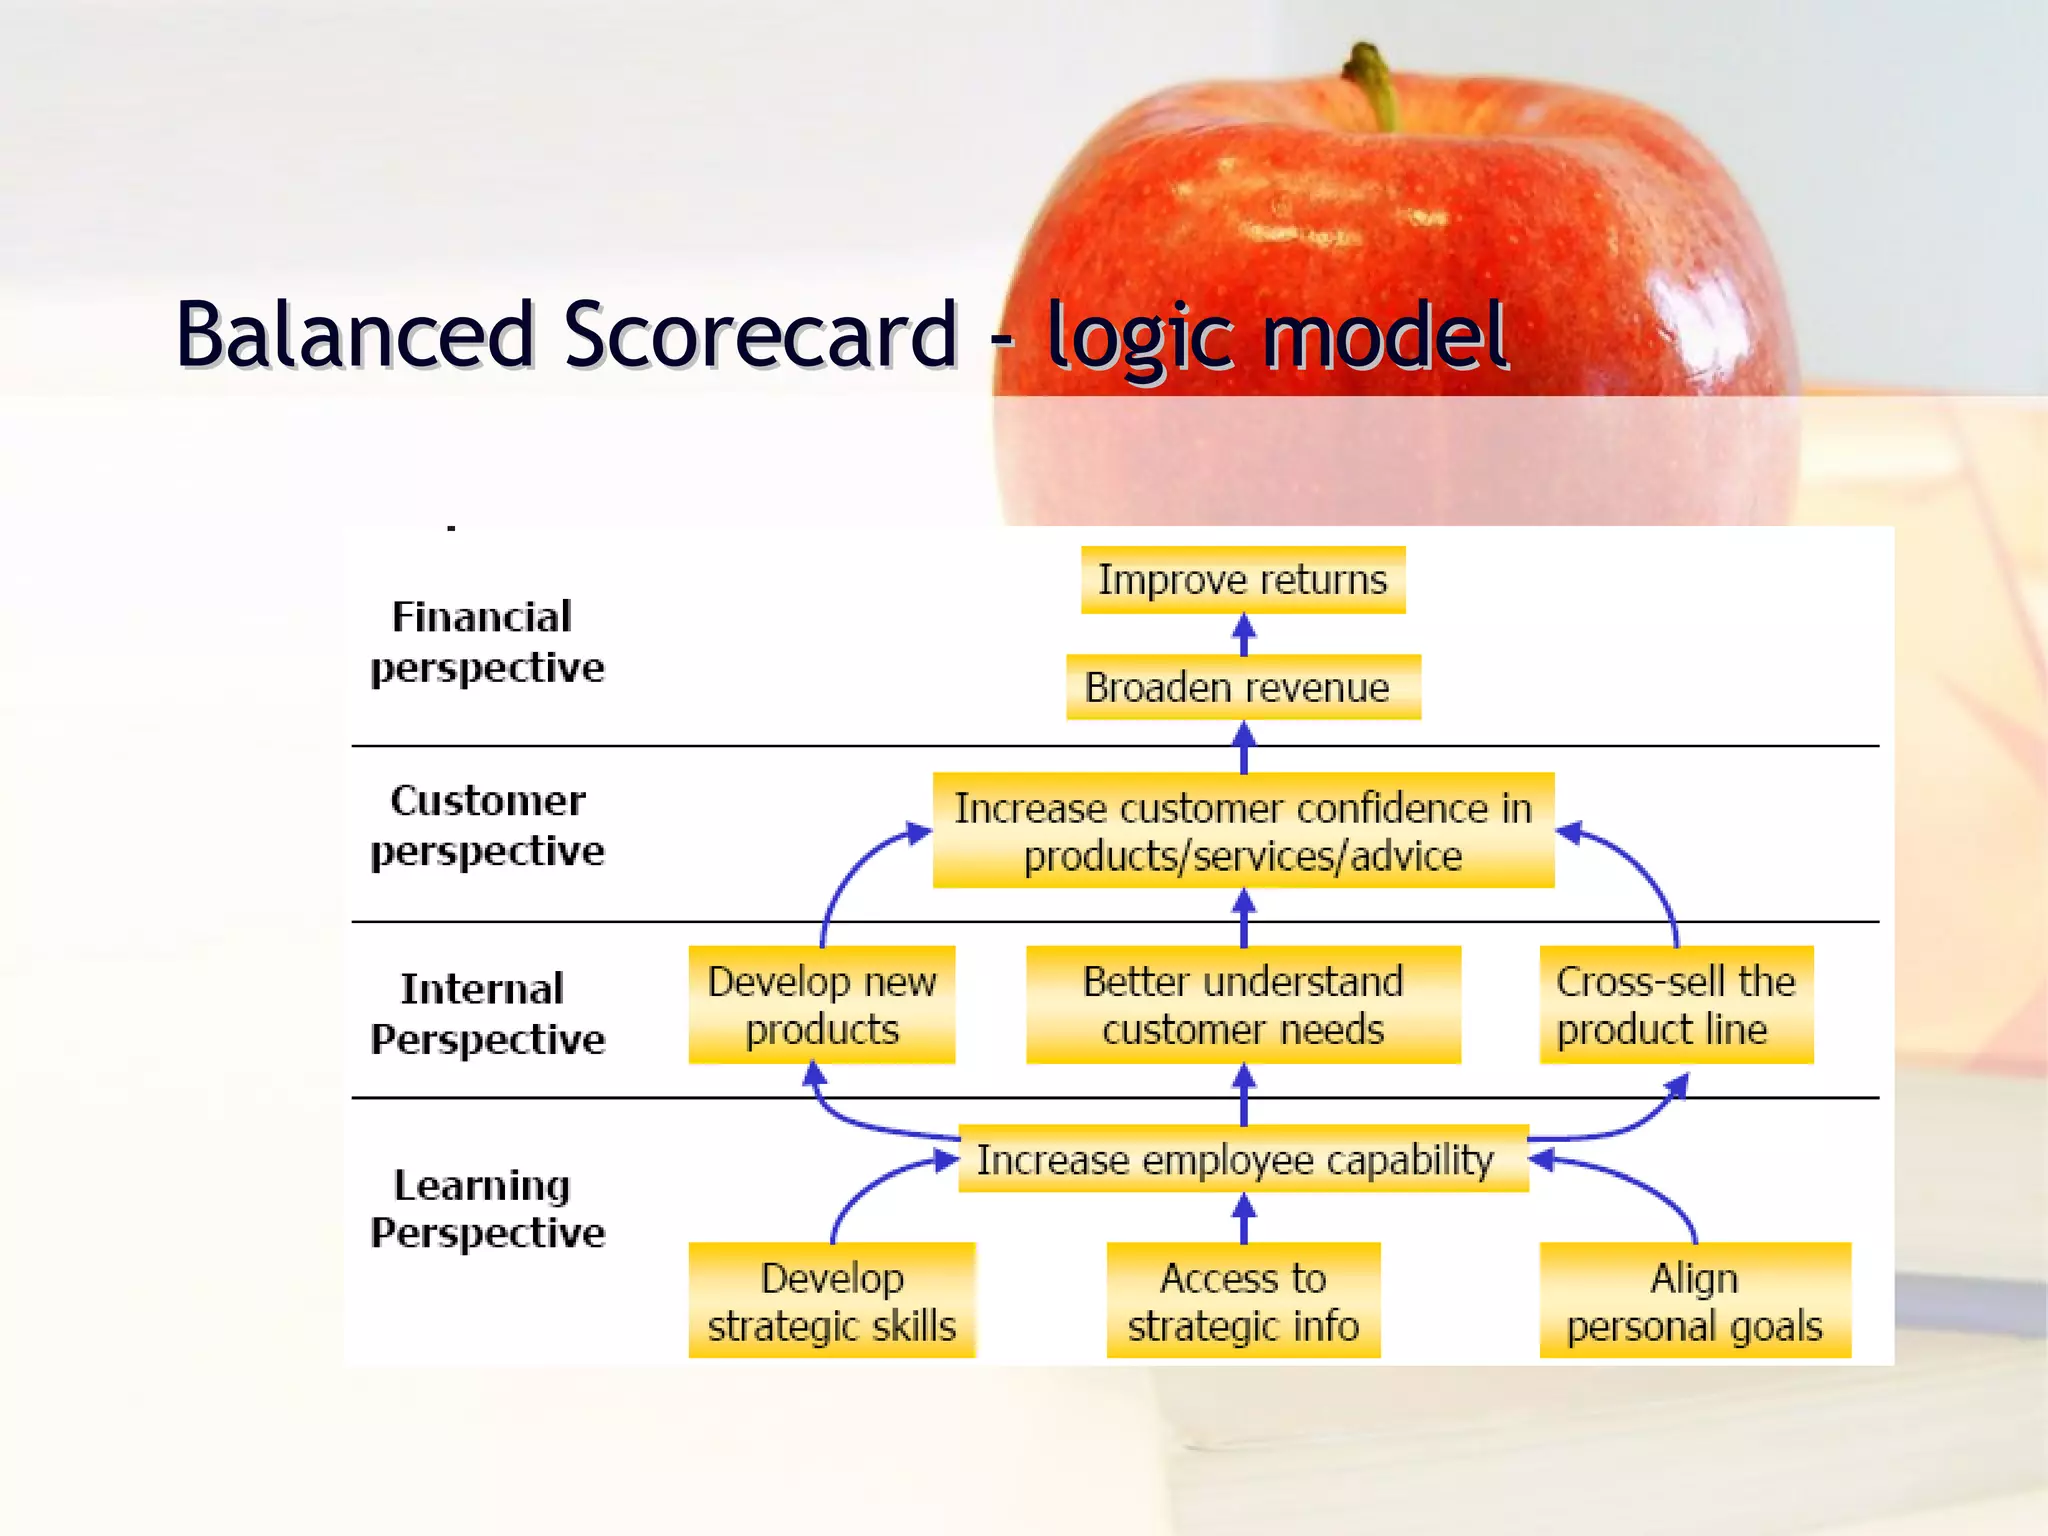
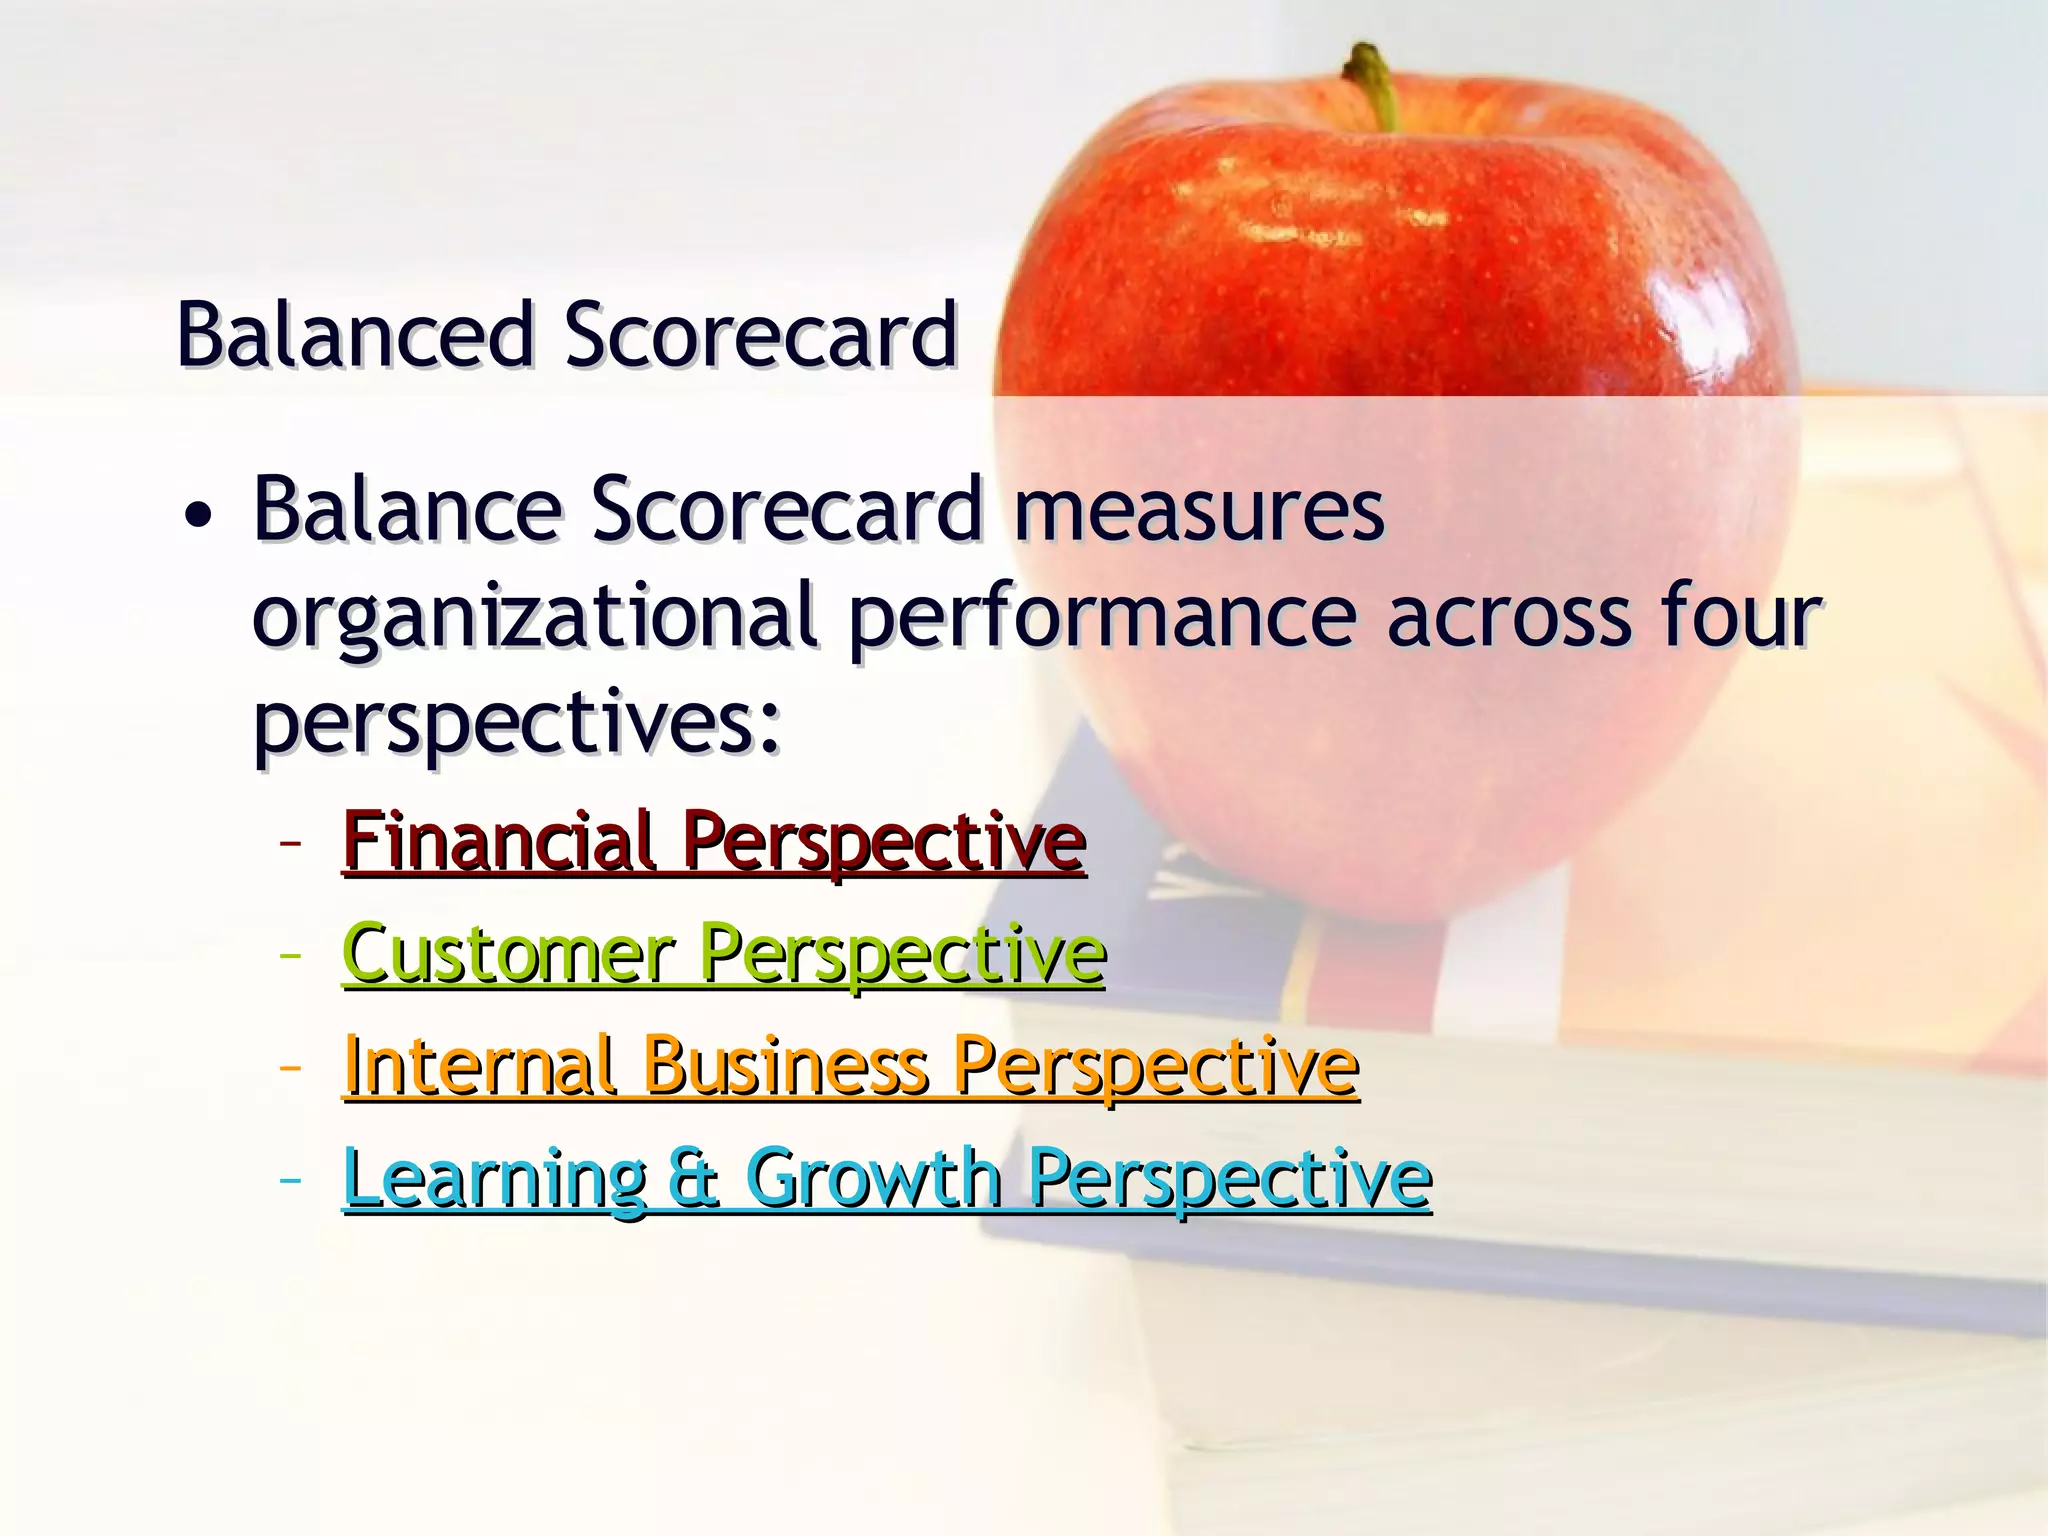
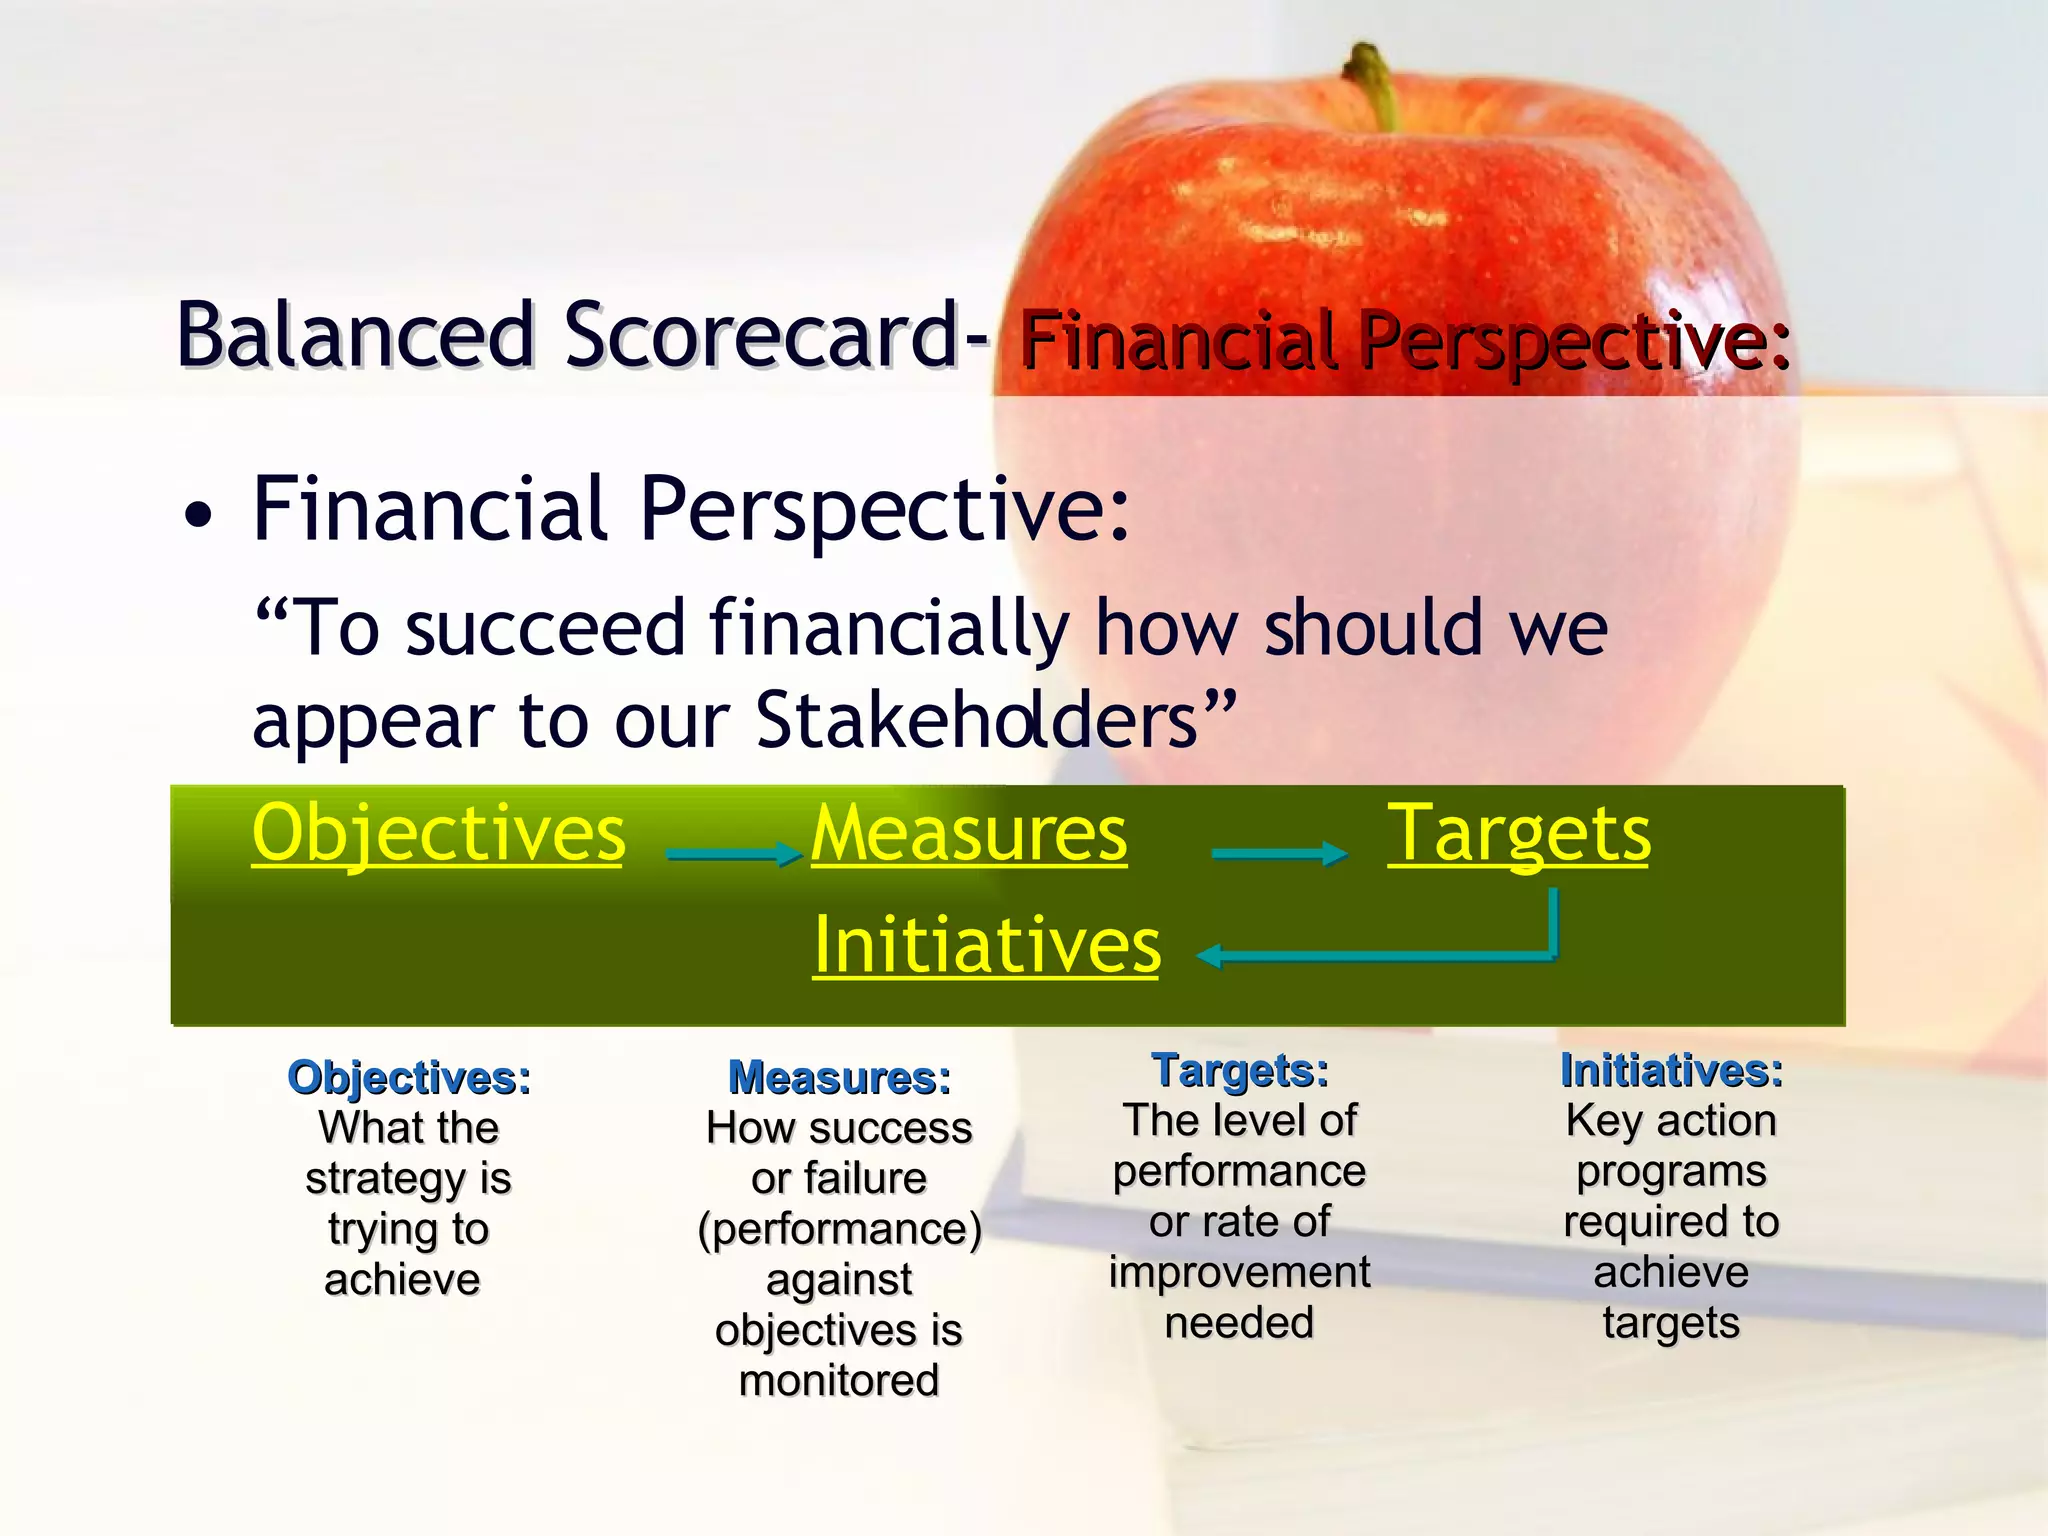
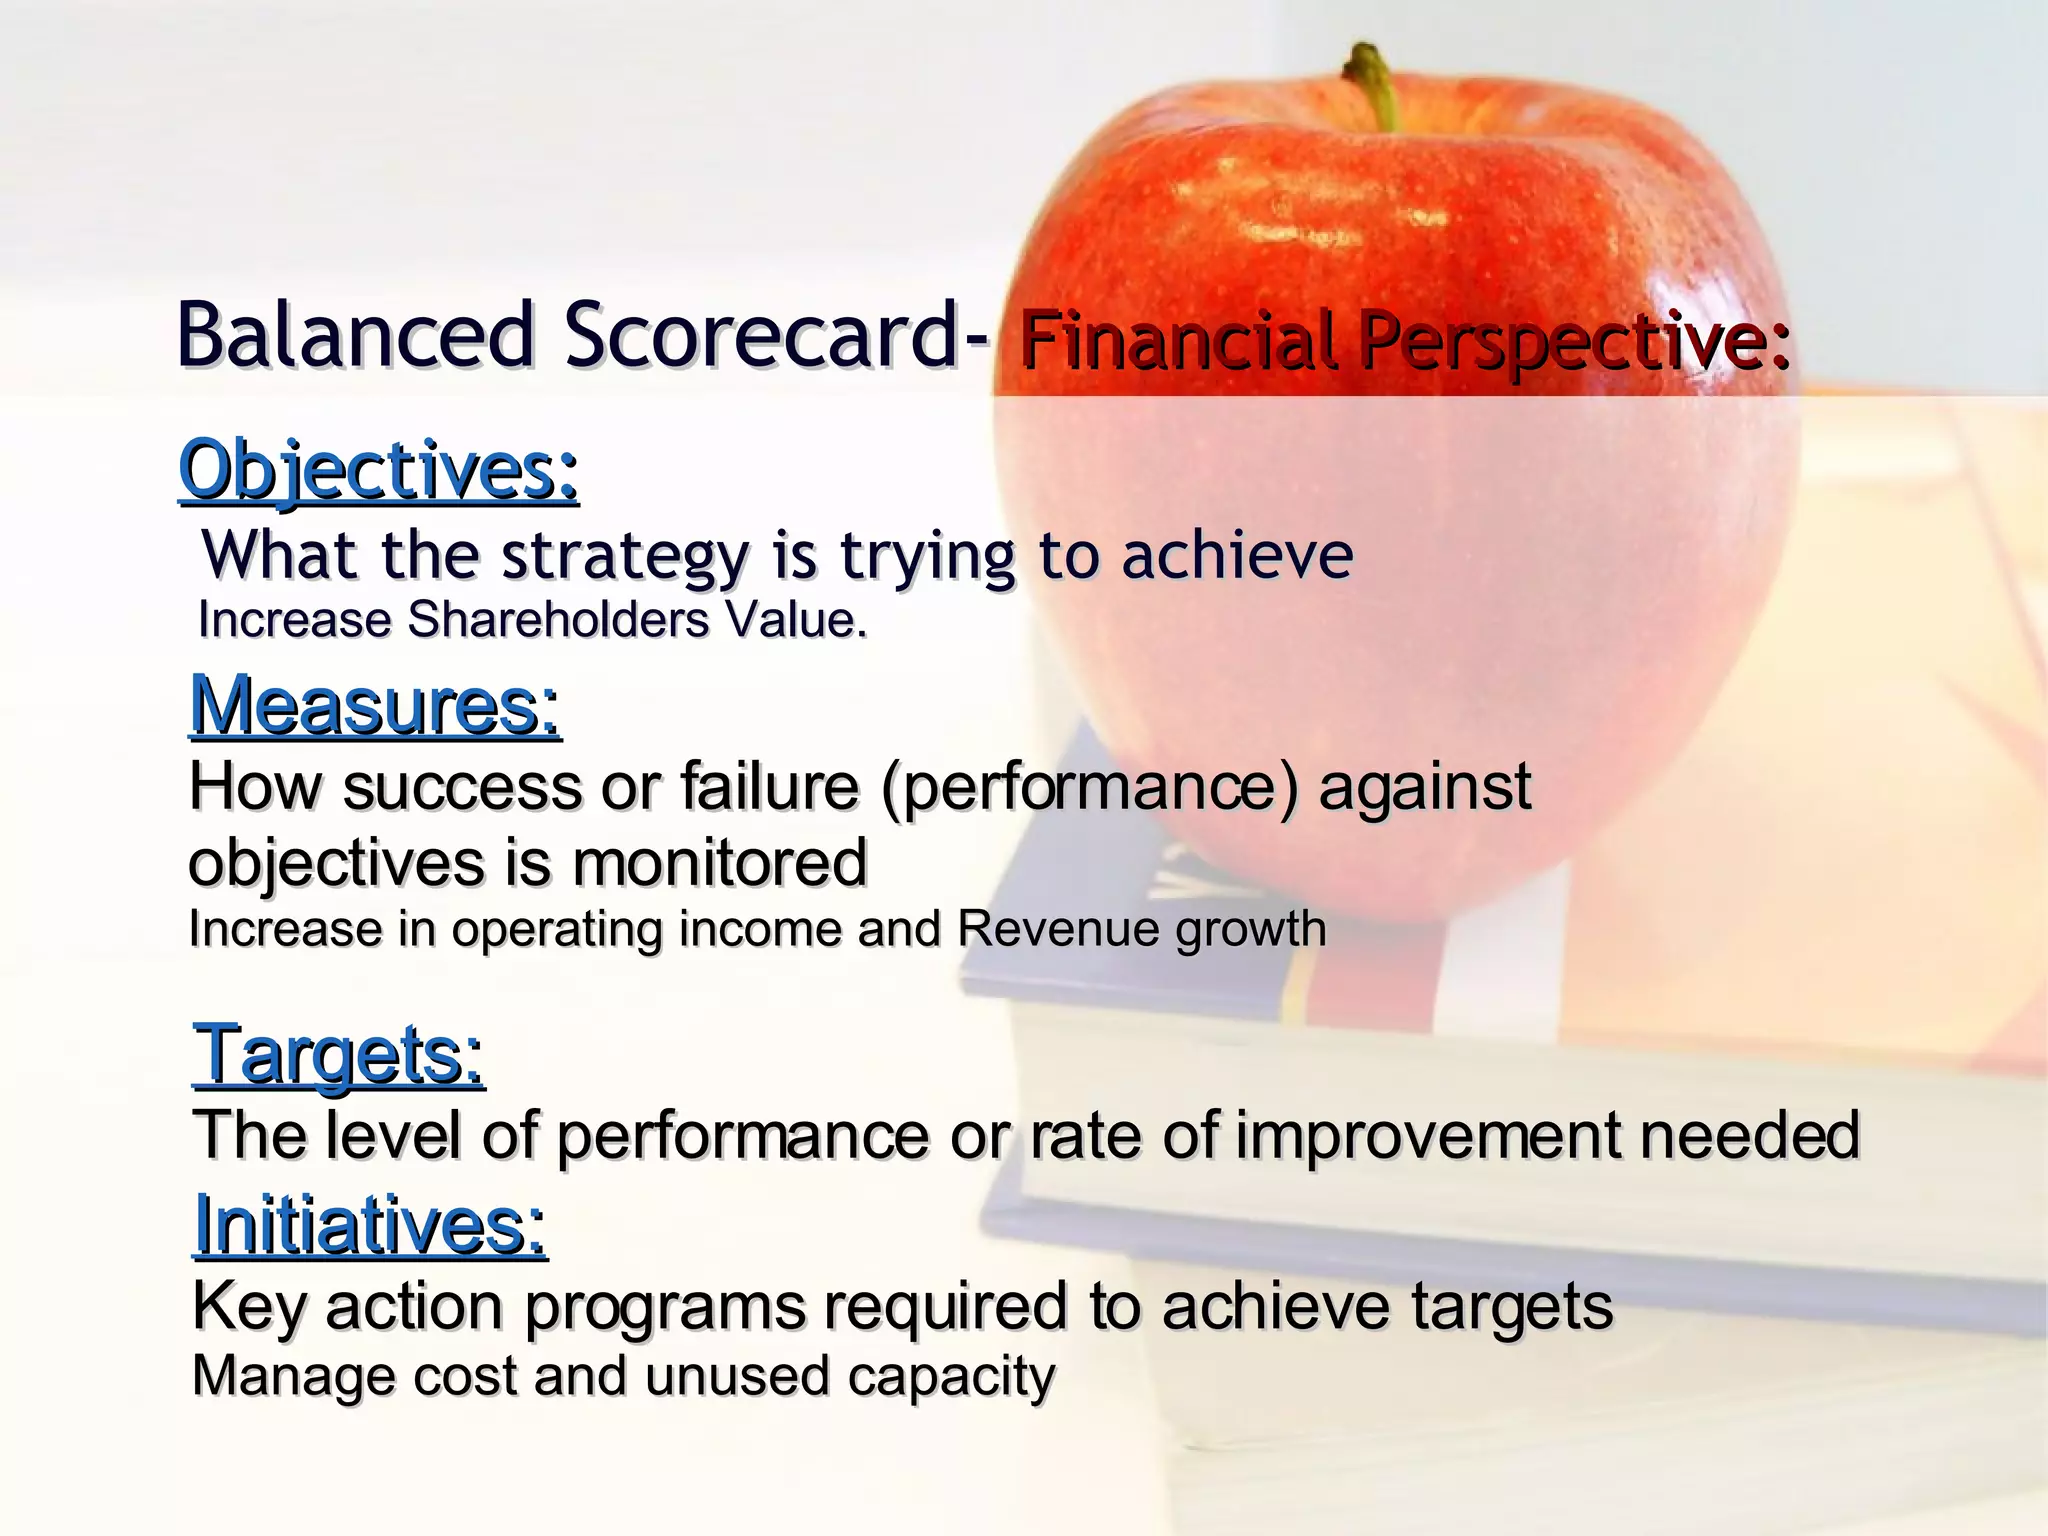
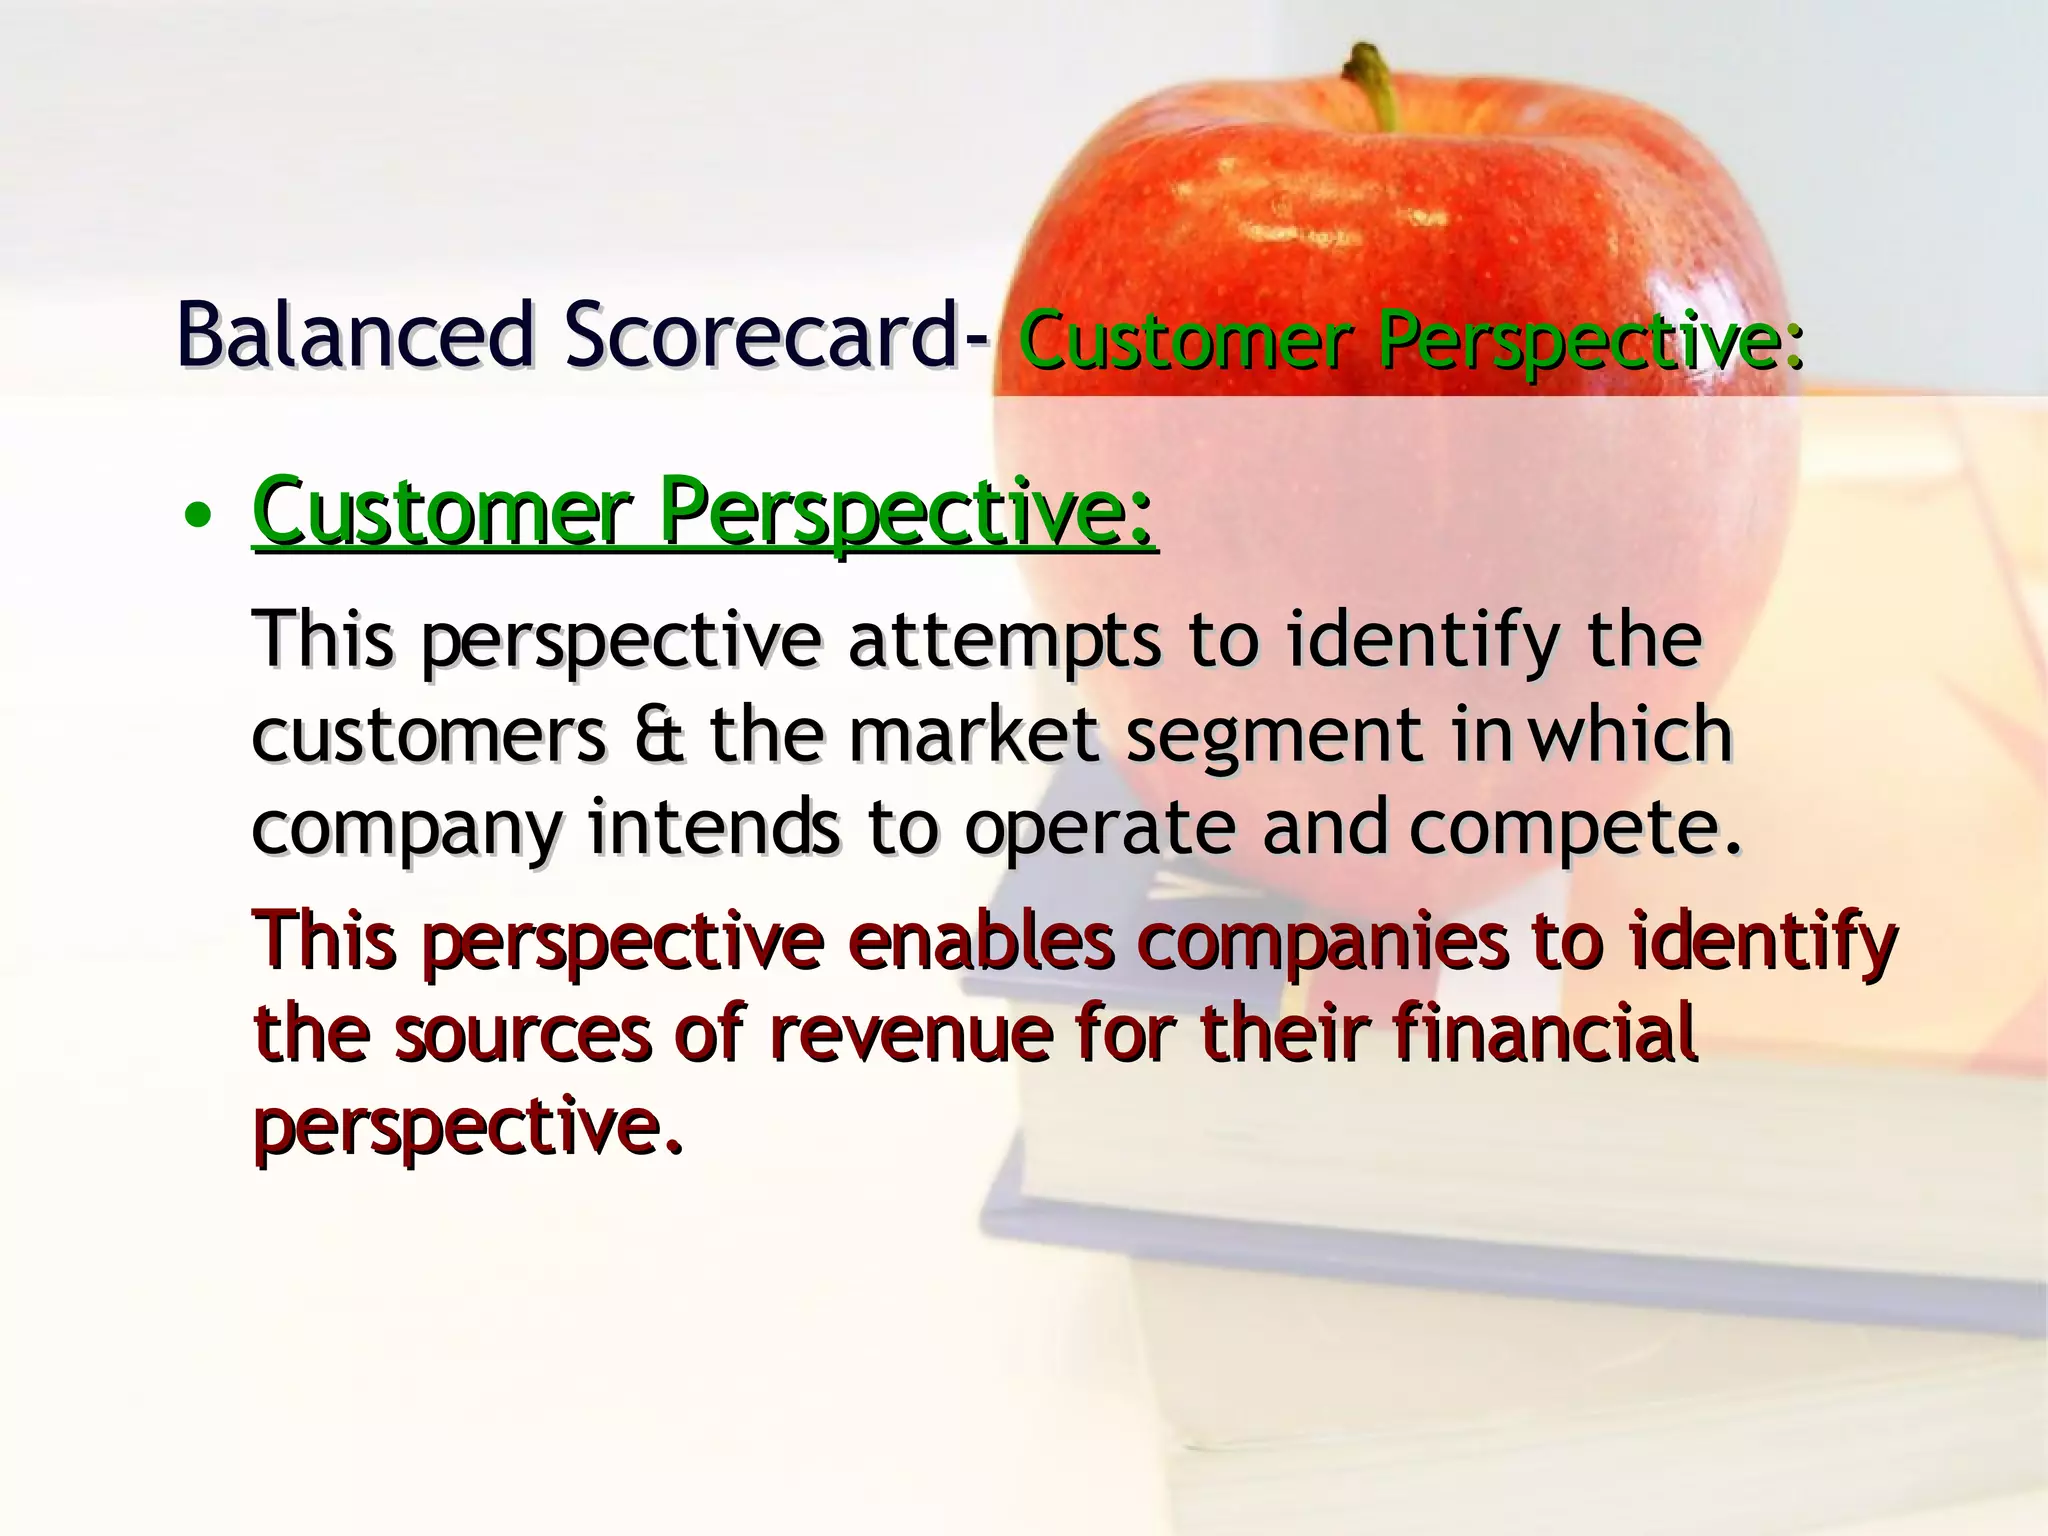
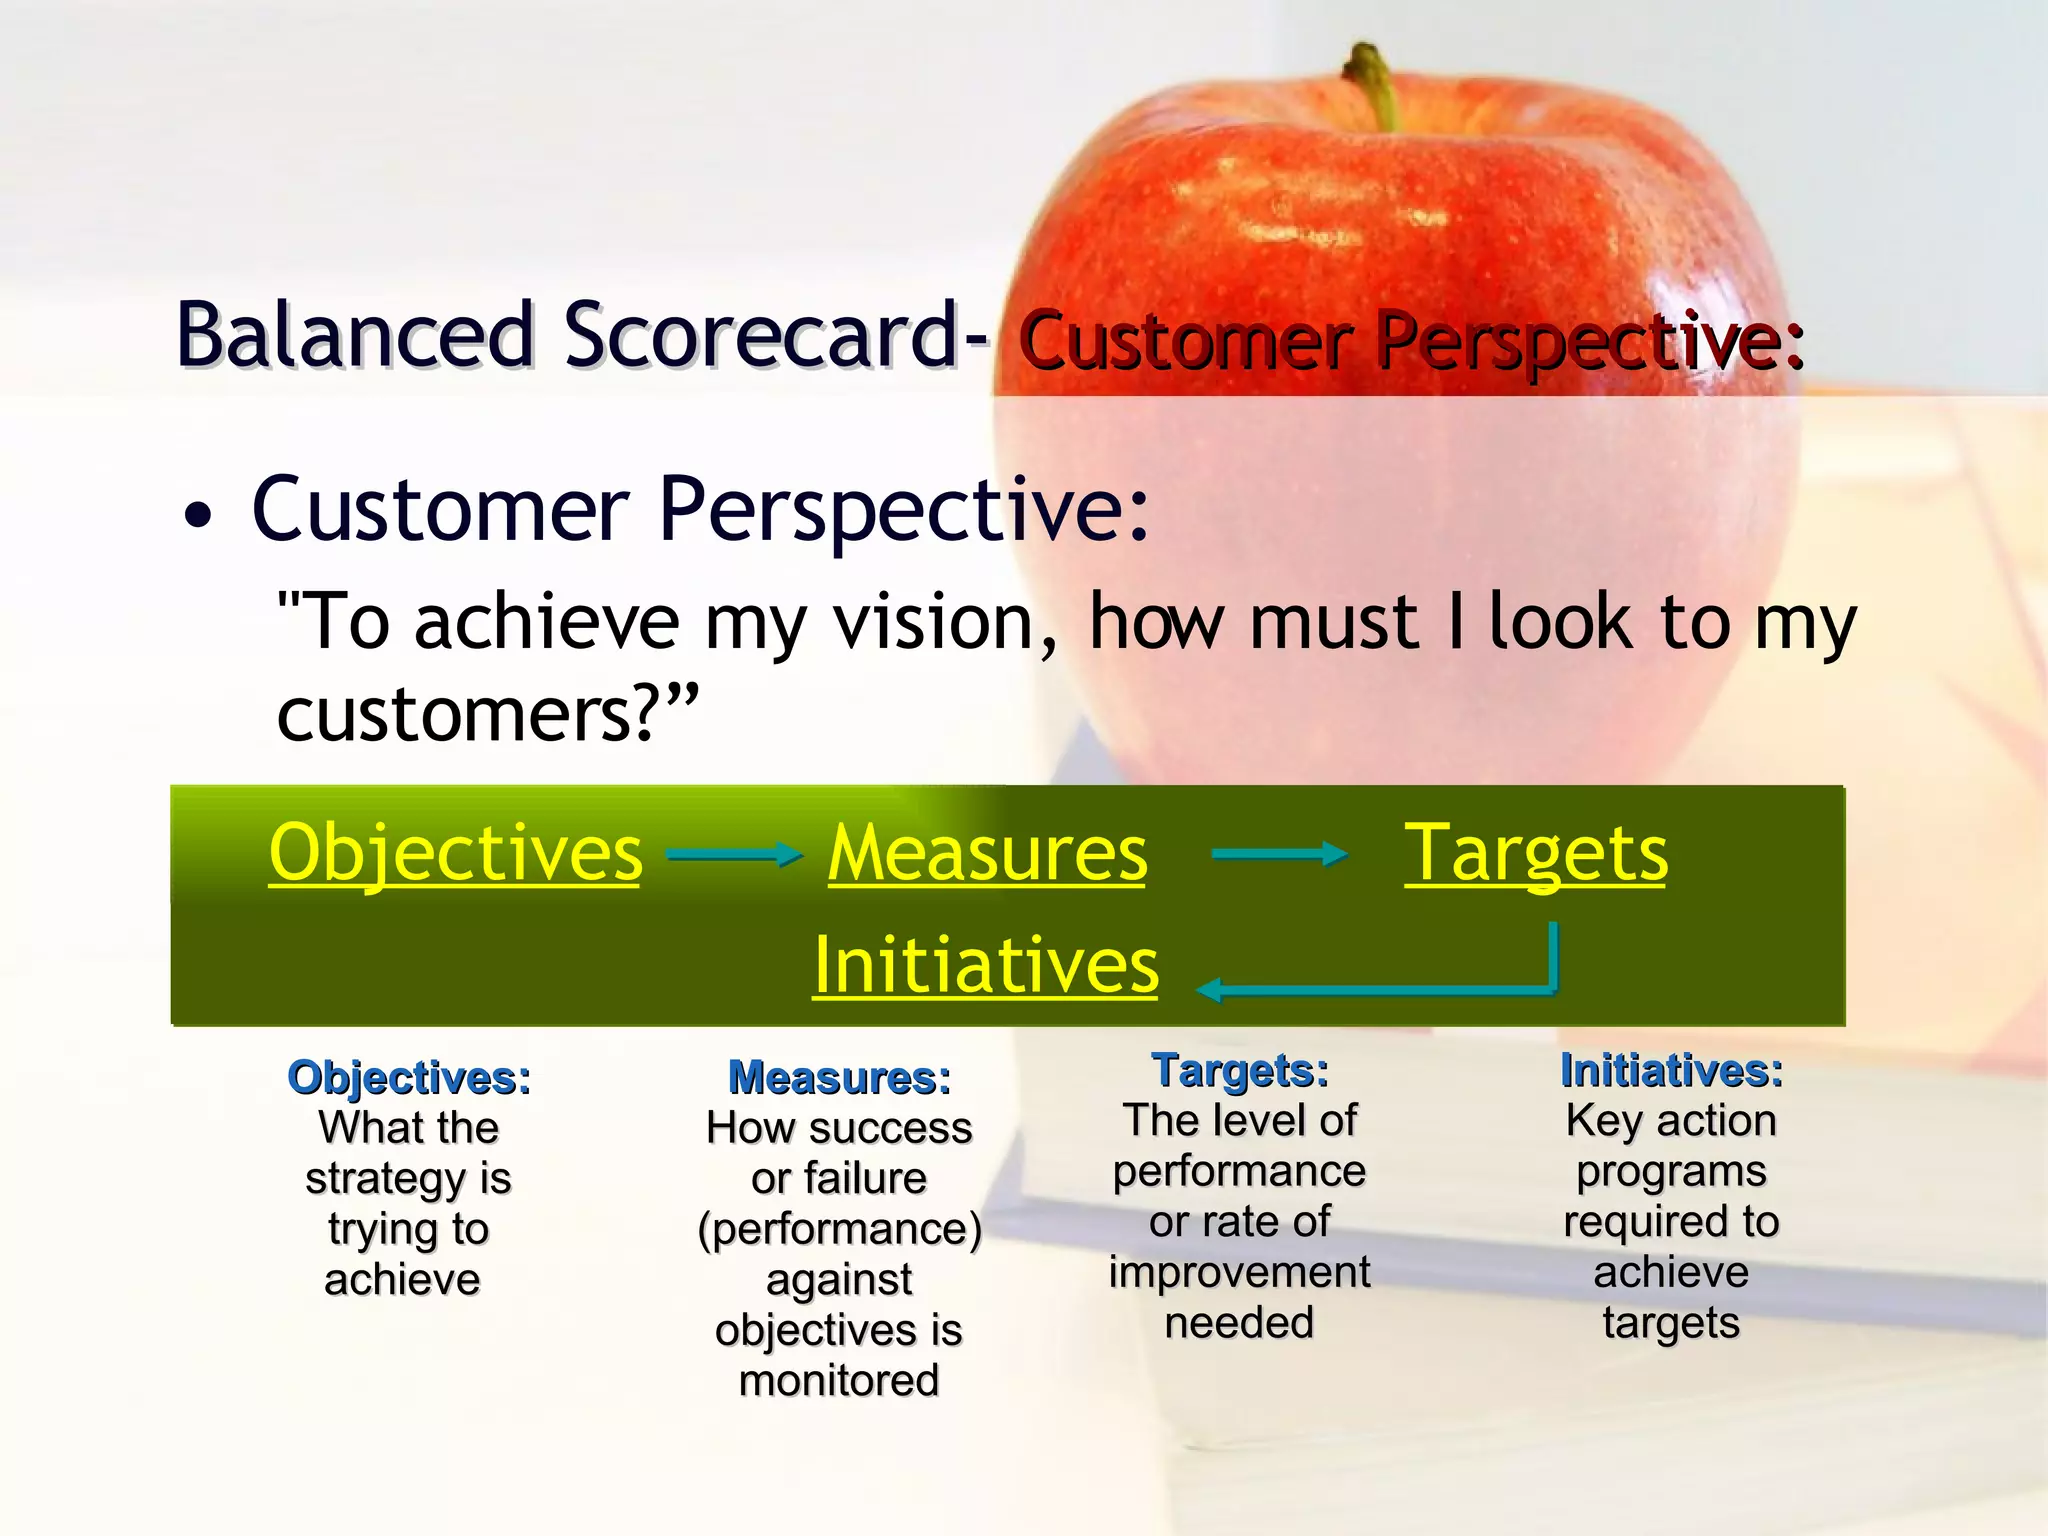
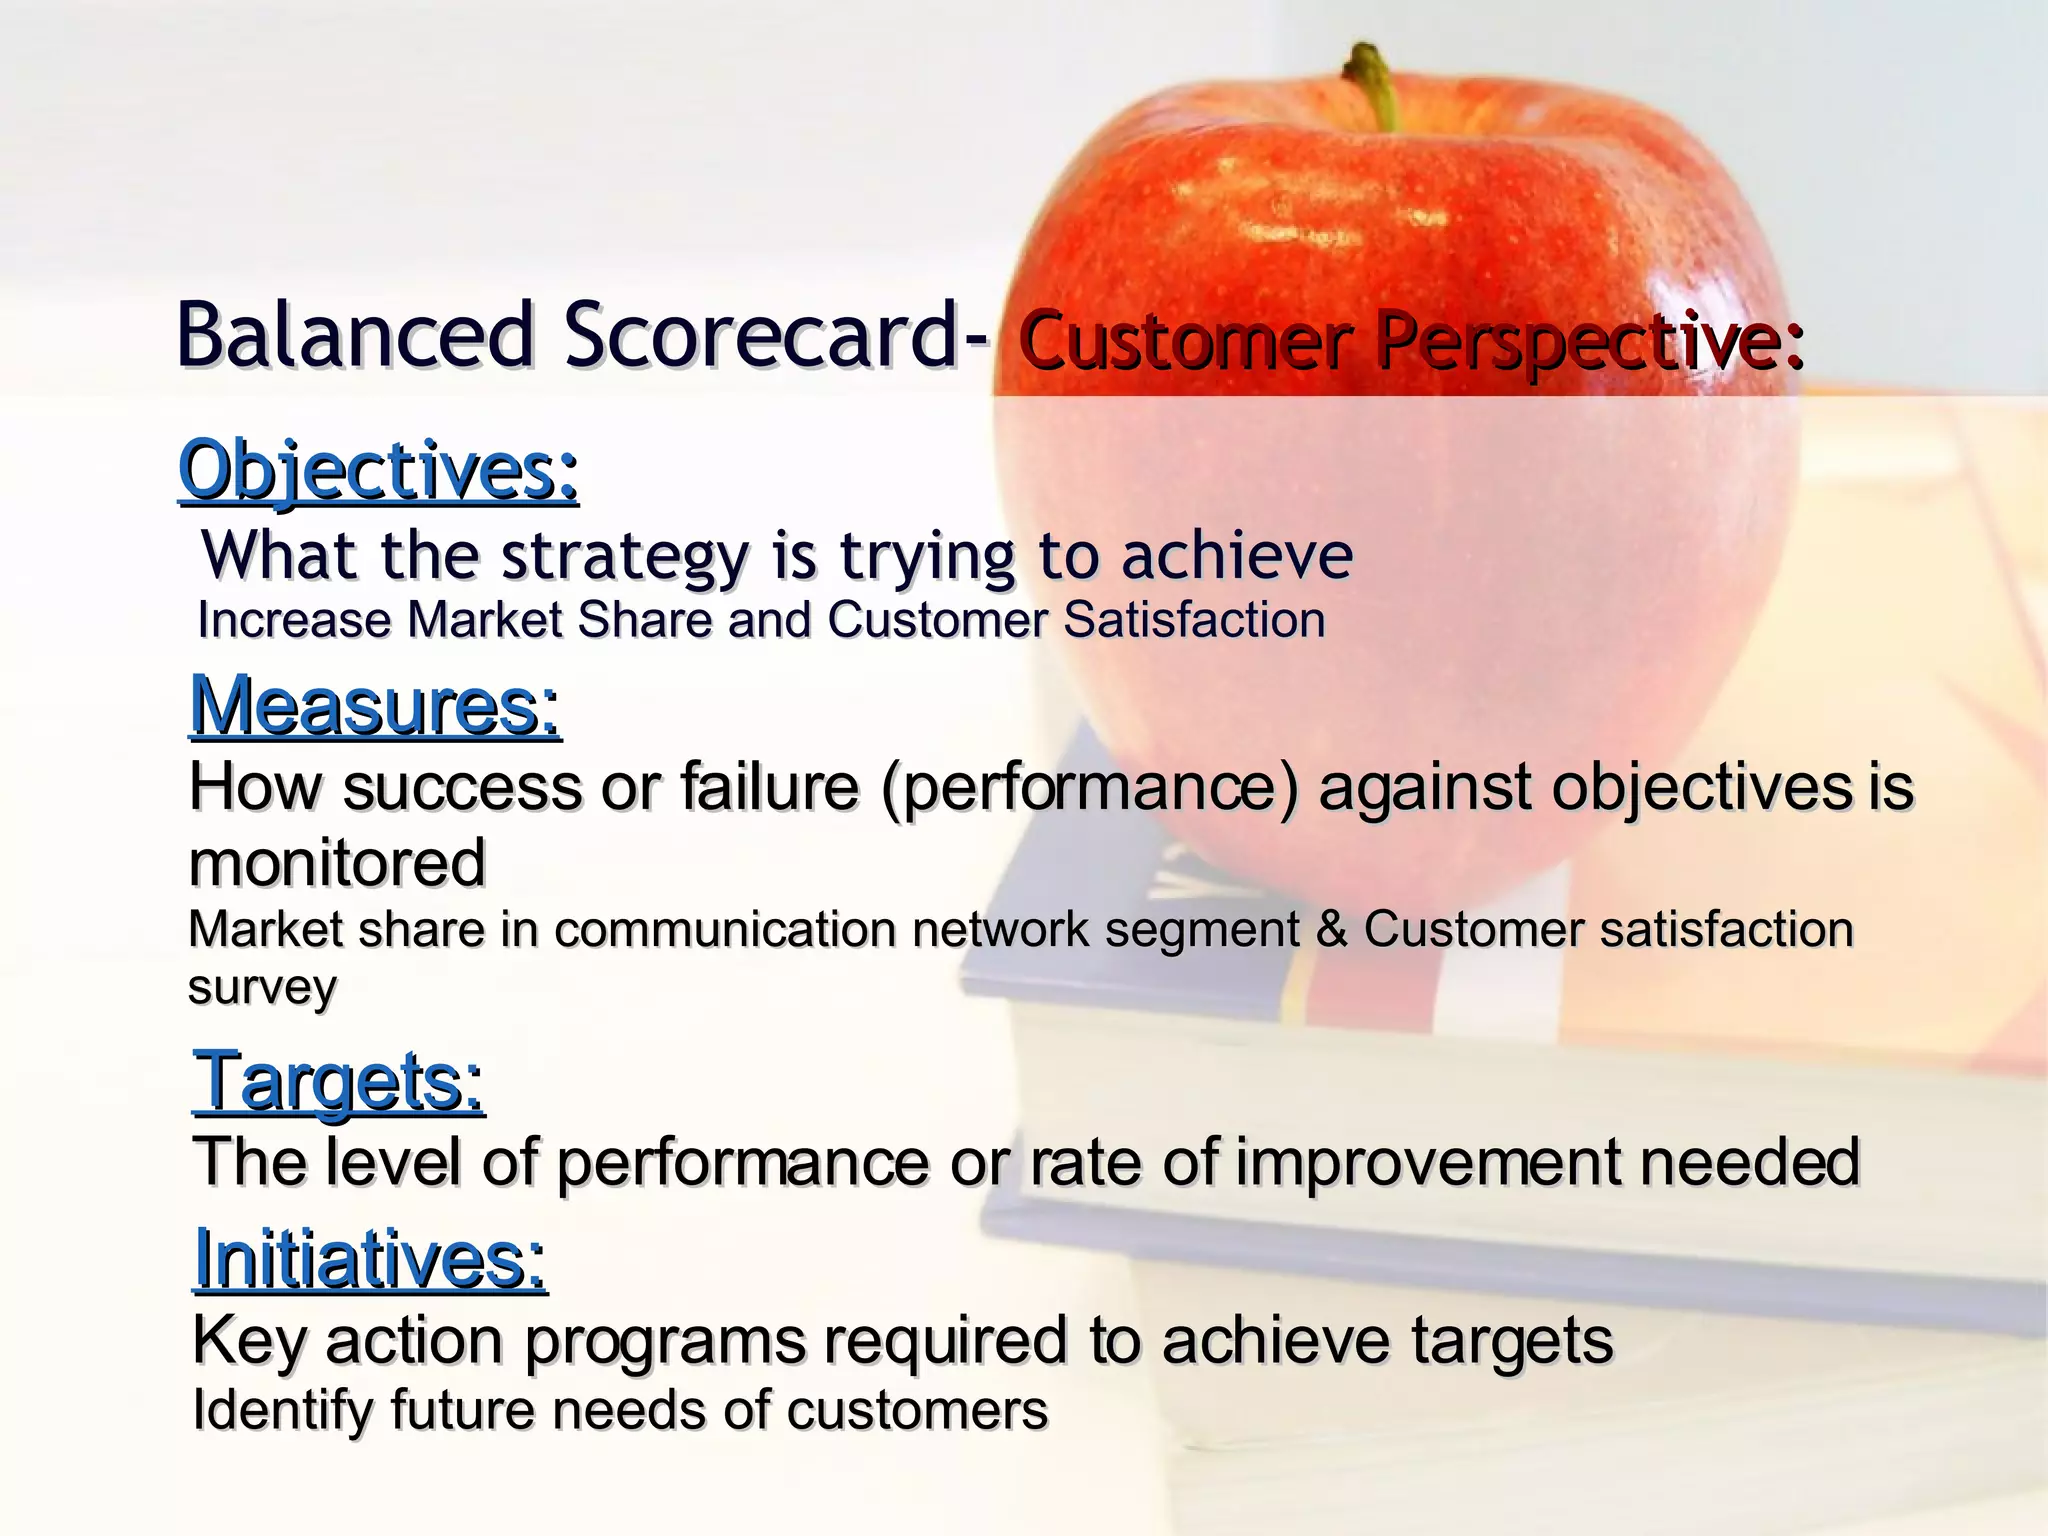
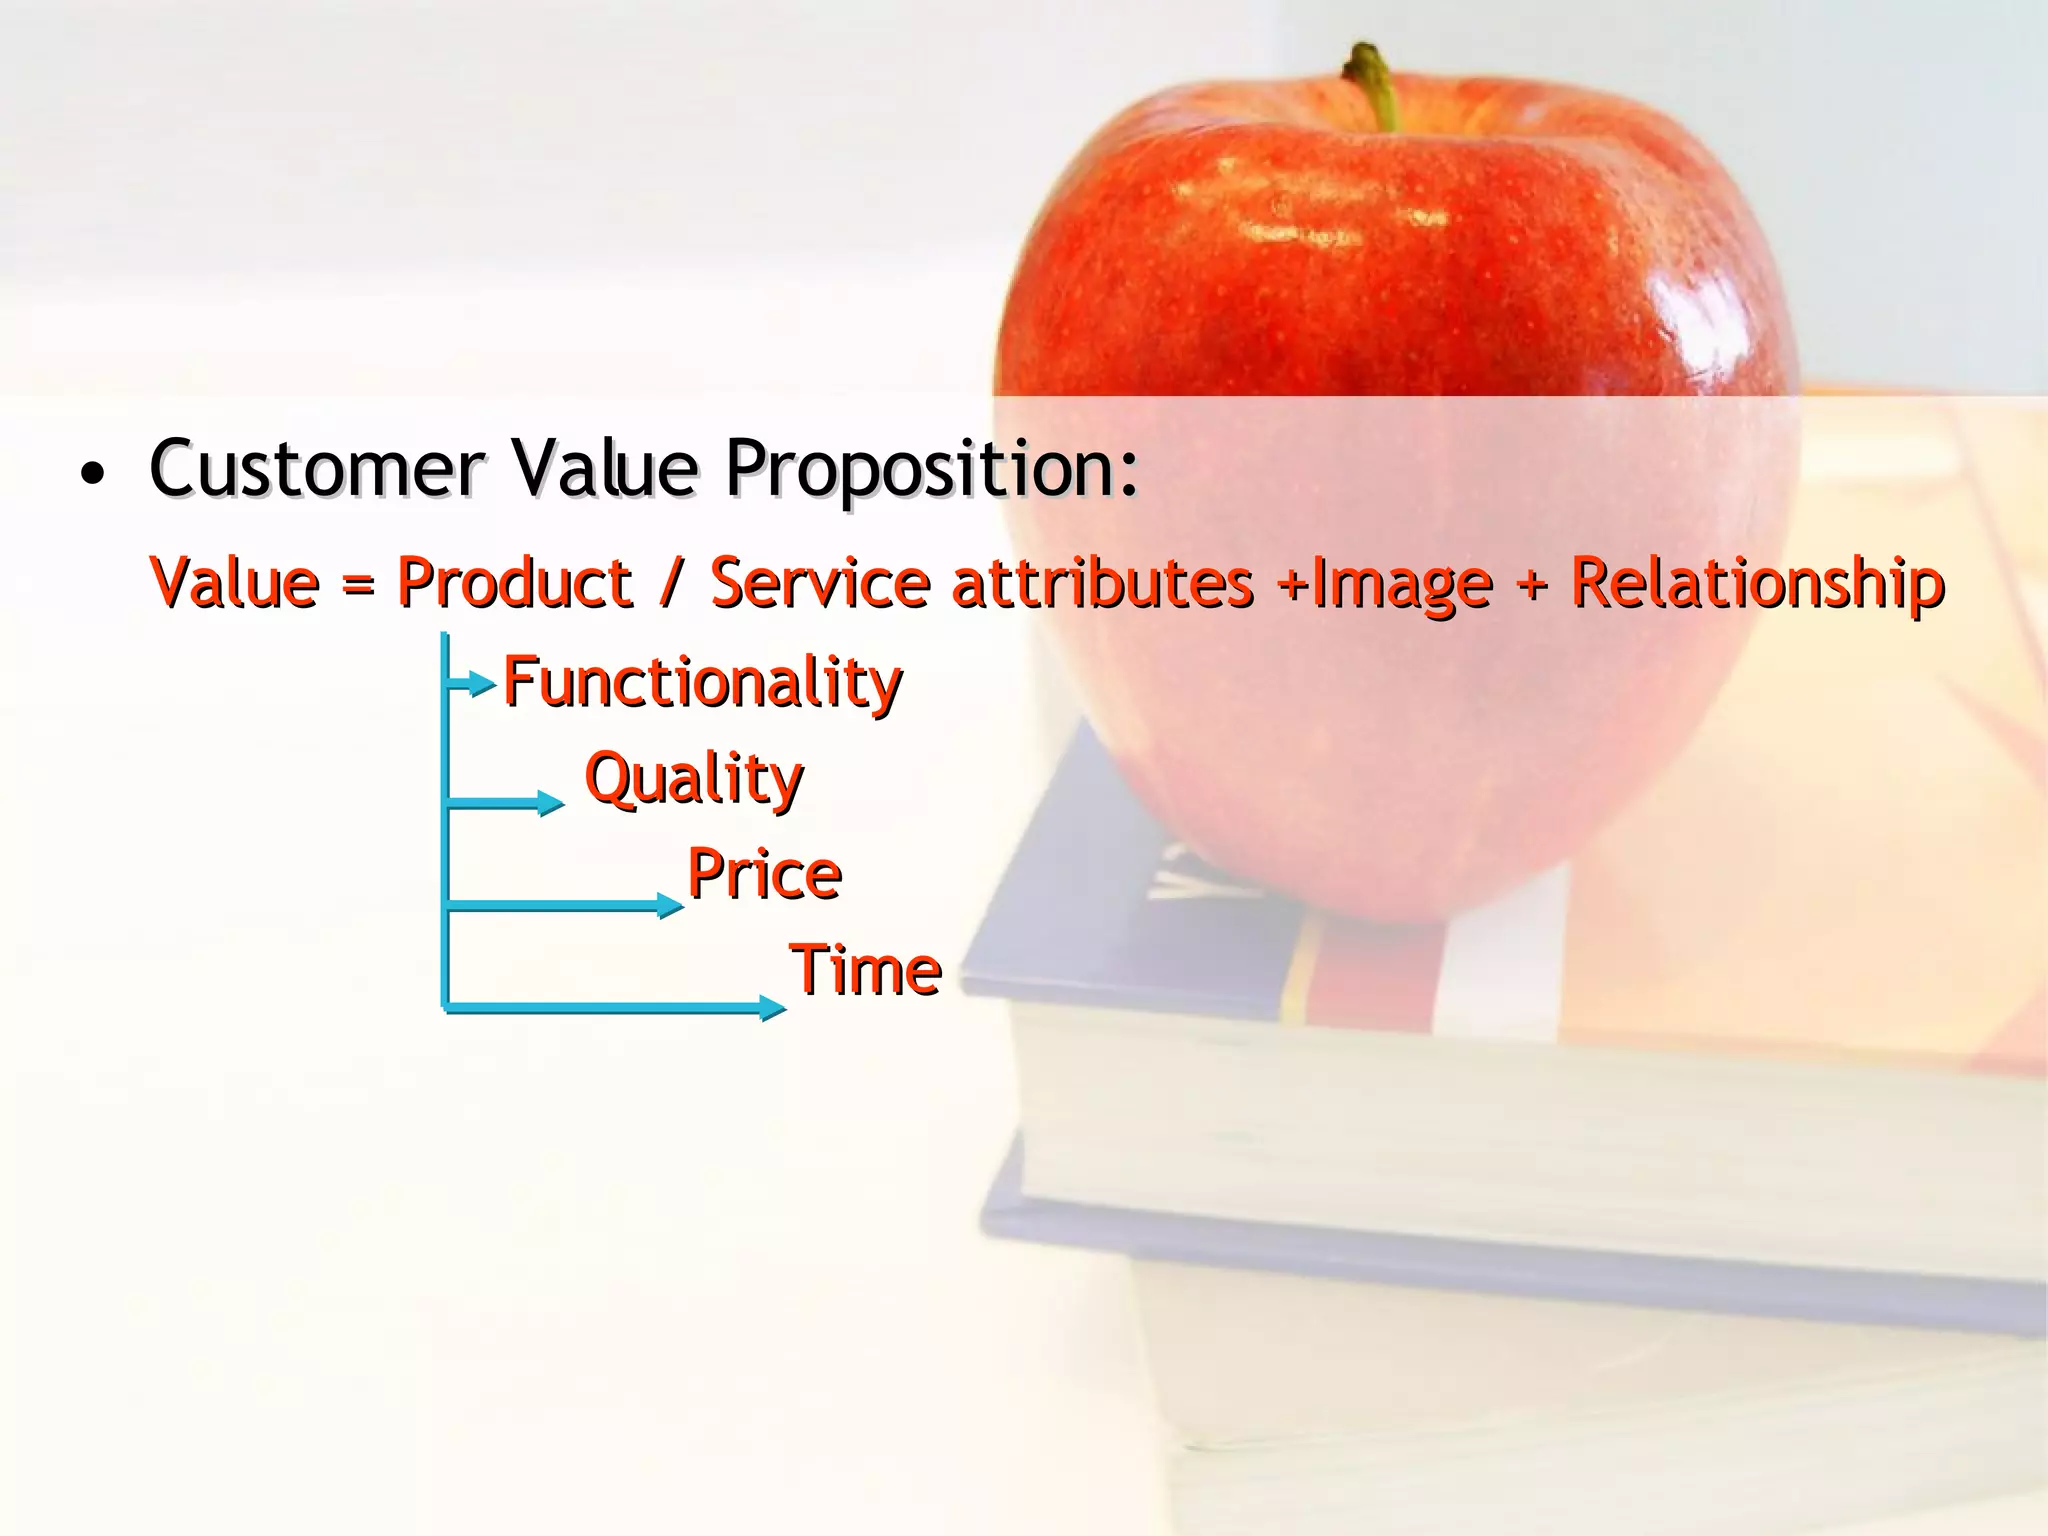
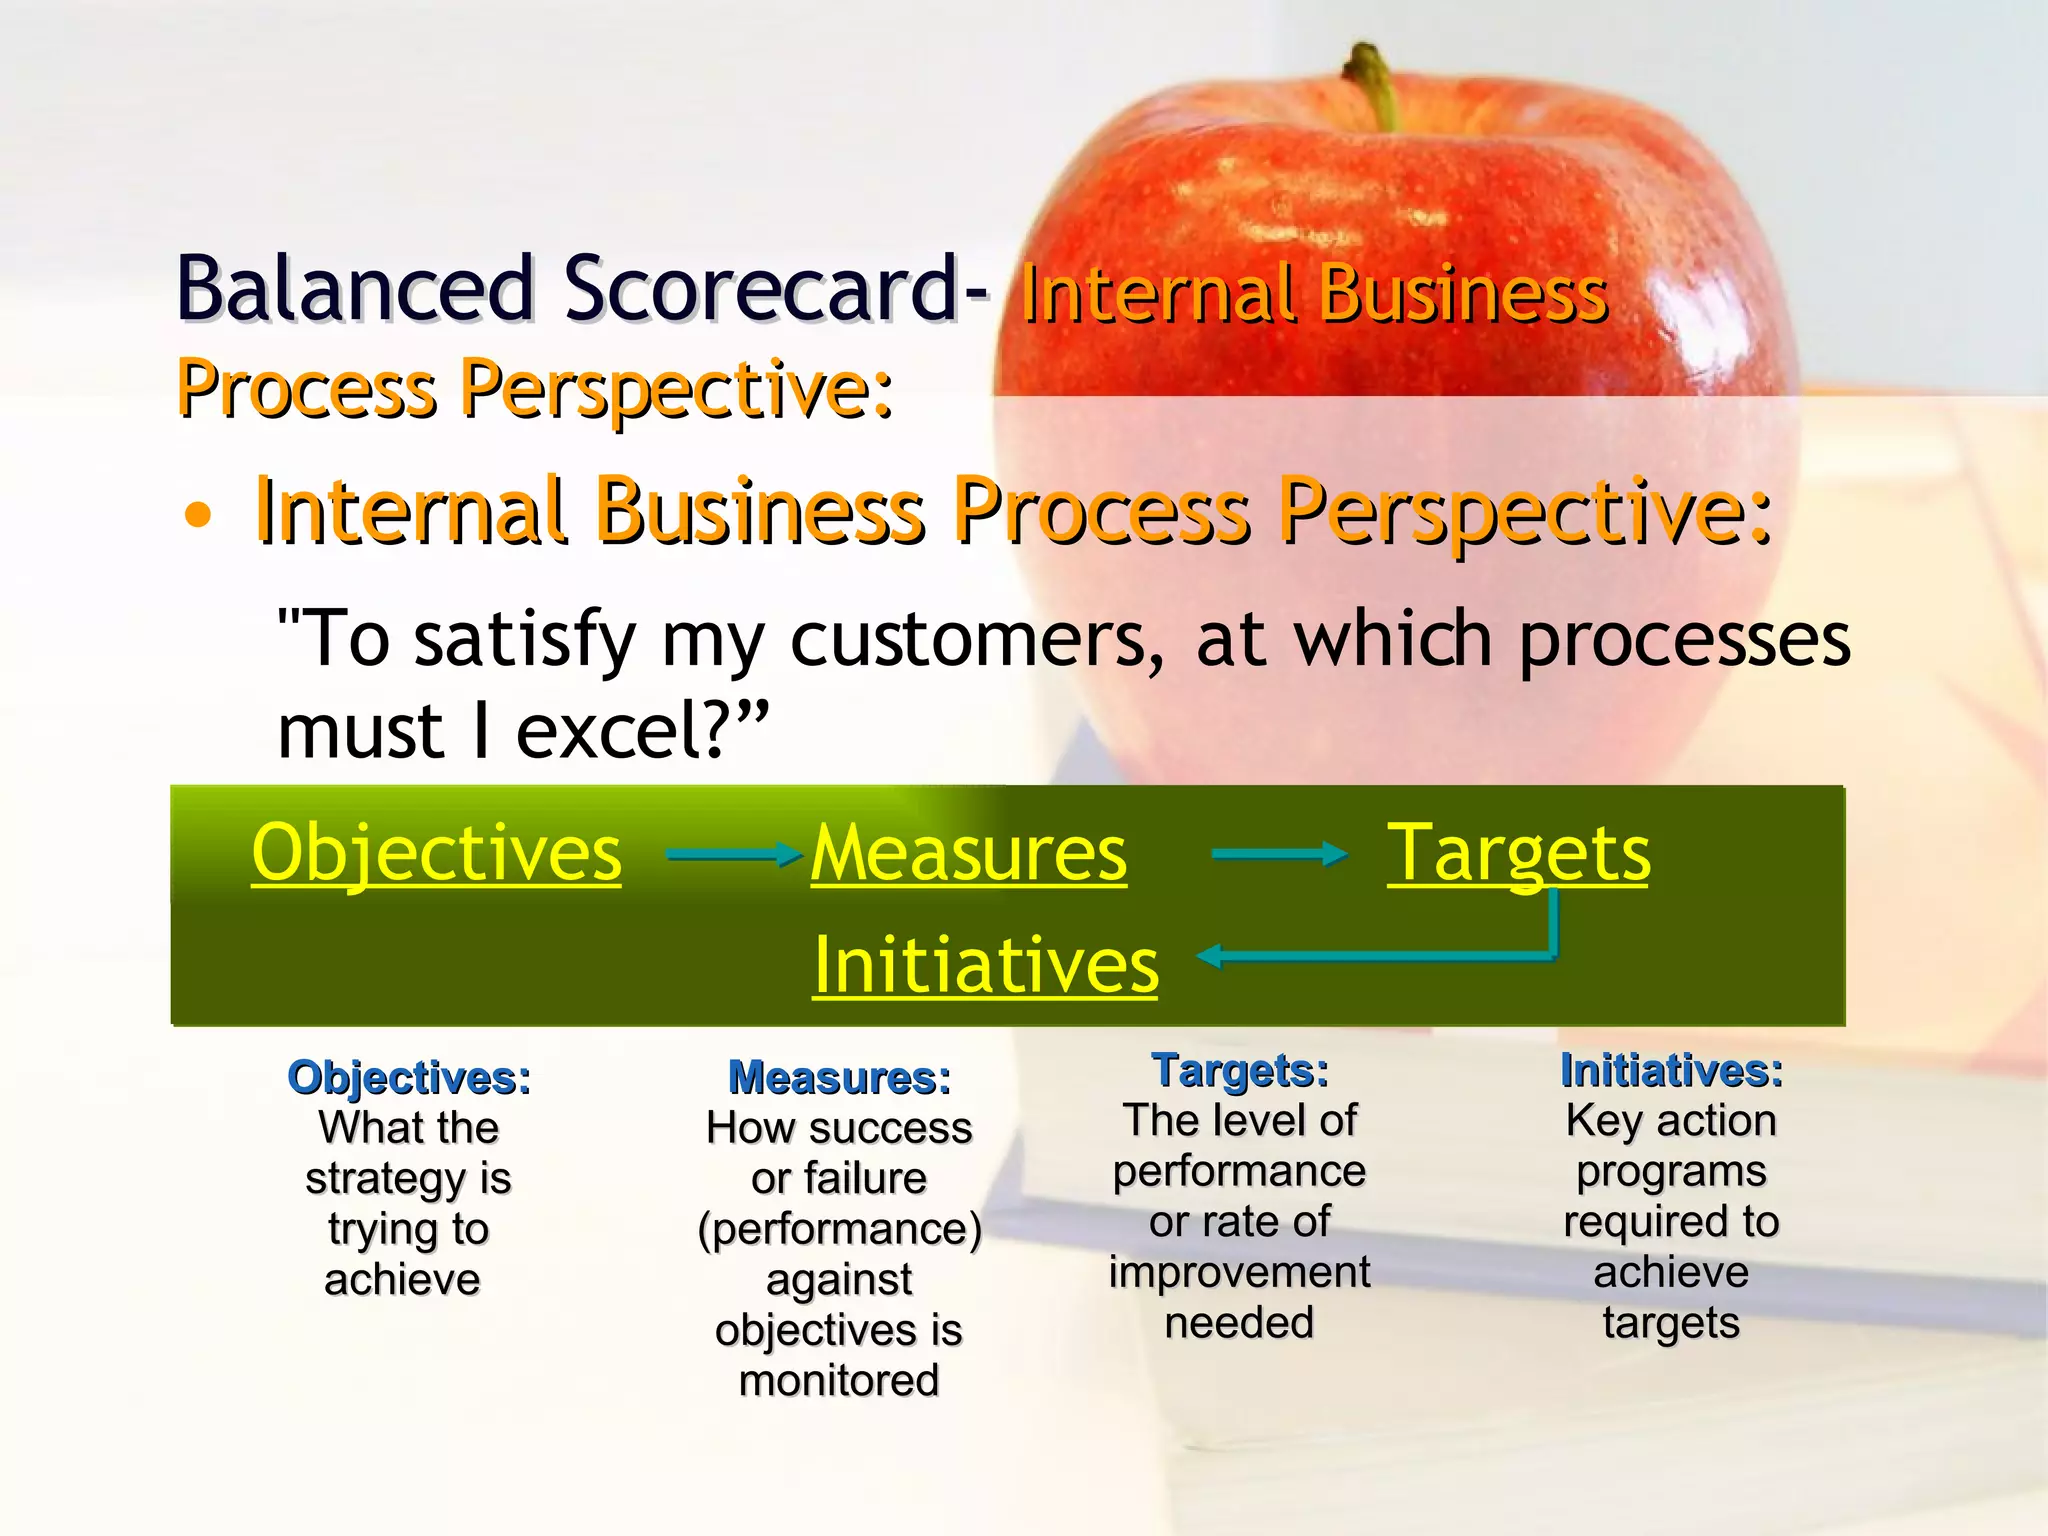
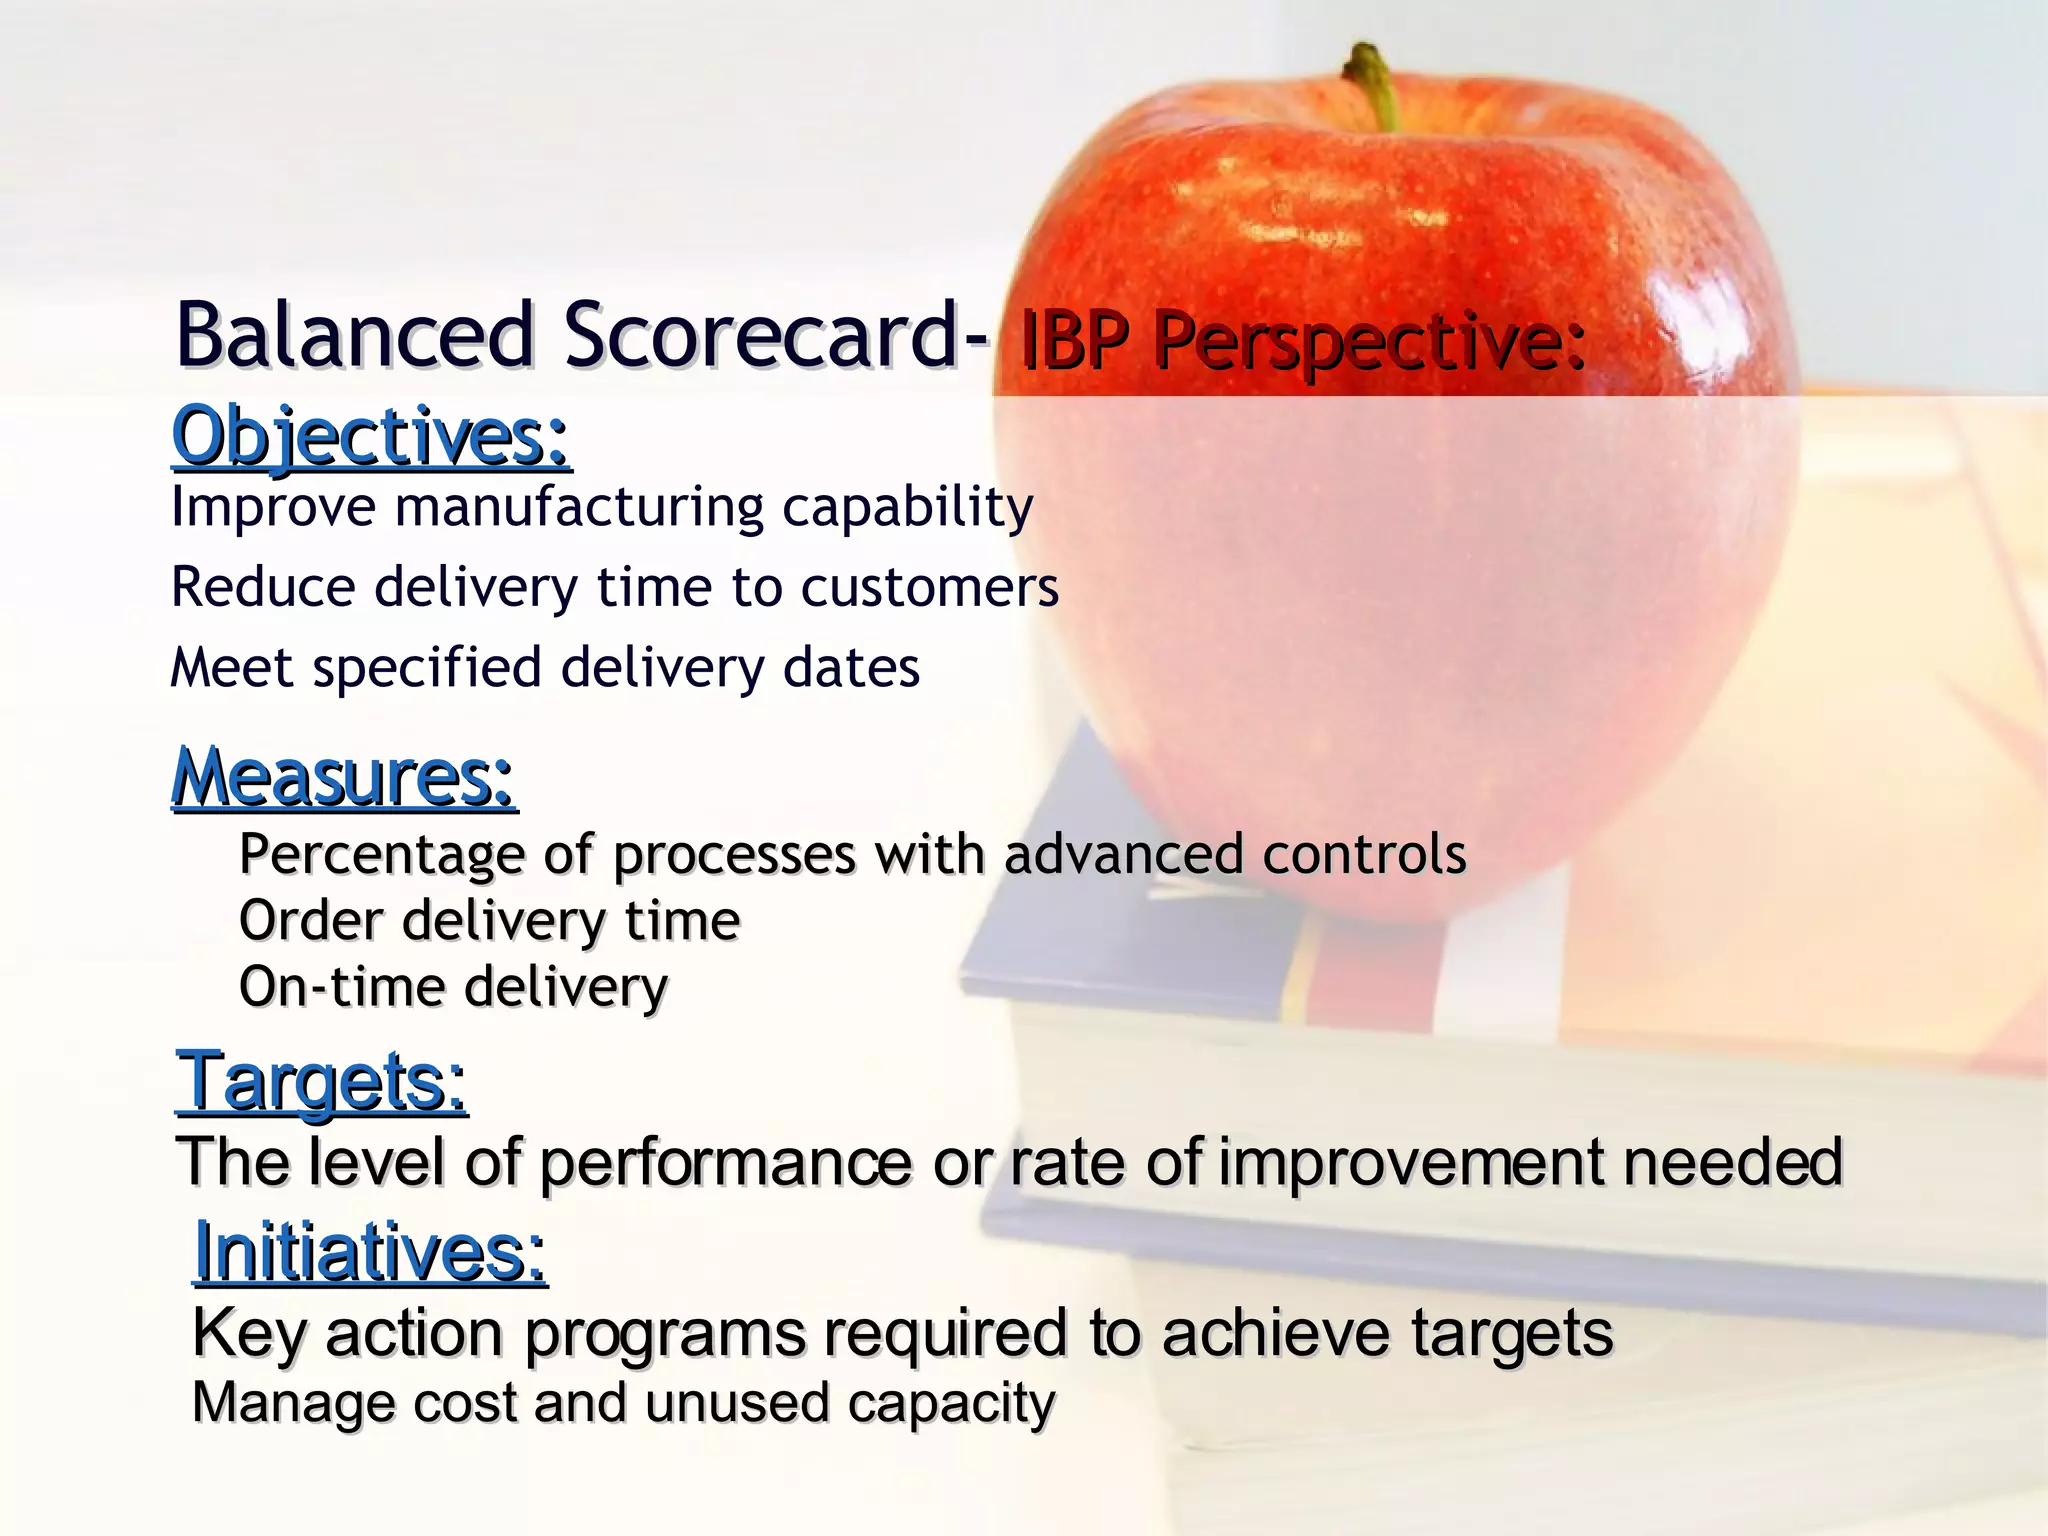


The document discusses the balanced scorecard performance measurement framework. It describes the balanced scorecard as measuring organizational performance across four perspectives: financial, customer, internal business processes, and learning and growth. Each perspective has objectives, measures, targets, and initiatives. The balanced scorecard links performance measures to strategy and helps organizations communicate and monitor their strategy.