Downloaded 239 times


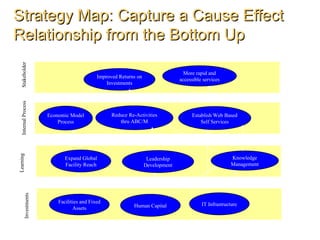
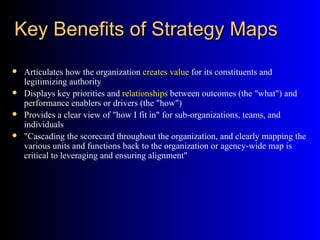
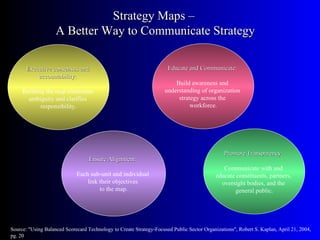
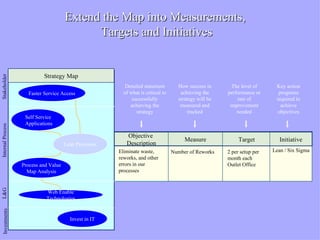
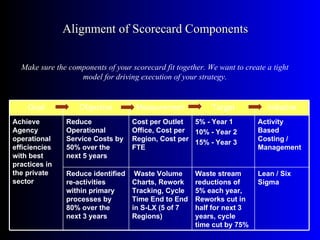
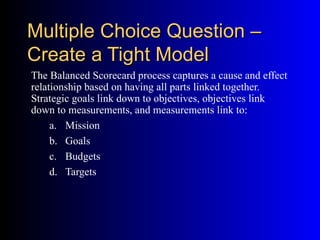

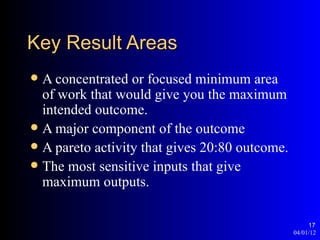
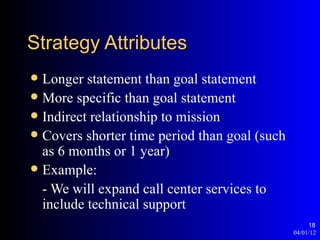
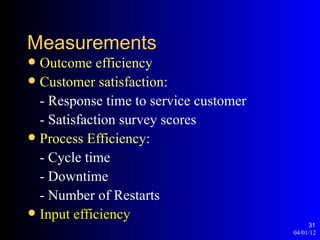
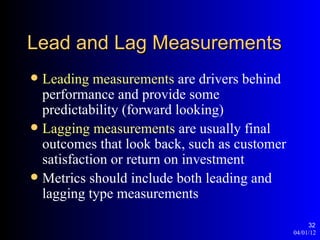
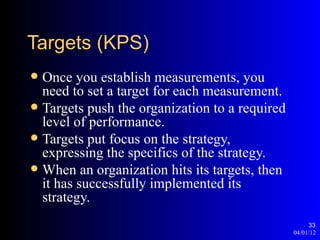
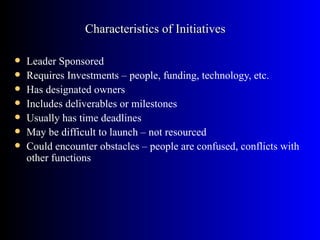
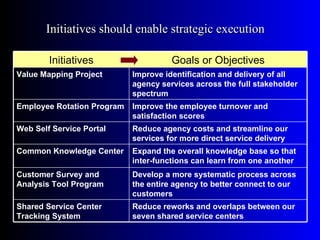
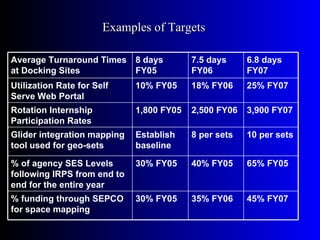
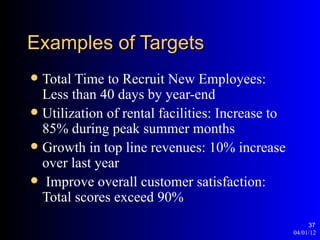
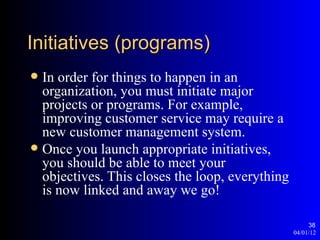
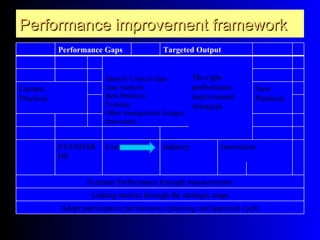


The document outlines the concept of metric management as an alternative to the balanced scorecard, emphasizing the importance of linking strategic goals, objectives, and measurements to improve organizational performance. It highlights key components such as strategy maps, which capture cause-and-effect relationships, and the necessity of establishing clear metrics and targets for each initiative. The presentation illustrates how these frameworks can enhance communication of strategy, accountability, and overall alignment within an organization.