Downloaded 407 times

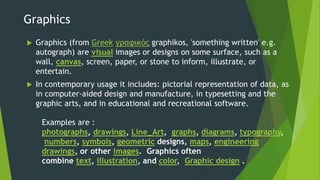
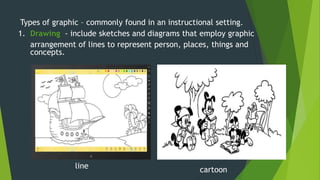
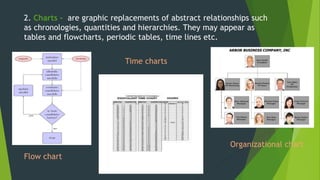
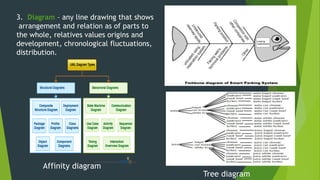
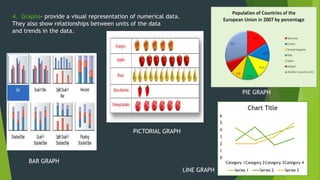
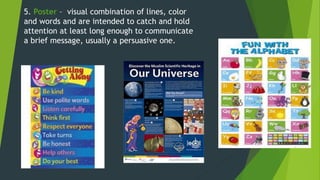
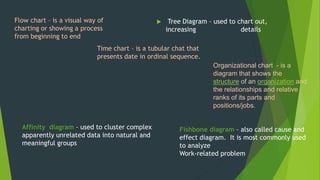
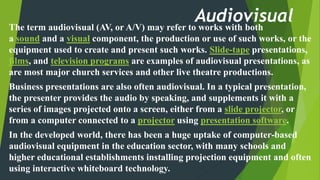
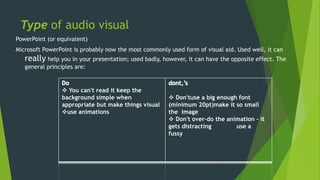


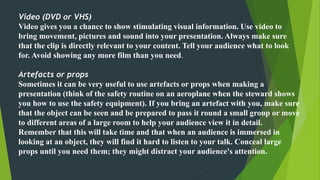

Graphic materials are visual images used to inform, illustrate or entertain. They include photographs, drawings, diagrams, graphs and more. There are several types of graphics commonly used for instruction like drawings, charts, diagrams and graphs. Audiovisual materials refer to works with both sound and visual components, and are widely used in education. Examples include PowerPoint presentations, videos, and interactive whiteboards. Audiovisual materials are important teaching tools as they help arouse learner interest, provide a clear view of concepts, guide learning, and enhance comprehension compared to only verbal instruction.


