Downloaded 80 times


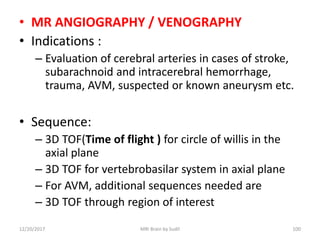
![Indications Of MRI
• Multiple Sclerosis (MS)
• Primary Tumor Assessment and / or Metastatic disease.
• AIDS (toxoplasmosis)
• Infarction [ Cerebral Vascular Accident (CVA) vs.
transient Ischaemic Attack (TIA) ]
• Hemorrhage
• Hearing Loss
• Visual Disturbances
• Infection trauma
• Unexplained Neurological Symptoms or deficit
• Mapping of brain function](https://image.slidesharecdn.com/normalmribrain-150112010842-conversion-gate02-171220190000/85/Normalmribrain-150112010842-conversion-gate02-10-320.jpg)


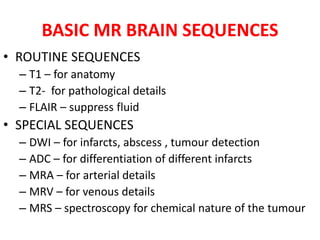
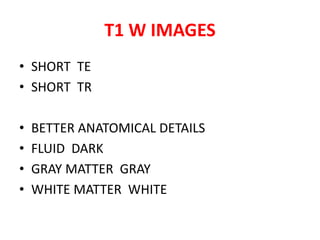
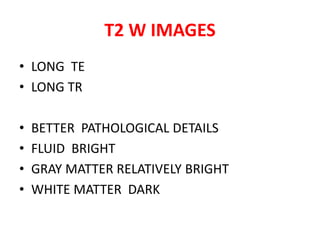

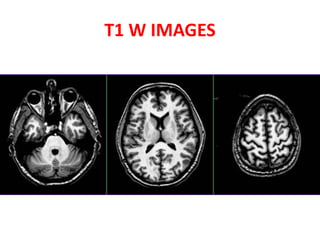
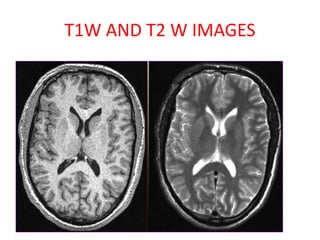

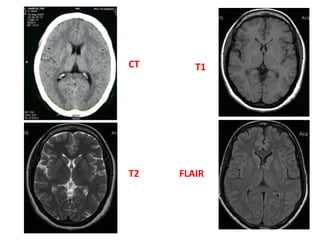

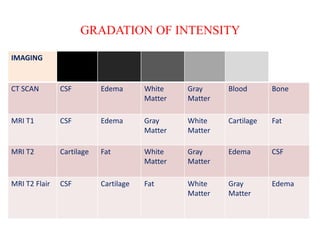
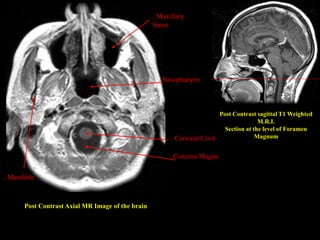
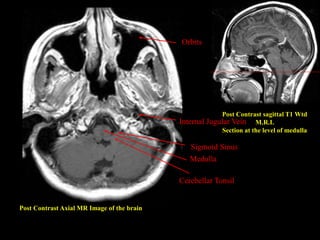
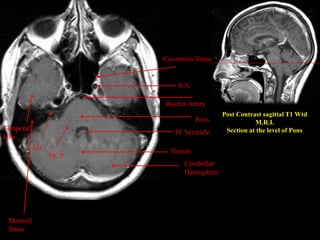
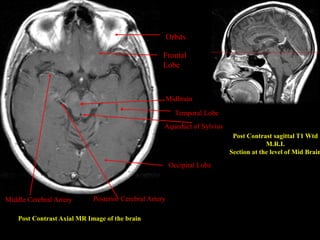
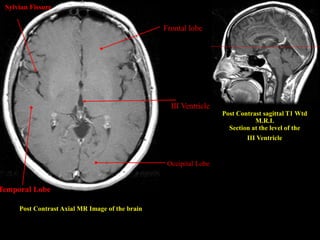
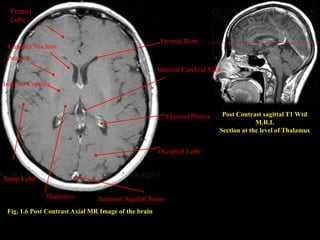
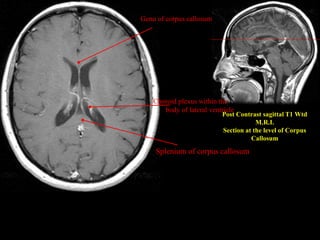
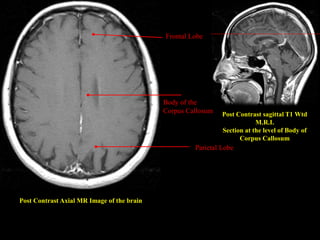
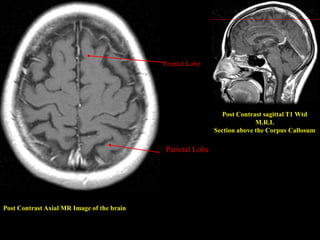
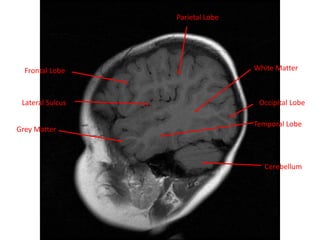
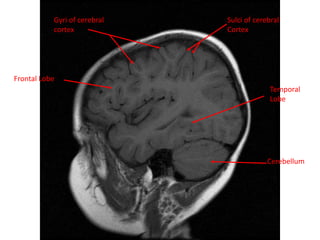
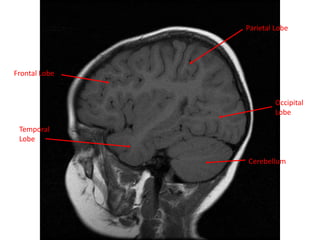
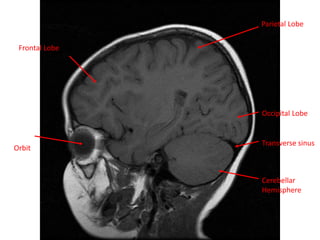
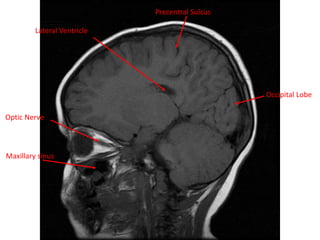
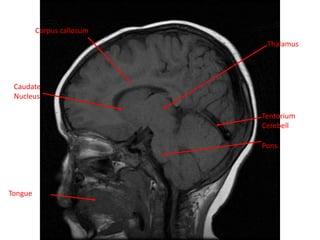
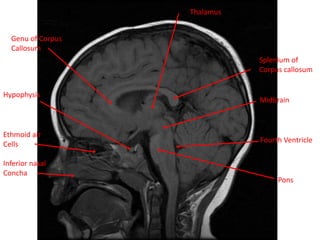
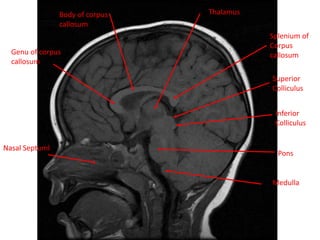
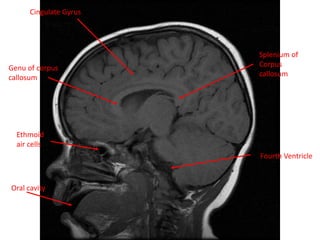
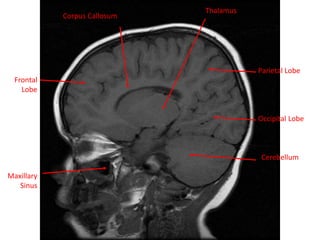
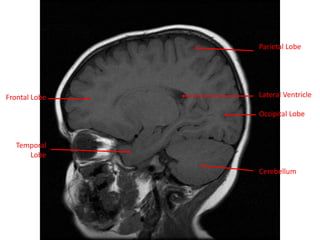
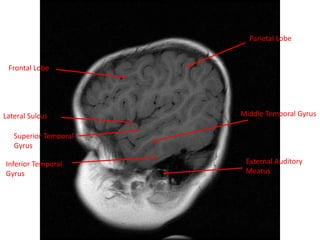
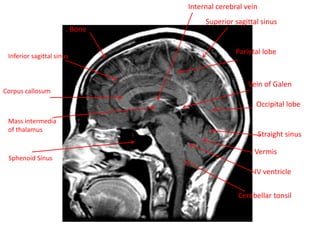
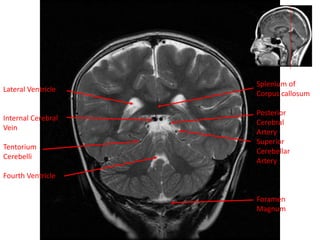
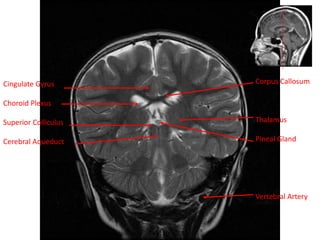
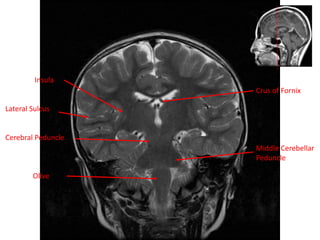
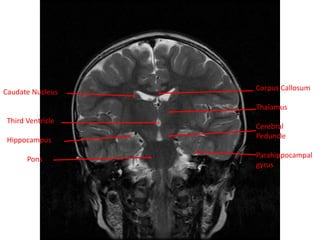
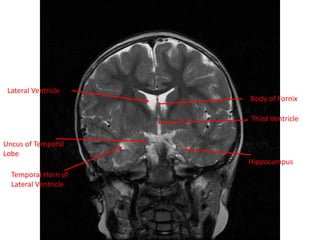
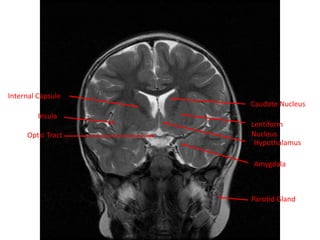
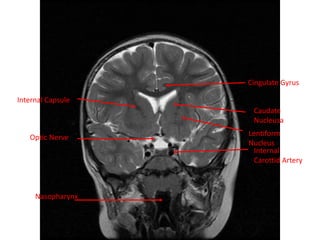
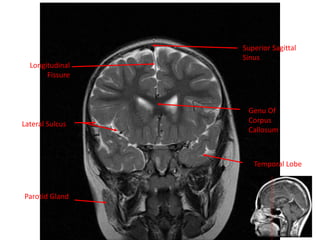
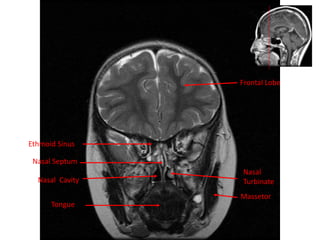
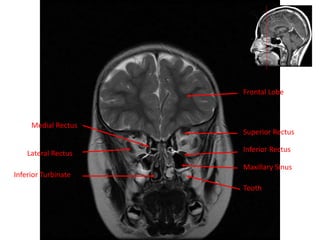
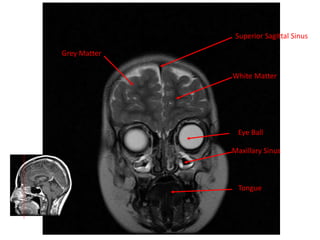
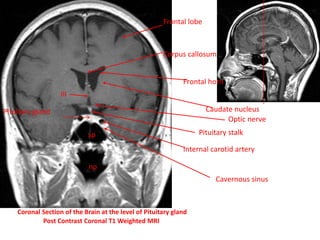


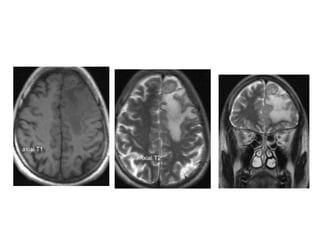


1. MRI uses magnetic fields and radio waves to produce detailed images of the internal structures of the body without using ionizing radiation. It is useful for evaluating abnormalities in the brain such as tumors, infections, hemorrhages, and more. 2. Different MRI sequences such as T1-weighted, T2-weighted, and FLAIR provide contrast between tissues that is useful for identifying various pathologies. T1-weighted images show good anatomical detail while T2-weighted and FLAIR images are better for detecting pathologies. 3. MRI of the brain can be obtained in axial, sagittal, and coronal planes to visualize structures from different orientations without moving the patient. Key anatomical


