Downloaded 1,541 times


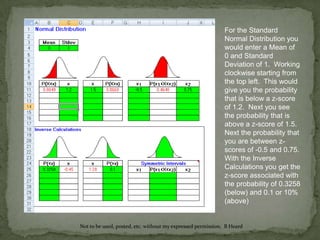


This document provides instructions for using an Excel template to solve problems involving the normal distribution. It discusses using the template to find probabilities related to the heights of 12-year-old boys, which are normally distributed with a mean of 64 inches and standard deviation of 5 inches. The template can also be used to find z-scores for the standard normal distribution. Practice with examples is recommended to learn to properly use the template.