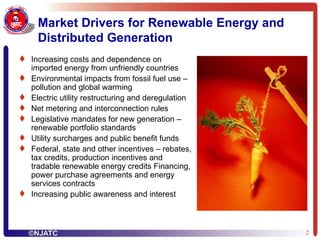
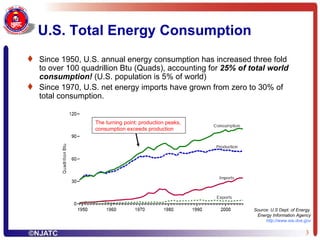
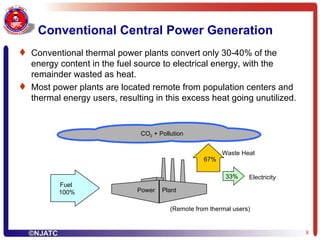
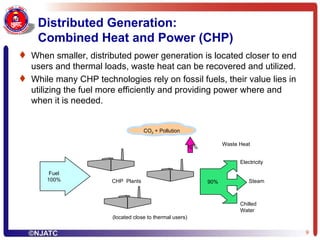
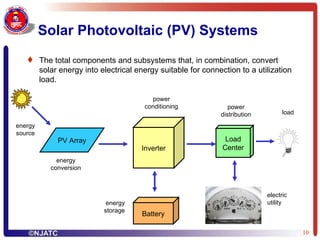
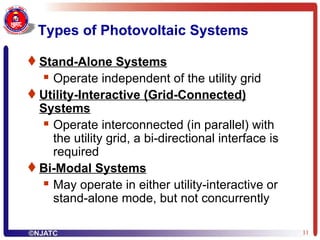
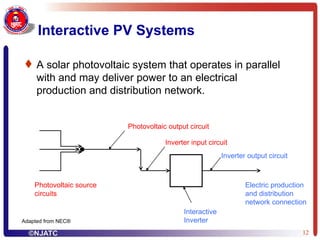
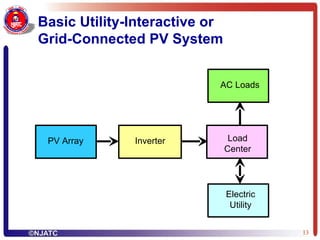
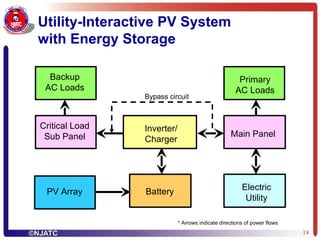
The document discusses the growing market for solar photovoltaics and distributed generation due to factors such as rising energy costs, environmental concerns, and policy incentives. It provides statistics on U.S. energy consumption trends and the contribution of renewables. The remainder outlines the basics of photovoltaic systems and components, incentives for installations, industry partnerships for training, and some of the largest photovoltaic projects completed in the U.S.
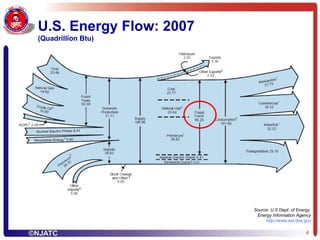
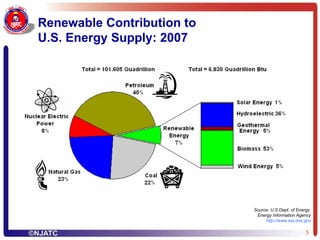
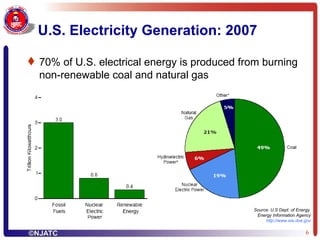
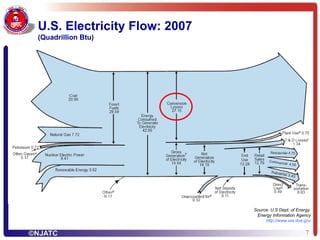
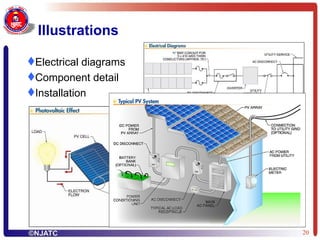
![NJATC Solar Industry Training Partners Sharp Electronics World’s leading PV module manufacturer www.sharp-usa.com/solar Sunwize Technologies Largest U.S. distributor of PV products www.sunwize.com Contact: David Love, 888-870-9493 [email_address]](https://image.slidesharecdn.com/njatcpvpowerpointactenaae-1229213805139128-1/85/Njatc-Pv-Powerpoint-Acte-Naae-29-320.jpg)

![Contact Information Jim Dunlop, NJATC Curriculum Specialist 321-704-1097 [email_address] Presentation Downloads: http:// www.njatc.org / http://www.farm-energy.ca/IReF/ Bill Ball, NJATC Dir. of Inside Curriculum: 812-853-3564 [email_address]](https://image.slidesharecdn.com/njatcpvpowerpointactenaae-1229213805139128-1/85/Njatc-Pv-Powerpoint-Acte-Naae-53-320.jpg)


![The importance of using multiple text sets in[1]](https://cdn.slidesharecdn.com/ss_thumbnails/theimportanceofusingmultipletextsetsin1-101127183557-phpapp01-thumbnail.jpg?width=640&height=640&fit=bounds)


