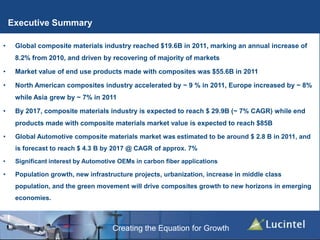
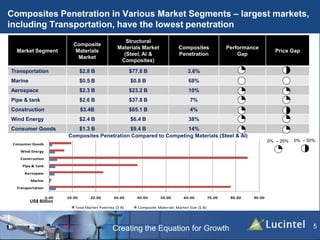
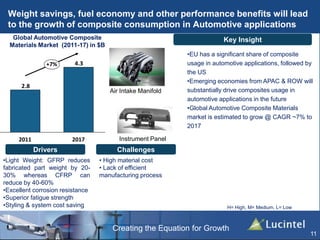
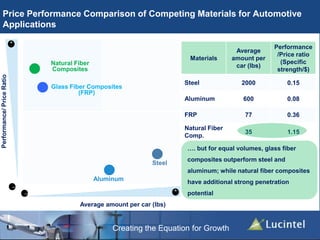
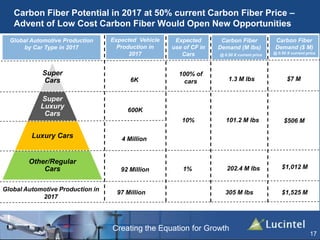
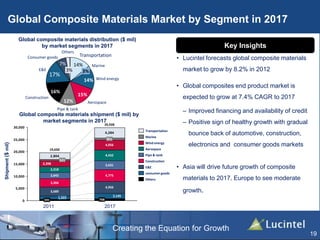
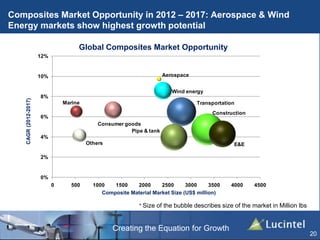
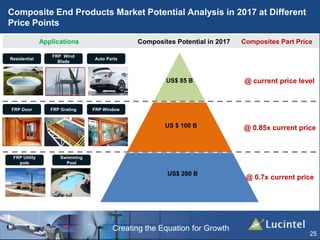
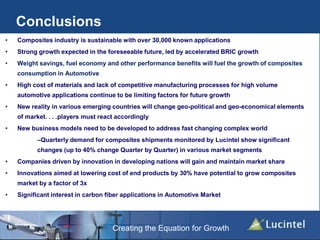
Growth Opportunities in Global
Composites Industry, 2012 – 2017
Chuck Kazmierski
Program Manager, Lucintel
www.acmashow.org
February 21-23, 2012  Mandalay Bay Convention Center, LasVegas, NV
Creating the Equation for Growth
2
Today’s Agenda
• Executive Summary
• Composites Market Analysis
• Opportunity in Automotive Market
• Growth Opportunities in 2012 and Beyond
• Conclusions
• About Lucintel
Creating the Equation for Growth
Executive Summary
• Global composite materials industry reached $19.6B in 2011, marking an annual increase of
8.2% from 2010, and driven by recovering of majority of markets
• Market value of end use products made with composites was $55.6B in 2011
• North American composites industry accelerated by ~ 9 % in 2011, Europe increased by ~ 8%
while Asia grew by ~ 7% in 2011
• By 2017, composite materials industry is expected to reach $ 29.9B (~ 7% CAGR) while end
products made with composite materials market value is expected to reach $85B
• Global Automotive composite materials market was estimated to be around $ 2.8 B in 2011, and
is forecast to reach $ 4.3 B by 2017 @ CAGR of approx. 7%
• Significant interest by Automotive OEMs in carbon fiber applications
• Population growth, new infrastructure projects, urbanization, increase in middle class
population, and the green movement will drive composites growth to new horizons in emerging
economies.
Creating the Equation for Growth
4
Today’s Agenda
• Executive Summary
• Composites Market Analysis
• Opportunity in Automotive Market
• Growth Opportunities in 2012 and Beyond
• Conclusions
• About Lucintel
Creating the Equation for Growth
Composites Penetration in Various Market Segments – largest markets,
including Transportation, have the lowest penetration
5
Market Segment
Composite
Materials
Market
Structural
Materials Market
(Steel, Al &
Composites)
Composites
Penetration
Performance
Gap
Price Gap
Transportation $2.8 B $77.8 B 3.6%
Marine $0.5 B $0.8 B 68%
Aerospace $2.3 B $23.2 B 10%
Pipe & tank $2.6 B $37.8 B 7%
Construction $3.4B $85.1 B 4%
Wind Energy $2.4 B $6.4 B 38%
Consumer Goods $1.3 B $9.4 B 14%
0% – 25% 0% – 50%
0.00 10.00 20.00 30.00 40.00 50.00 60.00 70.00 80.00 90.00
Transportation
Marine
Aerospace
Pipe & tank
Construction
Wind Energy
Consumer Goods
Total Market Potentia ($ B) Composite Materials Market Size ($ B)
Composites Penetration Compared to Competing Materials (Steel & Al)
US$ Billion
Creating the Equation for Growth
Regional Composites Market Trend: 2006-2011
Key Insights
• Composites industry has seen large
fluctuations in various markets during the
last 5 years due to economic recession
• Composites industry performed poorly
compared to GDP during the last 5 years,
however the composites industry is
forecast to grow at a higher rate than GDP
over the next 5 years
0
1000
2000
3000
4000
5000
6000
7000
2006 2007 2008 2009 2010 2011
Shipmentin$Million
Composites Shipment Trend(2006-2011) in
Various Regionin$ Million
North America
Europe
Asia
ROW
0.0
5000.0
10000.0
15000.0
20000.0
25000.0
2006 2007 2008 2009 2010 2011
GDPin$Billion
GDP Trend(2006-2011) inVarious Regions
North America
Europe
Asia
ROW
Creating the Equation for Growth
11%
Developed
Countries
89%
40%
BRIC nations
Developed
Countries
60%
As developing countries play a larger role in the global economy, their
presence in composites manufacturing is also increasing
7
BRIC nations
2000 2011
• Developing nations (defined as
BRIC) have substantially increased
their participation in the global
economy
• Developing nations overall have
taken a strong role in global
composites production
• Further BRIC increases are not a
matter of whether they will happen,
but when and by how much
GDP
Composites
Production
GDP
Developed
Countries
BRIC Nations
53%
Key Insights
19%
81%
37%
63%
Developed
Countries
BRIC
Nations
Creating the Equation for Growth
Market potential in various countries in 2011 – developed countries
have a much larger composite consumption per capita
8
BRIC Mega Trends
Rapid Growth
Rapid Urbanization
Emerging Middle Class
Global Connectivity
Increased OEM Production
Rising Costs
Potential Challenges
Asset Bubbles/Loose Credit
Political Instability
United States
China
Japan
Germany
France
UK
Italy
India
Brazil
Russia
-5
0
5
10
15
20
25
-20000 0 20000 40000 60000
CompositeVolumePerCapita($/Capita)(2011)
GDPPerCapita US$ (2011)
Composite Potential by Country (2011)
Note: Bubble size represents total composites consumption in respective countries
Creating the Equation for Growth
9
Today’s Agenda
• Executive Summary
• Composites Market Analysis
• Opportunity in Automotive Market
• Growth Opportunities in 2012 and Beyond
• Conclusions
• About Lucintel
Creating the Equation for Growth
Composites in Automotive
10
Key InsightsBody Panels/
Parts
Key Composites
Materials
Key Manufacturing
Processes
Interior Headliners
Polyurethane,
LWRT
RIM, Injection molding
Air Intake Manifold SFT Injection molding
Front End Carriers LFT, SMC
Injection molding,
Compression Molding
Bumper Beams
GMT, SMC,
Polyurethane
Injection molding,
Compression Molding,
RIM
Fenders SMC, LCM Compression Molding
Hoods SMC, LCM Compression Molding
Applications
• Global Automotive composites material market
was worth $ 2.8 B in 2011
• Glass-fiber-reinforced polymer composites
(SMC, GMT, etc.) are cost effective in volume
around 100K per annum due to low tooling cost
• High cost of materials and lack of suitable
manufacturing processes for high volume
applications continue to be limiting factors for
future growth
• Carbon fiber usage will remain limited to high
end & premium segment cars
• Advent of lower cost carbon fiber could open a
new era for composites in high-volume
applications
Front BumperHood panelsRoofChassis Leaf Spring
Creating the Equation for Growth
Weight savings, fuel economy and other performance benefits will lead
to the growth of composite consumption in Automotive applications
11
Global Automotive Composite
Materials Market (2011-17) in $B
4.3
2.8
2011 2017
+7%
Key Insight
•EU has a significant share of composite
usage in automotive applications, followed by
the US
•Emerging economies from APAC & ROW will
substantially drive composites usage in
automotive applications in the future
•Global Automotive Composite Materials
market is estimated to grow @ CAGR ~7% to
2017
H= High, M= Medium, L= Low
Air Intake Manifold
Instrument Panel
Drivers Challenges
•Light Weight: GFRP reduces
fabricated part weight by 20-
30% whereas CFRP can
reduce by 40-60%
•Excellent corrosion resistance
•Superior fatigue strength
•Styling & system cost saving
• High material cost
• Lack of efficient
manufacturing process
Creating the Equation for Growth
Price Performance Comparison of Competing Materials for Automotive
Applications
–
+
Performance/PriceRatio
Average amount per car (lbs)
Steel
–
Aluminum
Glass Fiber Composites
(FRP)
Natural Fiber
Composites
Materials
Average
amount per
car (lbs)
Performance
/Price ratio
(Strength/$)
Steel 2000 1.1
Aluminum 600 0.2
FRP 77 0.7
Natural Fiber
Comp.
35 1.5
While taking into consideration the
density of steel, its relative performance
compares well to composites . . . .
+
Creating the Equation for Growth
Price Performance Comparison of Competing Materials for Automotive
Applications
–
+
Performance/PriceRatio
Average amount per car (lbs)
Steel
–
Aluminum
Glass Fiber Composites
(FRP)
Natural Fiber
Composites
Materials
Average
amount per
car (lbs)
Performance
/Price ratio
(Specific
strength/$)
Steel 2000 0.15
Aluminum 600 0.08
FRP 77 0.36
Natural Fiber
Comp.
35 1.15
…. but for equal volumes, glass fiber
composites outperform steel and
aluminum; while natural fiber composites
have additional strong penetration
potential
+
Creating the Equation for Growth
Emerging applications will be a driving factor in the growth of
Composites in the Automotive Market
14
Application OEM-Model
Composites
Type
Driver for Use of
Composites
Launch
Year
Roof Compartment Cover,
Trunk Lid
BMW M6 Convertible Glass Composites Weight Reduction 2013
Wheel Rims
Daimler Smart’s Third-
Generation Electric Drive
Glass Composites
Light Weight, Stunning
Look
2012
Instrument Panel, Inner
Door Modules
Land Rover – Evoque Glass Composites
Light Weight & Fuel
Economy
2011-12
Engine-mounted Oil-filter
Module
Chrysler Pentastar
Engines
Glass Composites
Thermal Requirements for
Cooling-System
Components
2010-11
Door Module
Faurecia’s Jeep Liberty
SUV
Glass Composites Weight Reduction 2010
air-intake manifold system
General Motors V6
Engine
Glass Composites Weight Saving , Better
Acoustic Performance
2010
air-intake manifold system Volkswagen Gasoline
Engines
Glass Composites
Weight Saving , Better
Acoustic Performance
2009-10
Fluid Filter Module Daimler AGT- Mercedes Glass Composites
38% Weight and 16% Cost
Reductions
2009-10
Creating the Equation for Growth
Increased Interest in Carbon Fiber by Automotive OEMs will significantly
drive the growth of the Composites Industry over the next 10 Years
15
Application OEM-Model
Composites
Type
Driver for Use
of Composites
Launch
Year
Composite Passenger Cell BMW i3 Carbon Composites Light Weight 2013
Car Roof McLaren MP4-12C Spider Carbon Composites Light Weight 2013
Car Roof BMW M6 Coupe Carbon Composites Light Weight 2012
Body Aerodynamics Kit Callaway Corvette RPO B2K Carbon Composites Light Weight 2012
Cabin Frame, Floor Panel, Roof
Pillars, Hood, Transmission
Tunnel, and Rear Floor
Lexus LFA Carbon Composites Light Weight 2012
Body Aerodynamics Kit Lamborghini Aventador
LP700-4 LE-C
Carbon Composites Light Weight 2012
Front and Rear Bumpers,
Bumper Grilles, Side Skirts, and
Mirror Covers
Lamborghini Aventador
LP700-4 Carbon Composites Light Weight 2012
Panels on Interior Door
Lamborghini Murcielago
SP670-4 SV Twin Turbo
Carbon Composites
Light Weight,
Stunning Look
2012
Front & Rear Fenders, Trunk Lid
and Door Sills
Aston Martin V12 Zagato Carbon Composites Light Weight 2012
Creating the Equation for Growth
Joint ventures with Carbon Fiber Suppliers by Automotive OEM’s to
drive innovation and fuel economy
16
Carbon Fiber Supplier Toray
Company Daimler
Year 2011
Type Joint Venture
Description Manufacturing of automotive CFRP parts
Carbon Fiber Supplier SGL Carbon
Company BMW
Year 2010
Type Joint Venture
Description Manufacturing of automotive CFRP parts
Carbon Fiber Supplier SGL Carbon
Company Volkswagen
Year 2011
Type SGL Stake Acquisition
Description VW bought 8% stake in SGL Carbon
Carbon Fiber Supplier Toho Tenax
Company General Motors
Year 2011
Type Partnership
Description Co-develop technology to improve fuel economy
Creating the Equation for Growth
Carbon Fiber Potential in 2017 at 50% current Carbon Fiber Price –
Advent of Low Cost Carbon Fiber Would Open New Opportunities
Super
Cars
Super
Luxury
Cars
Luxury Cars
Other/Regular
Cars
6K
600K
4 Million
92 Million
Global Automotive Production in
2017
Expected
use of CF in
Cars
Expected Vehicle
Production in
2017
Carbon Fiber
Demand (M lbs)
@ 0.50 X current price
100% of
cars
10%
1%
Global Automotive Production
by Car Type in 2017
1.3 M lbs
202.4 M lbs
97 Million
101.2 M lbs
305 M lbs
17
Carbon Fiber
Demand ($ M)
@ 0.50 X current price
$7 M
$506 M
$1,012 M
$1,525 M
Creating the Equation for Growth
18
Today’s Agenda
• Executive Summary
• Composites Market Analysis
• Opportunity in Automotive Market
• Growth Opportunities in 2012 and Beyond
• Conclusions
• About Lucintel
Creating the Equation for Growth
Global Composite Materials Market by Segment in 2017
19
14%
Transportation
3%
Marine
14% Wind energy
15%
Aerospace12%
Pipe & tank
16%
Construction
17%
E&E
7%
Consumer goods
3%
Others
Global composite materials distribution ($ mil)
by market segments in 2017
2,804
4,284
0
5,000
10,000
15,000
20,000
25,000
30,000
2,398
2,318
2,642
521
4,775
4,956
2,145
798
29,928
Transportation
Marine
Wind energy
Aerospace
4,432
4,056
851
19,650
591
1,322
3,689
3,366
3,631
Pipe & tank
Construction
E&E
consumer goods
Others
Shipment($mil)
Global composite materials shipment ($ mil) by
market segments in 2017
• Lucintel forecasts global composite materials
market to grow by 8.2% in 2012
• Global composites end product market is
expected to grow at 7.4% CAGR to 2017
– Improved financing and availability of credit
– Positive sign of healthy growth with gradual
bounce back of automotive, construction,
electronics and consumer goods markets
• Asia will drive future growth of composite
materials to 2017. Europe to see moderate
growth.
2011 2017
Key Insights
Creating the Equation for Growth
Composites Market Opportunity in 2012 – 2017: Aerospace & Wind
Energy markets show highest growth potential
20
* Size of the bubble describes size of the market in Million lbs
TransportationMarine
Wind energy
Aerospace
Pipe & tank
Construction
E&E
Consumer goods
Others
0%
2%
4%
6%
8%
10%
12%
0 500 1000 1500 2000 2500 3000 3500 4000 4500
Global Composites Market Opportunity
CAGR(2012-2017)
Composite Material Market Size (US$ million)
Creating the Equation for Growth
• Attractiveness comparison is analyzed among different market segments of the same region
• Attractiveness is analyzed by taking different parameters such as current and future market
potentials
Relative Market Attractiveness by Region: Aerospace and Wind
Energy Segments show most attractive markets for growth
21
Market Segment North
America
Europe Asia Rest of World
Transportation
Marine
Aerospace
Pipe & tank
Construction
Wind
Consumer
Goods
High Medium Low- Medium Low No
Creating the Equation for Growth
US Wind Energy market improved in 2011, cumulative installations
grew by more than 30% over 2010
22
Challenges as overall wind market in Current
Scenario
• Slow growth in energy demand has a multiplier effect on new
capacity projects which are 50% renewable
• Fall of natural gas prices affecting wind competitiveness
• Connectivity issues impacting new projects
• Lack of robust long term federal targets for renewable energy
continues to impact investor confidence and credit availability
• State level RPS targets are main driver
Solutions
• Demand to grow with renewed economic vigor with
EIA forecasting 2% CAGR in next 5 years for overall
demand in energy
• Forecast 7% CAGR in natural gas prices in 5 yrs
• Texas is leading way to new connectivity
• Political support for renewable energy expected to
remain
Forecast of cumulative wind capacity installation (MW) - 2011-2017
46,990
2011
112,098
2017
+16%
Creating the Equation for Growth
Why Wind: Even in highly developed wind markets such as Germany,
penetration relative to potential is low, while larger markets such as the US
have very low penetration levels
23
Key Insights
+
–
Windenergypotential
30%
+
–
15%
Percentage of wind energy penetration vs. potential
• Both the US and China show strong
potential and low current penetration
• Russia has high potential but current
share of wind is <1 percent due to
availability of alternate energy sources
• PROFINA program is expected to drive
wind power sector in Brazil, targeting
5,000 MW installation by 2015
• Germany, widely considered a leading
economy in adopting wind energy, is
currently at 30% penetration
Germany India
Mexico
South Africa
Indonesia
USA
China
Russia
Brazil
Creating the Equation for Growth
Wind Market Insights: increasing blade length requires better blade
design, improved blade materials, lower process and life cycle cost
Current Focus areas for Wind blades
• Design:
• Improved Aerofoil design for better load
distribution across the blade cross section
area which increases reliability and
performance
• Improved Materials:
• With increasing length, need for higher
strength-to-weight ratio material
• Mixture of fiber glass and carbon fiber to
improve the stiffness and tensile strength
in the fiber direction
• Process:
• Process improvement to reduce total
production time
• Lower Life cycle cost:
• Improved reliability
• Reduced manufacturing cost
• Lower operation and maintenance cost
Lower life
cycle cost
with
increased
power output
Design
Process
Improved
materials
24
Creating the Equation for Growth
Applications Composites Potential in 2017 Composites Part Price
@ current price level
@ 0.85x current price
@ 0.7x current price
Composite End Products Market Potential Analysis in 2017 at Different
Price Points
25
FRP Utility
pole
Swimming
Pool
FRP WindowFRP GratingFRP Door
Auto Parts
FRP Wind
Blade
Residential
US$ 85 B
US $ 100 B
US$ 260 B
Creating the Equation for Growth
26
Today’s Agenda
• Executive Summary
• Composites Market Analysis
• Opportunity in Automotive Market
• Growth Opportunities in 2012 and Beyond
• Conclusions
• About Lucintel
Creating the Equation for Growth
Conclusions
• Composites industry is sustainable with over 30,000 known applications
• Strong growth expected in the foreseeable future, led by accelerated BRIC growth
• Weight savings, fuel economy and other performance benefits will fuel the growth of composites
consumption in Automotive
• High cost of materials and lack of competitive manufacturing processes for high volume
automotive applications continue to be limiting factors for future growth
• New reality in various emerging countries will change geo-political and geo-economical elements
of market. . . .players must react accordingly
• New business models need to be developed to address fast changing complex world
–Quarterly demand for composites shipments monitored by Lucintel show significant
changes (up to 40% change Quarter by Quarter) in various market segments
• Companies driven by innovation in developing nations will gain and maintain market share
• Innovations aimed at lowering cost of end products by 30% have potential to grow composites
market by a factor of 3x
• Significant interest in carbon fiber applications in Automotive Market
Creating the Equation for Growth
28
Today’s Agenda
• Executive Summary
• Composites Market Analysis
• Opportunity in Automotive Market
• Growth Opportunities in 2012 and Beyond
• Conclusions
• About Lucintel
Creating the Equation for Growth
29
Lucintel is the leading global management consulting & market
research firm.
Lucintel creates your equation for growth and is committed to
actionable results that deliver significant value and long term growth
to our clients.
Lucintel has been creating measurable value for over 10 years and
for more than thousands of clients in 70 + countries worldwide.
Visit http://www.lucintel.com/imovie/ for a short 3.5-minute movie on
Lucintel solutions.
About Lucintel
Creating the Equation for Growth
Steve Parker
VP, Sales (Market Report), USA
Email: steve.parker@lucintel.com
Cell: +1-214-213-2491
Roy Almaguer
Global Sales Manager, USA
Email: roy.almaguer@lucintel.com
Tel: +1-210-878-7693 (Office)
Alan Clark
VP, Sales (Consulting), UK
Email: alan.clark@lucintel.com
Tel :+44 (0) 7875 708825
Nigel Odea
Business Development Manager, UK
Email: nigel.odea@lucintel.com
Cell: +44 (0) 207 558 8798
Reach Lucintel
For your future business information requirements and cutting edge consulting
solutions, contact Lucintel at helpdesk@Lucintel.com or Tel. +1-972-636-5056 for
further detail or to discuss your project opportunity.
30
ThankYou
Creating the Equation for Growth
Lucintel has published +100 multi-client market reports & conducted
hundreds of consulting projects across multiple markets
32
Aerospace
Transportation
Marine
Construction
Renewable Energy
Recreational
Composite Materials
Market Reports Consulting
Strategic Growth Consulting
Benchmarking
Opportunity Screening
Partner Search and Evaluation
M & A
Market Entry Strategy
Creating the Equation for Growth
. . . with Project Teams with an appropriate mix between technical
and business expertise for results that drive the bottom line
Senior level consultants and analysts
PhDs and MBAs
Masters level engineers
Scientists and Industry experts
Past projects ranging from start up to multi-national Fortune 500
companies.
33
Creating the Equation for Growth
Lucintel’s Unique Capability for Your Project
Lucintel offers following benefits for your project:
• No Learning Curve - Deep industry knowledge and insight
• Quality, Accuracy & Depth
• Speed to Market - Time Savings
• Cost Savings
• Neutral Third Party Position for better market info access and interpretation
Continuous networking with whole value chain including customers, suppliers
and competitors
Access to vital, hard to find insights through detailed primary and secondary
research and analysis. Incomparable data accuracy and integrity
34
Creating the Equation for Growth
Lucintel has an extensive toolkit to address key strategic questions
for increasing your company’s profitability and market presence
35
Market
Opportunities
Market
Entry
Voice of
Customer
Product
Benchmark
Procureme
nt
Optimizatio
n
M&A
Plant
Optimizatio
n
Opportunity
Screening
• Is market space / opportunity of current
product offerings sufficiently robust?
• Market is focus for many: how can my
company profitably differentiate?
• Based on our core skills, where should
we focus?
• Should we build or buy? Is build even an
option?
• What game changer actions exist and/or
is a more incremental approach best?
• What is the order sequence of market
entry segments / products?
Key Questions
Creating the Equation for Growth
Clients around the world value our services
36
Creating the Equation for Growth
Here is What Our Customers Say:
From our work with demanding customers like 3M, Carlyle, Dow Chemical, Henkel,
Airbus, here are a few glowing statements from our customers:
“We found great value in Lucintel’s work, both from a commercial and technology
standpoint. Lucintel helped us better align our products with the needs of the
market.”
Genaro Gutierrez, PhD, Business Dev. Manager – Dow Chemical
“We bought the Lucintel market report because it is the best report about our
industry…a complete and appropriate analysis.“
Cesare Andrenacci, V.P. – Ferretti Group
“The insights we gained from Lucintel’s work helped us with our future business
plan…a wonderful professional job…”
Mike Jackson, Stahlin
“Lucintel has its finger on the pulse of the market and drives deep Strategic Insight”
Andy Schmidt, MacQuarie Partners, Managing Partner
37
Creating the Equation for Growth
38
THANK YOU!

Lucintel globalcompositemarketanalysis-acma2012-educationalsession

  • 1.
    Growth Opportunities inGlobal Composites Industry, 2012 – 2017 Chuck Kazmierski Program Manager, Lucintel www.acmashow.org February 21-23, 2012  Mandalay Bay Convention Center, LasVegas, NV
  • 2.
    Creating the Equationfor Growth 2 Today’s Agenda • Executive Summary • Composites Market Analysis • Opportunity in Automotive Market • Growth Opportunities in 2012 and Beyond • Conclusions • About Lucintel
  • 3.
    Creating the Equationfor Growth Executive Summary • Global composite materials industry reached $19.6B in 2011, marking an annual increase of 8.2% from 2010, and driven by recovering of majority of markets • Market value of end use products made with composites was $55.6B in 2011 • North American composites industry accelerated by ~ 9 % in 2011, Europe increased by ~ 8% while Asia grew by ~ 7% in 2011 • By 2017, composite materials industry is expected to reach $ 29.9B (~ 7% CAGR) while end products made with composite materials market value is expected to reach $85B • Global Automotive composite materials market was estimated to be around $ 2.8 B in 2011, and is forecast to reach $ 4.3 B by 2017 @ CAGR of approx. 7% • Significant interest by Automotive OEMs in carbon fiber applications • Population growth, new infrastructure projects, urbanization, increase in middle class population, and the green movement will drive composites growth to new horizons in emerging economies.
  • 4.
    Creating the Equationfor Growth 4 Today’s Agenda • Executive Summary • Composites Market Analysis • Opportunity in Automotive Market • Growth Opportunities in 2012 and Beyond • Conclusions • About Lucintel
  • 5.
    Creating the Equationfor Growth Composites Penetration in Various Market Segments – largest markets, including Transportation, have the lowest penetration 5 Market Segment Composite Materials Market Structural Materials Market (Steel, Al & Composites) Composites Penetration Performance Gap Price Gap Transportation $2.8 B $77.8 B 3.6% Marine $0.5 B $0.8 B 68% Aerospace $2.3 B $23.2 B 10% Pipe & tank $2.6 B $37.8 B 7% Construction $3.4B $85.1 B 4% Wind Energy $2.4 B $6.4 B 38% Consumer Goods $1.3 B $9.4 B 14% 0% – 25% 0% – 50% 0.00 10.00 20.00 30.00 40.00 50.00 60.00 70.00 80.00 90.00 Transportation Marine Aerospace Pipe & tank Construction Wind Energy Consumer Goods Total Market Potentia ($ B) Composite Materials Market Size ($ B) Composites Penetration Compared to Competing Materials (Steel & Al) US$ Billion
  • 6.
    Creating the Equationfor Growth Regional Composites Market Trend: 2006-2011 Key Insights • Composites industry has seen large fluctuations in various markets during the last 5 years due to economic recession • Composites industry performed poorly compared to GDP during the last 5 years, however the composites industry is forecast to grow at a higher rate than GDP over the next 5 years 0 1000 2000 3000 4000 5000 6000 7000 2006 2007 2008 2009 2010 2011 Shipmentin$Million Composites Shipment Trend(2006-2011) in Various Regionin$ Million North America Europe Asia ROW 0.0 5000.0 10000.0 15000.0 20000.0 25000.0 2006 2007 2008 2009 2010 2011 GDPin$Billion GDP Trend(2006-2011) inVarious Regions North America Europe Asia ROW
  • 7.
    Creating the Equationfor Growth 11% Developed Countries 89% 40% BRIC nations Developed Countries 60% As developing countries play a larger role in the global economy, their presence in composites manufacturing is also increasing 7 BRIC nations 2000 2011 • Developing nations (defined as BRIC) have substantially increased their participation in the global economy • Developing nations overall have taken a strong role in global composites production • Further BRIC increases are not a matter of whether they will happen, but when and by how much GDP Composites Production GDP Developed Countries BRIC Nations 53% Key Insights 19% 81% 37% 63% Developed Countries BRIC Nations
  • 8.
    Creating the Equationfor Growth Market potential in various countries in 2011 – developed countries have a much larger composite consumption per capita 8 BRIC Mega Trends Rapid Growth Rapid Urbanization Emerging Middle Class Global Connectivity Increased OEM Production Rising Costs Potential Challenges Asset Bubbles/Loose Credit Political Instability United States China Japan Germany France UK Italy India Brazil Russia -5 0 5 10 15 20 25 -20000 0 20000 40000 60000 CompositeVolumePerCapita($/Capita)(2011) GDPPerCapita US$ (2011) Composite Potential by Country (2011) Note: Bubble size represents total composites consumption in respective countries
  • 9.
    Creating the Equationfor Growth 9 Today’s Agenda • Executive Summary • Composites Market Analysis • Opportunity in Automotive Market • Growth Opportunities in 2012 and Beyond • Conclusions • About Lucintel
  • 10.
    Creating the Equationfor Growth Composites in Automotive 10 Key InsightsBody Panels/ Parts Key Composites Materials Key Manufacturing Processes Interior Headliners Polyurethane, LWRT RIM, Injection molding Air Intake Manifold SFT Injection molding Front End Carriers LFT, SMC Injection molding, Compression Molding Bumper Beams GMT, SMC, Polyurethane Injection molding, Compression Molding, RIM Fenders SMC, LCM Compression Molding Hoods SMC, LCM Compression Molding Applications • Global Automotive composites material market was worth $ 2.8 B in 2011 • Glass-fiber-reinforced polymer composites (SMC, GMT, etc.) are cost effective in volume around 100K per annum due to low tooling cost • High cost of materials and lack of suitable manufacturing processes for high volume applications continue to be limiting factors for future growth • Carbon fiber usage will remain limited to high end & premium segment cars • Advent of lower cost carbon fiber could open a new era for composites in high-volume applications Front BumperHood panelsRoofChassis Leaf Spring
  • 11.
    Creating the Equationfor Growth Weight savings, fuel economy and other performance benefits will lead to the growth of composite consumption in Automotive applications 11 Global Automotive Composite Materials Market (2011-17) in $B 4.3 2.8 2011 2017 +7% Key Insight •EU has a significant share of composite usage in automotive applications, followed by the US •Emerging economies from APAC & ROW will substantially drive composites usage in automotive applications in the future •Global Automotive Composite Materials market is estimated to grow @ CAGR ~7% to 2017 H= High, M= Medium, L= Low Air Intake Manifold Instrument Panel Drivers Challenges •Light Weight: GFRP reduces fabricated part weight by 20- 30% whereas CFRP can reduce by 40-60% •Excellent corrosion resistance •Superior fatigue strength •Styling & system cost saving • High material cost • Lack of efficient manufacturing process
  • 12.
    Creating the Equationfor Growth Price Performance Comparison of Competing Materials for Automotive Applications – + Performance/PriceRatio Average amount per car (lbs) Steel – Aluminum Glass Fiber Composites (FRP) Natural Fiber Composites Materials Average amount per car (lbs) Performance /Price ratio (Strength/$) Steel 2000 1.1 Aluminum 600 0.2 FRP 77 0.7 Natural Fiber Comp. 35 1.5 While taking into consideration the density of steel, its relative performance compares well to composites . . . . +
  • 13.
    Creating the Equationfor Growth Price Performance Comparison of Competing Materials for Automotive Applications – + Performance/PriceRatio Average amount per car (lbs) Steel – Aluminum Glass Fiber Composites (FRP) Natural Fiber Composites Materials Average amount per car (lbs) Performance /Price ratio (Specific strength/$) Steel 2000 0.15 Aluminum 600 0.08 FRP 77 0.36 Natural Fiber Comp. 35 1.15 …. but for equal volumes, glass fiber composites outperform steel and aluminum; while natural fiber composites have additional strong penetration potential +
  • 14.
    Creating the Equationfor Growth Emerging applications will be a driving factor in the growth of Composites in the Automotive Market 14 Application OEM-Model Composites Type Driver for Use of Composites Launch Year Roof Compartment Cover, Trunk Lid BMW M6 Convertible Glass Composites Weight Reduction 2013 Wheel Rims Daimler Smart’s Third- Generation Electric Drive Glass Composites Light Weight, Stunning Look 2012 Instrument Panel, Inner Door Modules Land Rover – Evoque Glass Composites Light Weight & Fuel Economy 2011-12 Engine-mounted Oil-filter Module Chrysler Pentastar Engines Glass Composites Thermal Requirements for Cooling-System Components 2010-11 Door Module Faurecia’s Jeep Liberty SUV Glass Composites Weight Reduction 2010 air-intake manifold system General Motors V6 Engine Glass Composites Weight Saving , Better Acoustic Performance 2010 air-intake manifold system Volkswagen Gasoline Engines Glass Composites Weight Saving , Better Acoustic Performance 2009-10 Fluid Filter Module Daimler AGT- Mercedes Glass Composites 38% Weight and 16% Cost Reductions 2009-10
  • 15.
    Creating the Equationfor Growth Increased Interest in Carbon Fiber by Automotive OEMs will significantly drive the growth of the Composites Industry over the next 10 Years 15 Application OEM-Model Composites Type Driver for Use of Composites Launch Year Composite Passenger Cell BMW i3 Carbon Composites Light Weight 2013 Car Roof McLaren MP4-12C Spider Carbon Composites Light Weight 2013 Car Roof BMW M6 Coupe Carbon Composites Light Weight 2012 Body Aerodynamics Kit Callaway Corvette RPO B2K Carbon Composites Light Weight 2012 Cabin Frame, Floor Panel, Roof Pillars, Hood, Transmission Tunnel, and Rear Floor Lexus LFA Carbon Composites Light Weight 2012 Body Aerodynamics Kit Lamborghini Aventador LP700-4 LE-C Carbon Composites Light Weight 2012 Front and Rear Bumpers, Bumper Grilles, Side Skirts, and Mirror Covers Lamborghini Aventador LP700-4 Carbon Composites Light Weight 2012 Panels on Interior Door Lamborghini Murcielago SP670-4 SV Twin Turbo Carbon Composites Light Weight, Stunning Look 2012 Front & Rear Fenders, Trunk Lid and Door Sills Aston Martin V12 Zagato Carbon Composites Light Weight 2012
  • 16.
    Creating the Equationfor Growth Joint ventures with Carbon Fiber Suppliers by Automotive OEM’s to drive innovation and fuel economy 16 Carbon Fiber Supplier Toray Company Daimler Year 2011 Type Joint Venture Description Manufacturing of automotive CFRP parts Carbon Fiber Supplier SGL Carbon Company BMW Year 2010 Type Joint Venture Description Manufacturing of automotive CFRP parts Carbon Fiber Supplier SGL Carbon Company Volkswagen Year 2011 Type SGL Stake Acquisition Description VW bought 8% stake in SGL Carbon Carbon Fiber Supplier Toho Tenax Company General Motors Year 2011 Type Partnership Description Co-develop technology to improve fuel economy
  • 17.
    Creating the Equationfor Growth Carbon Fiber Potential in 2017 at 50% current Carbon Fiber Price – Advent of Low Cost Carbon Fiber Would Open New Opportunities Super Cars Super Luxury Cars Luxury Cars Other/Regular Cars 6K 600K 4 Million 92 Million Global Automotive Production in 2017 Expected use of CF in Cars Expected Vehicle Production in 2017 Carbon Fiber Demand (M lbs) @ 0.50 X current price 100% of cars 10% 1% Global Automotive Production by Car Type in 2017 1.3 M lbs 202.4 M lbs 97 Million 101.2 M lbs 305 M lbs 17 Carbon Fiber Demand ($ M) @ 0.50 X current price $7 M $506 M $1,012 M $1,525 M
  • 18.
    Creating the Equationfor Growth 18 Today’s Agenda • Executive Summary • Composites Market Analysis • Opportunity in Automotive Market • Growth Opportunities in 2012 and Beyond • Conclusions • About Lucintel
  • 19.
    Creating the Equationfor Growth Global Composite Materials Market by Segment in 2017 19 14% Transportation 3% Marine 14% Wind energy 15% Aerospace12% Pipe & tank 16% Construction 17% E&E 7% Consumer goods 3% Others Global composite materials distribution ($ mil) by market segments in 2017 2,804 4,284 0 5,000 10,000 15,000 20,000 25,000 30,000 2,398 2,318 2,642 521 4,775 4,956 2,145 798 29,928 Transportation Marine Wind energy Aerospace 4,432 4,056 851 19,650 591 1,322 3,689 3,366 3,631 Pipe & tank Construction E&E consumer goods Others Shipment($mil) Global composite materials shipment ($ mil) by market segments in 2017 • Lucintel forecasts global composite materials market to grow by 8.2% in 2012 • Global composites end product market is expected to grow at 7.4% CAGR to 2017 – Improved financing and availability of credit – Positive sign of healthy growth with gradual bounce back of automotive, construction, electronics and consumer goods markets • Asia will drive future growth of composite materials to 2017. Europe to see moderate growth. 2011 2017 Key Insights
  • 20.
    Creating the Equationfor Growth Composites Market Opportunity in 2012 – 2017: Aerospace & Wind Energy markets show highest growth potential 20 * Size of the bubble describes size of the market in Million lbs TransportationMarine Wind energy Aerospace Pipe & tank Construction E&E Consumer goods Others 0% 2% 4% 6% 8% 10% 12% 0 500 1000 1500 2000 2500 3000 3500 4000 4500 Global Composites Market Opportunity CAGR(2012-2017) Composite Material Market Size (US$ million)
  • 21.
    Creating the Equationfor Growth • Attractiveness comparison is analyzed among different market segments of the same region • Attractiveness is analyzed by taking different parameters such as current and future market potentials Relative Market Attractiveness by Region: Aerospace and Wind Energy Segments show most attractive markets for growth 21 Market Segment North America Europe Asia Rest of World Transportation Marine Aerospace Pipe & tank Construction Wind Consumer Goods High Medium Low- Medium Low No
  • 22.
    Creating the Equationfor Growth US Wind Energy market improved in 2011, cumulative installations grew by more than 30% over 2010 22 Challenges as overall wind market in Current Scenario • Slow growth in energy demand has a multiplier effect on new capacity projects which are 50% renewable • Fall of natural gas prices affecting wind competitiveness • Connectivity issues impacting new projects • Lack of robust long term federal targets for renewable energy continues to impact investor confidence and credit availability • State level RPS targets are main driver Solutions • Demand to grow with renewed economic vigor with EIA forecasting 2% CAGR in next 5 years for overall demand in energy • Forecast 7% CAGR in natural gas prices in 5 yrs • Texas is leading way to new connectivity • Political support for renewable energy expected to remain Forecast of cumulative wind capacity installation (MW) - 2011-2017 46,990 2011 112,098 2017 +16%
  • 23.
    Creating the Equationfor Growth Why Wind: Even in highly developed wind markets such as Germany, penetration relative to potential is low, while larger markets such as the US have very low penetration levels 23 Key Insights + – Windenergypotential 30% + – 15% Percentage of wind energy penetration vs. potential • Both the US and China show strong potential and low current penetration • Russia has high potential but current share of wind is <1 percent due to availability of alternate energy sources • PROFINA program is expected to drive wind power sector in Brazil, targeting 5,000 MW installation by 2015 • Germany, widely considered a leading economy in adopting wind energy, is currently at 30% penetration Germany India Mexico South Africa Indonesia USA China Russia Brazil
  • 24.
    Creating the Equationfor Growth Wind Market Insights: increasing blade length requires better blade design, improved blade materials, lower process and life cycle cost Current Focus areas for Wind blades • Design: • Improved Aerofoil design for better load distribution across the blade cross section area which increases reliability and performance • Improved Materials: • With increasing length, need for higher strength-to-weight ratio material • Mixture of fiber glass and carbon fiber to improve the stiffness and tensile strength in the fiber direction • Process: • Process improvement to reduce total production time • Lower Life cycle cost: • Improved reliability • Reduced manufacturing cost • Lower operation and maintenance cost Lower life cycle cost with increased power output Design Process Improved materials 24
  • 25.
    Creating the Equationfor Growth Applications Composites Potential in 2017 Composites Part Price @ current price level @ 0.85x current price @ 0.7x current price Composite End Products Market Potential Analysis in 2017 at Different Price Points 25 FRP Utility pole Swimming Pool FRP WindowFRP GratingFRP Door Auto Parts FRP Wind Blade Residential US$ 85 B US $ 100 B US$ 260 B
  • 26.
    Creating the Equationfor Growth 26 Today’s Agenda • Executive Summary • Composites Market Analysis • Opportunity in Automotive Market • Growth Opportunities in 2012 and Beyond • Conclusions • About Lucintel
  • 27.
    Creating the Equationfor Growth Conclusions • Composites industry is sustainable with over 30,000 known applications • Strong growth expected in the foreseeable future, led by accelerated BRIC growth • Weight savings, fuel economy and other performance benefits will fuel the growth of composites consumption in Automotive • High cost of materials and lack of competitive manufacturing processes for high volume automotive applications continue to be limiting factors for future growth • New reality in various emerging countries will change geo-political and geo-economical elements of market. . . .players must react accordingly • New business models need to be developed to address fast changing complex world –Quarterly demand for composites shipments monitored by Lucintel show significant changes (up to 40% change Quarter by Quarter) in various market segments • Companies driven by innovation in developing nations will gain and maintain market share • Innovations aimed at lowering cost of end products by 30% have potential to grow composites market by a factor of 3x • Significant interest in carbon fiber applications in Automotive Market
  • 28.
    Creating the Equationfor Growth 28 Today’s Agenda • Executive Summary • Composites Market Analysis • Opportunity in Automotive Market • Growth Opportunities in 2012 and Beyond • Conclusions • About Lucintel
  • 29.
    Creating the Equationfor Growth 29 Lucintel is the leading global management consulting & market research firm. Lucintel creates your equation for growth and is committed to actionable results that deliver significant value and long term growth to our clients. Lucintel has been creating measurable value for over 10 years and for more than thousands of clients in 70 + countries worldwide. Visit http://www.lucintel.com/imovie/ for a short 3.5-minute movie on Lucintel solutions. About Lucintel
  • 30.
    Creating the Equationfor Growth Steve Parker VP, Sales (Market Report), USA Email: steve.parker@lucintel.com Cell: +1-214-213-2491 Roy Almaguer Global Sales Manager, USA Email: roy.almaguer@lucintel.com Tel: +1-210-878-7693 (Office) Alan Clark VP, Sales (Consulting), UK Email: alan.clark@lucintel.com Tel :+44 (0) 7875 708825 Nigel Odea Business Development Manager, UK Email: nigel.odea@lucintel.com Cell: +44 (0) 207 558 8798 Reach Lucintel For your future business information requirements and cutting edge consulting solutions, contact Lucintel at helpdesk@Lucintel.com or Tel. +1-972-636-5056 for further detail or to discuss your project opportunity. 30
  • 31.
  • 32.
    Creating the Equationfor Growth Lucintel has published +100 multi-client market reports & conducted hundreds of consulting projects across multiple markets 32 Aerospace Transportation Marine Construction Renewable Energy Recreational Composite Materials Market Reports Consulting Strategic Growth Consulting Benchmarking Opportunity Screening Partner Search and Evaluation M & A Market Entry Strategy
  • 33.
    Creating the Equationfor Growth . . . with Project Teams with an appropriate mix between technical and business expertise for results that drive the bottom line Senior level consultants and analysts PhDs and MBAs Masters level engineers Scientists and Industry experts Past projects ranging from start up to multi-national Fortune 500 companies. 33
  • 34.
    Creating the Equationfor Growth Lucintel’s Unique Capability for Your Project Lucintel offers following benefits for your project: • No Learning Curve - Deep industry knowledge and insight • Quality, Accuracy & Depth • Speed to Market - Time Savings • Cost Savings • Neutral Third Party Position for better market info access and interpretation Continuous networking with whole value chain including customers, suppliers and competitors Access to vital, hard to find insights through detailed primary and secondary research and analysis. Incomparable data accuracy and integrity 34
  • 35.
    Creating the Equationfor Growth Lucintel has an extensive toolkit to address key strategic questions for increasing your company’s profitability and market presence 35 Market Opportunities Market Entry Voice of Customer Product Benchmark Procureme nt Optimizatio n M&A Plant Optimizatio n Opportunity Screening • Is market space / opportunity of current product offerings sufficiently robust? • Market is focus for many: how can my company profitably differentiate? • Based on our core skills, where should we focus? • Should we build or buy? Is build even an option? • What game changer actions exist and/or is a more incremental approach best? • What is the order sequence of market entry segments / products? Key Questions
  • 36.
    Creating the Equationfor Growth Clients around the world value our services 36
  • 37.
    Creating the Equationfor Growth Here is What Our Customers Say: From our work with demanding customers like 3M, Carlyle, Dow Chemical, Henkel, Airbus, here are a few glowing statements from our customers: “We found great value in Lucintel’s work, both from a commercial and technology standpoint. Lucintel helped us better align our products with the needs of the market.” Genaro Gutierrez, PhD, Business Dev. Manager – Dow Chemical “We bought the Lucintel market report because it is the best report about our industry…a complete and appropriate analysis.“ Cesare Andrenacci, V.P. – Ferretti Group “The insights we gained from Lucintel’s work helped us with our future business plan…a wonderful professional job…” Mike Jackson, Stahlin “Lucintel has its finger on the pulse of the market and drives deep Strategic Insight” Andy Schmidt, MacQuarie Partners, Managing Partner 37
  • 38.
    Creating the Equationfor Growth 38 THANK YOU!