Download as PDF, PPTX
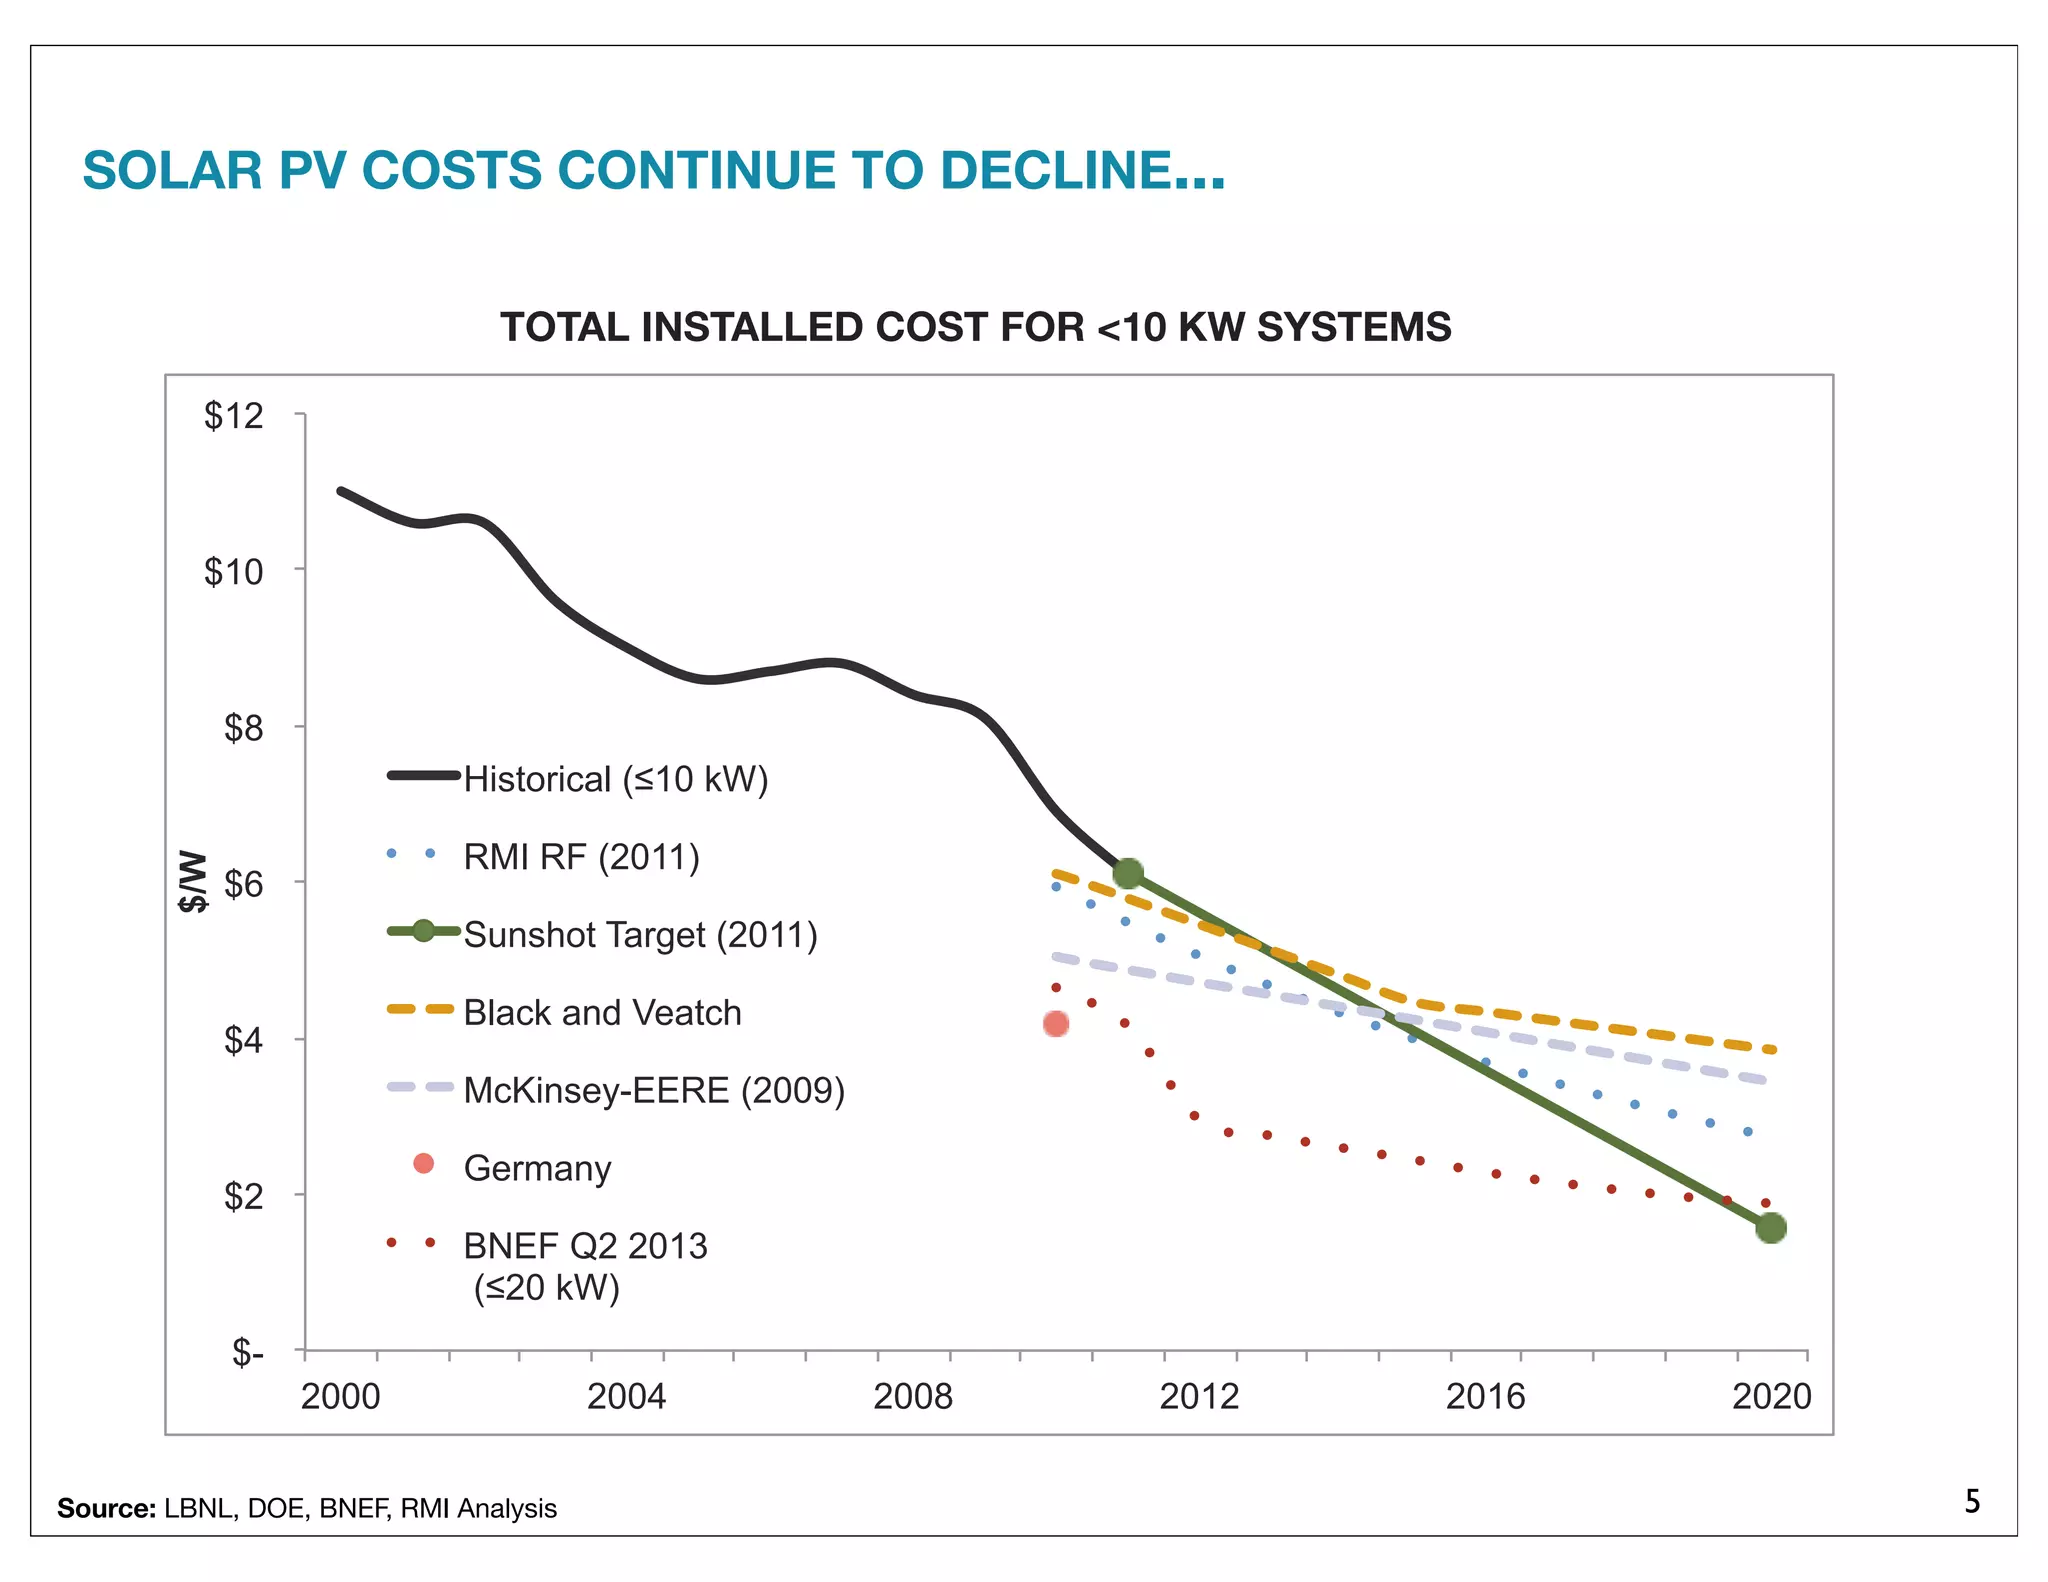
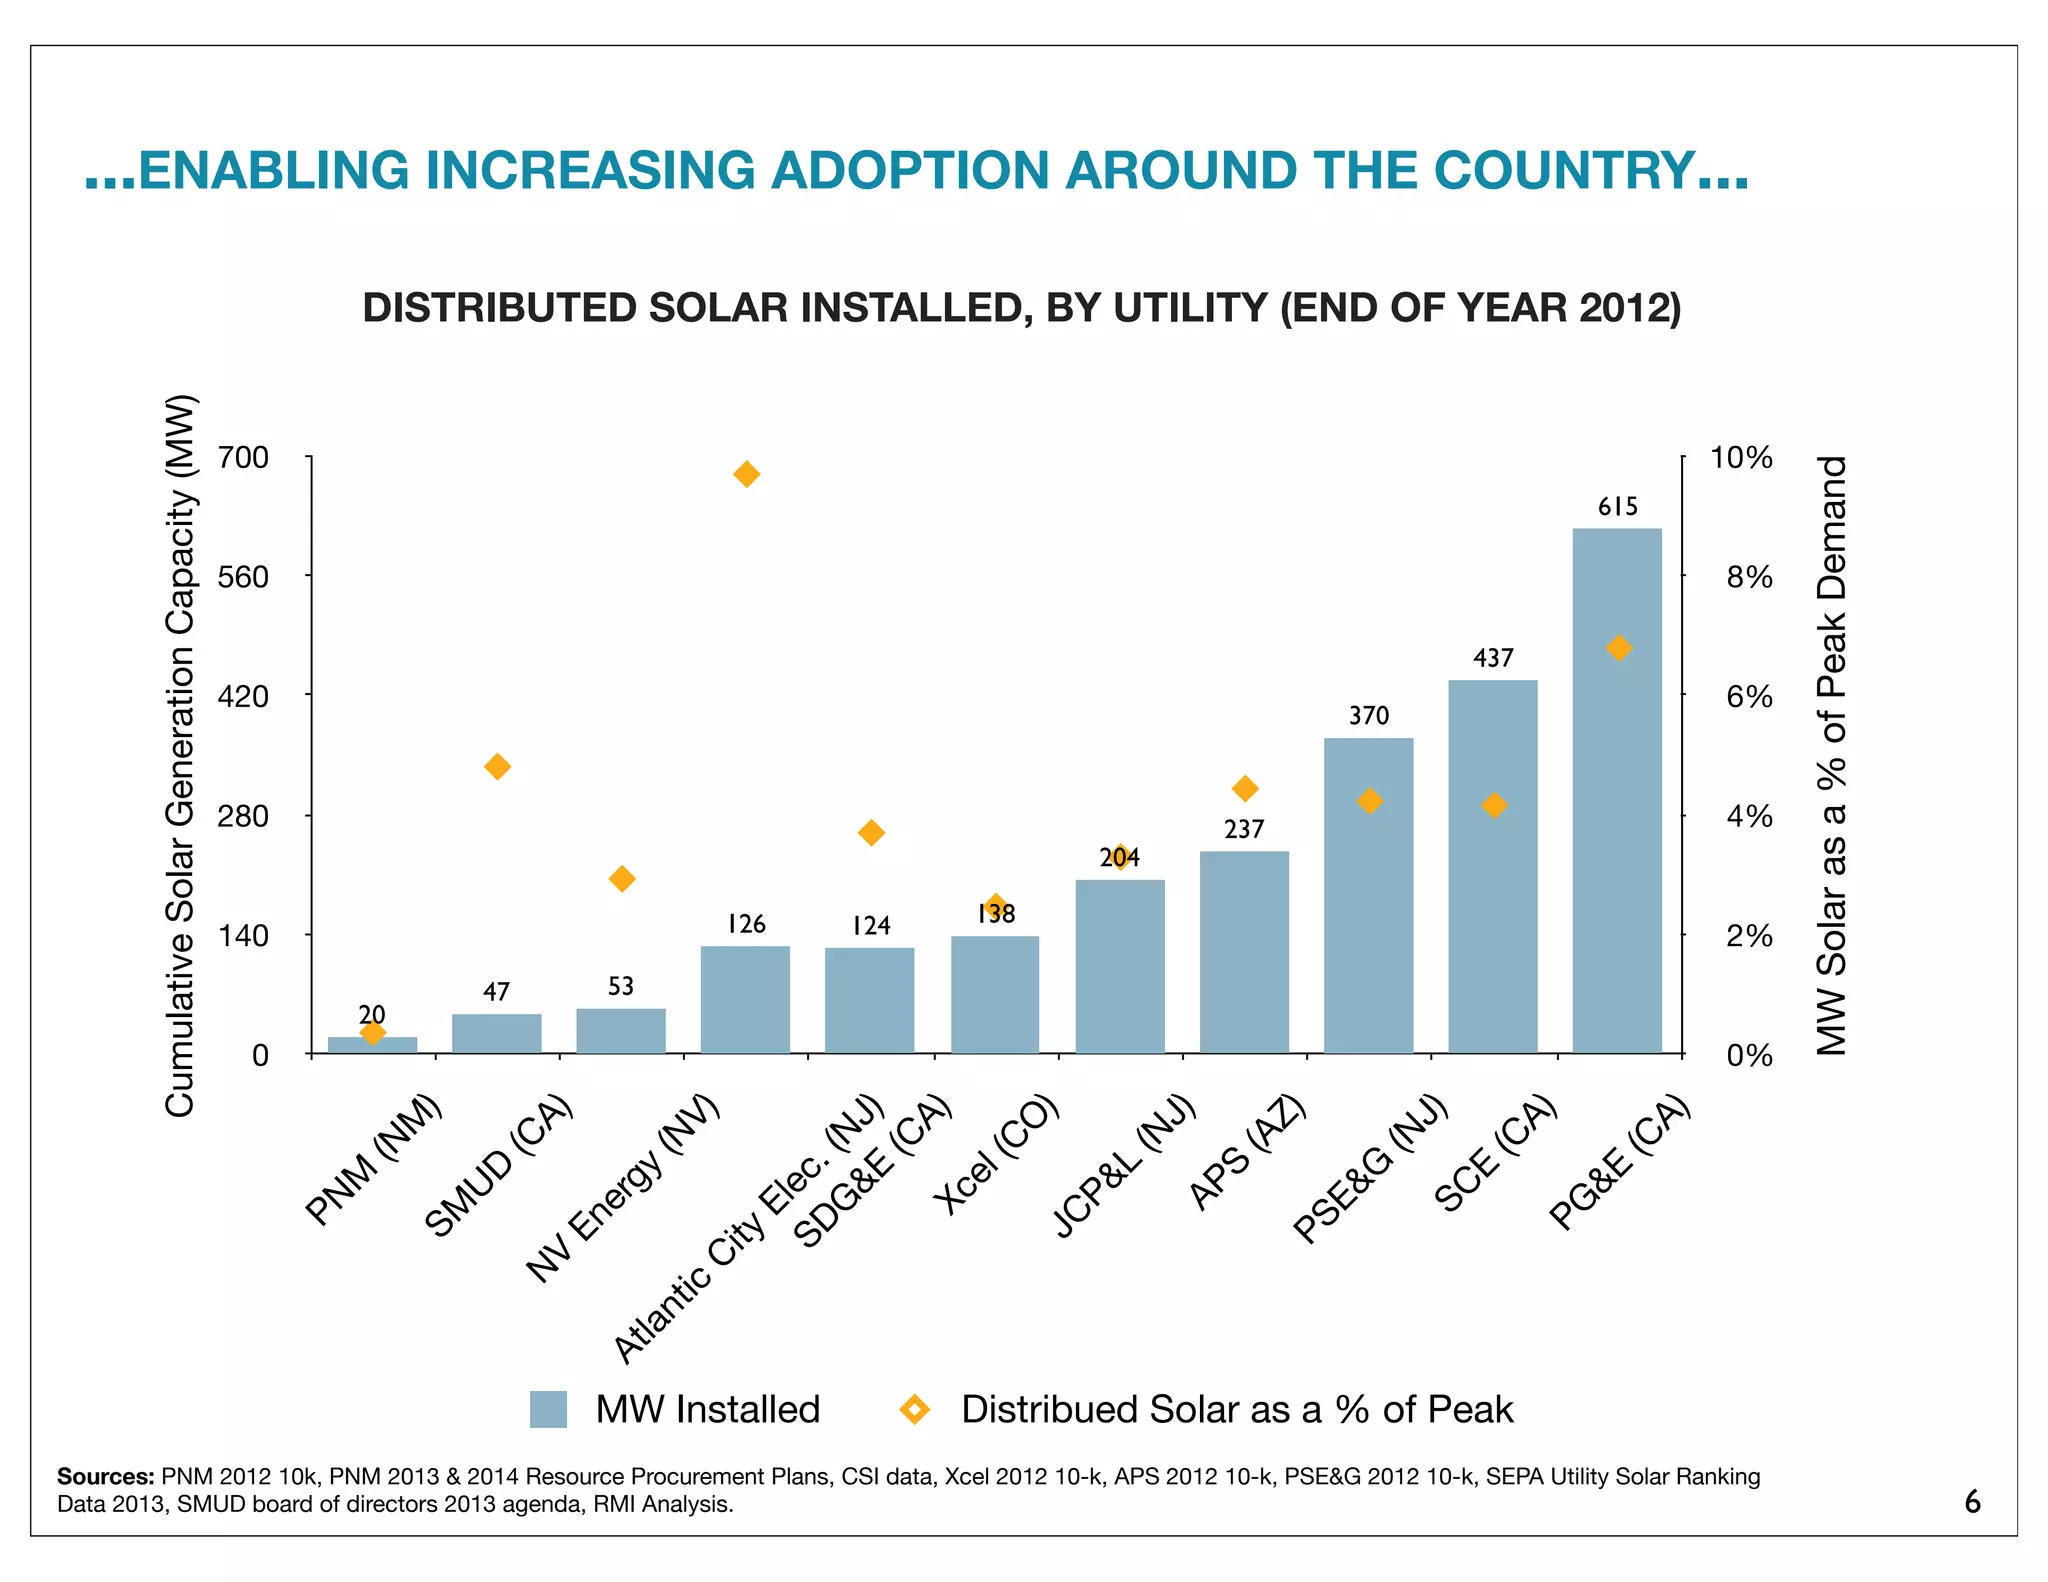
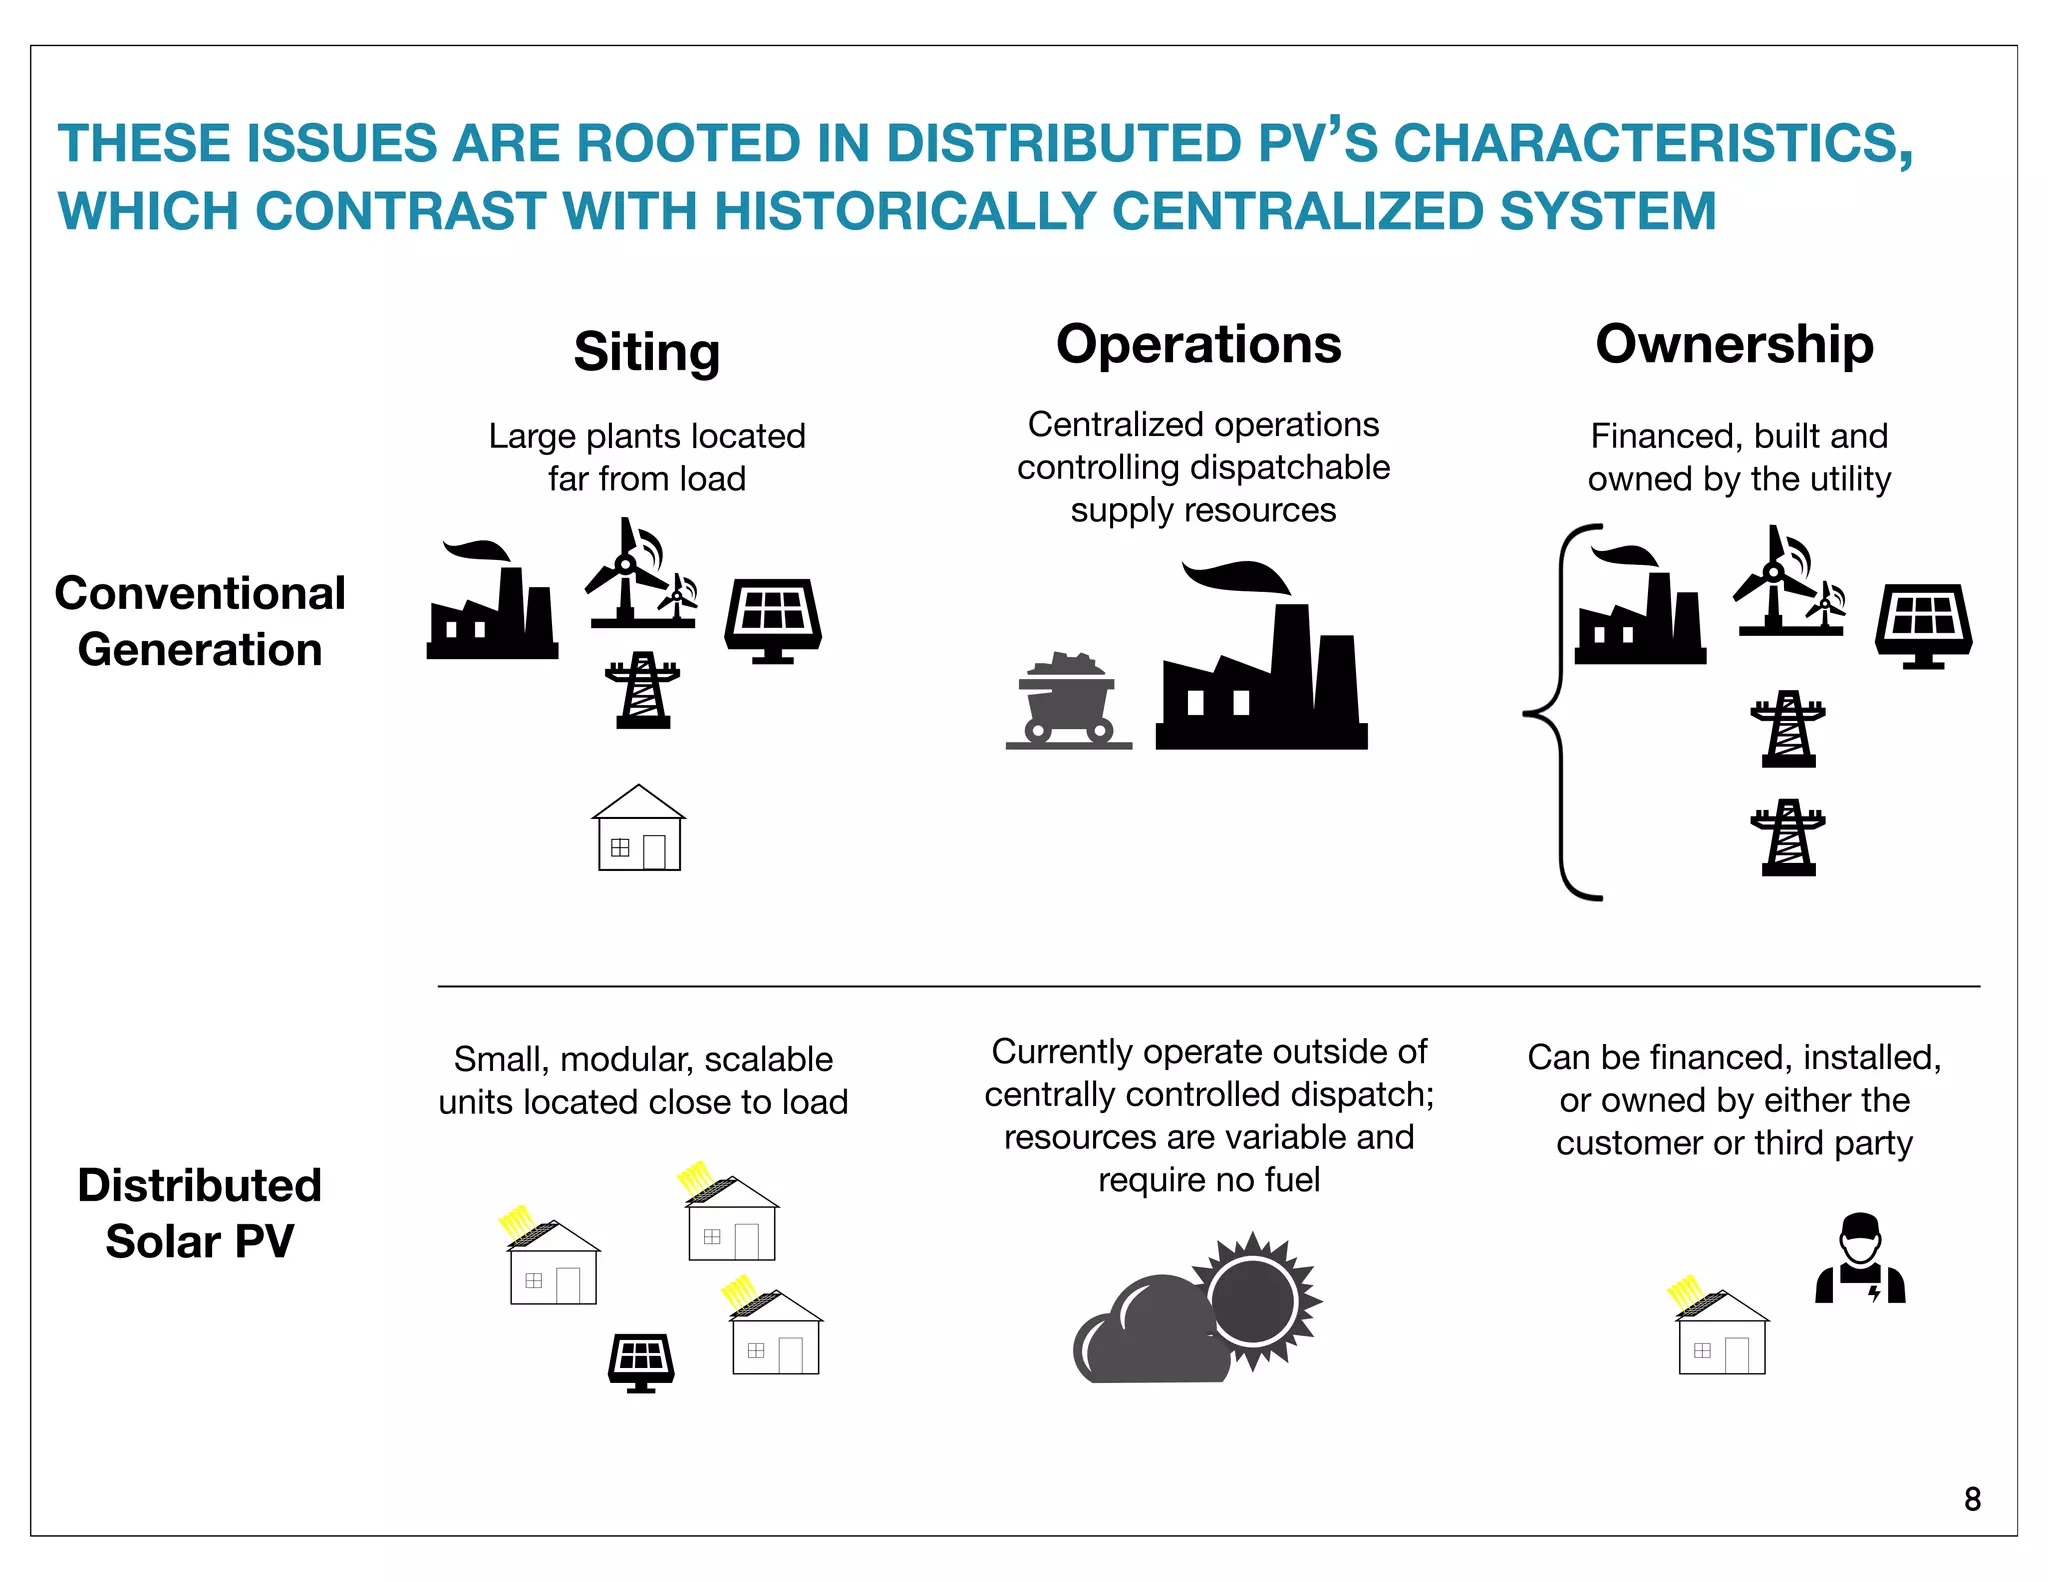
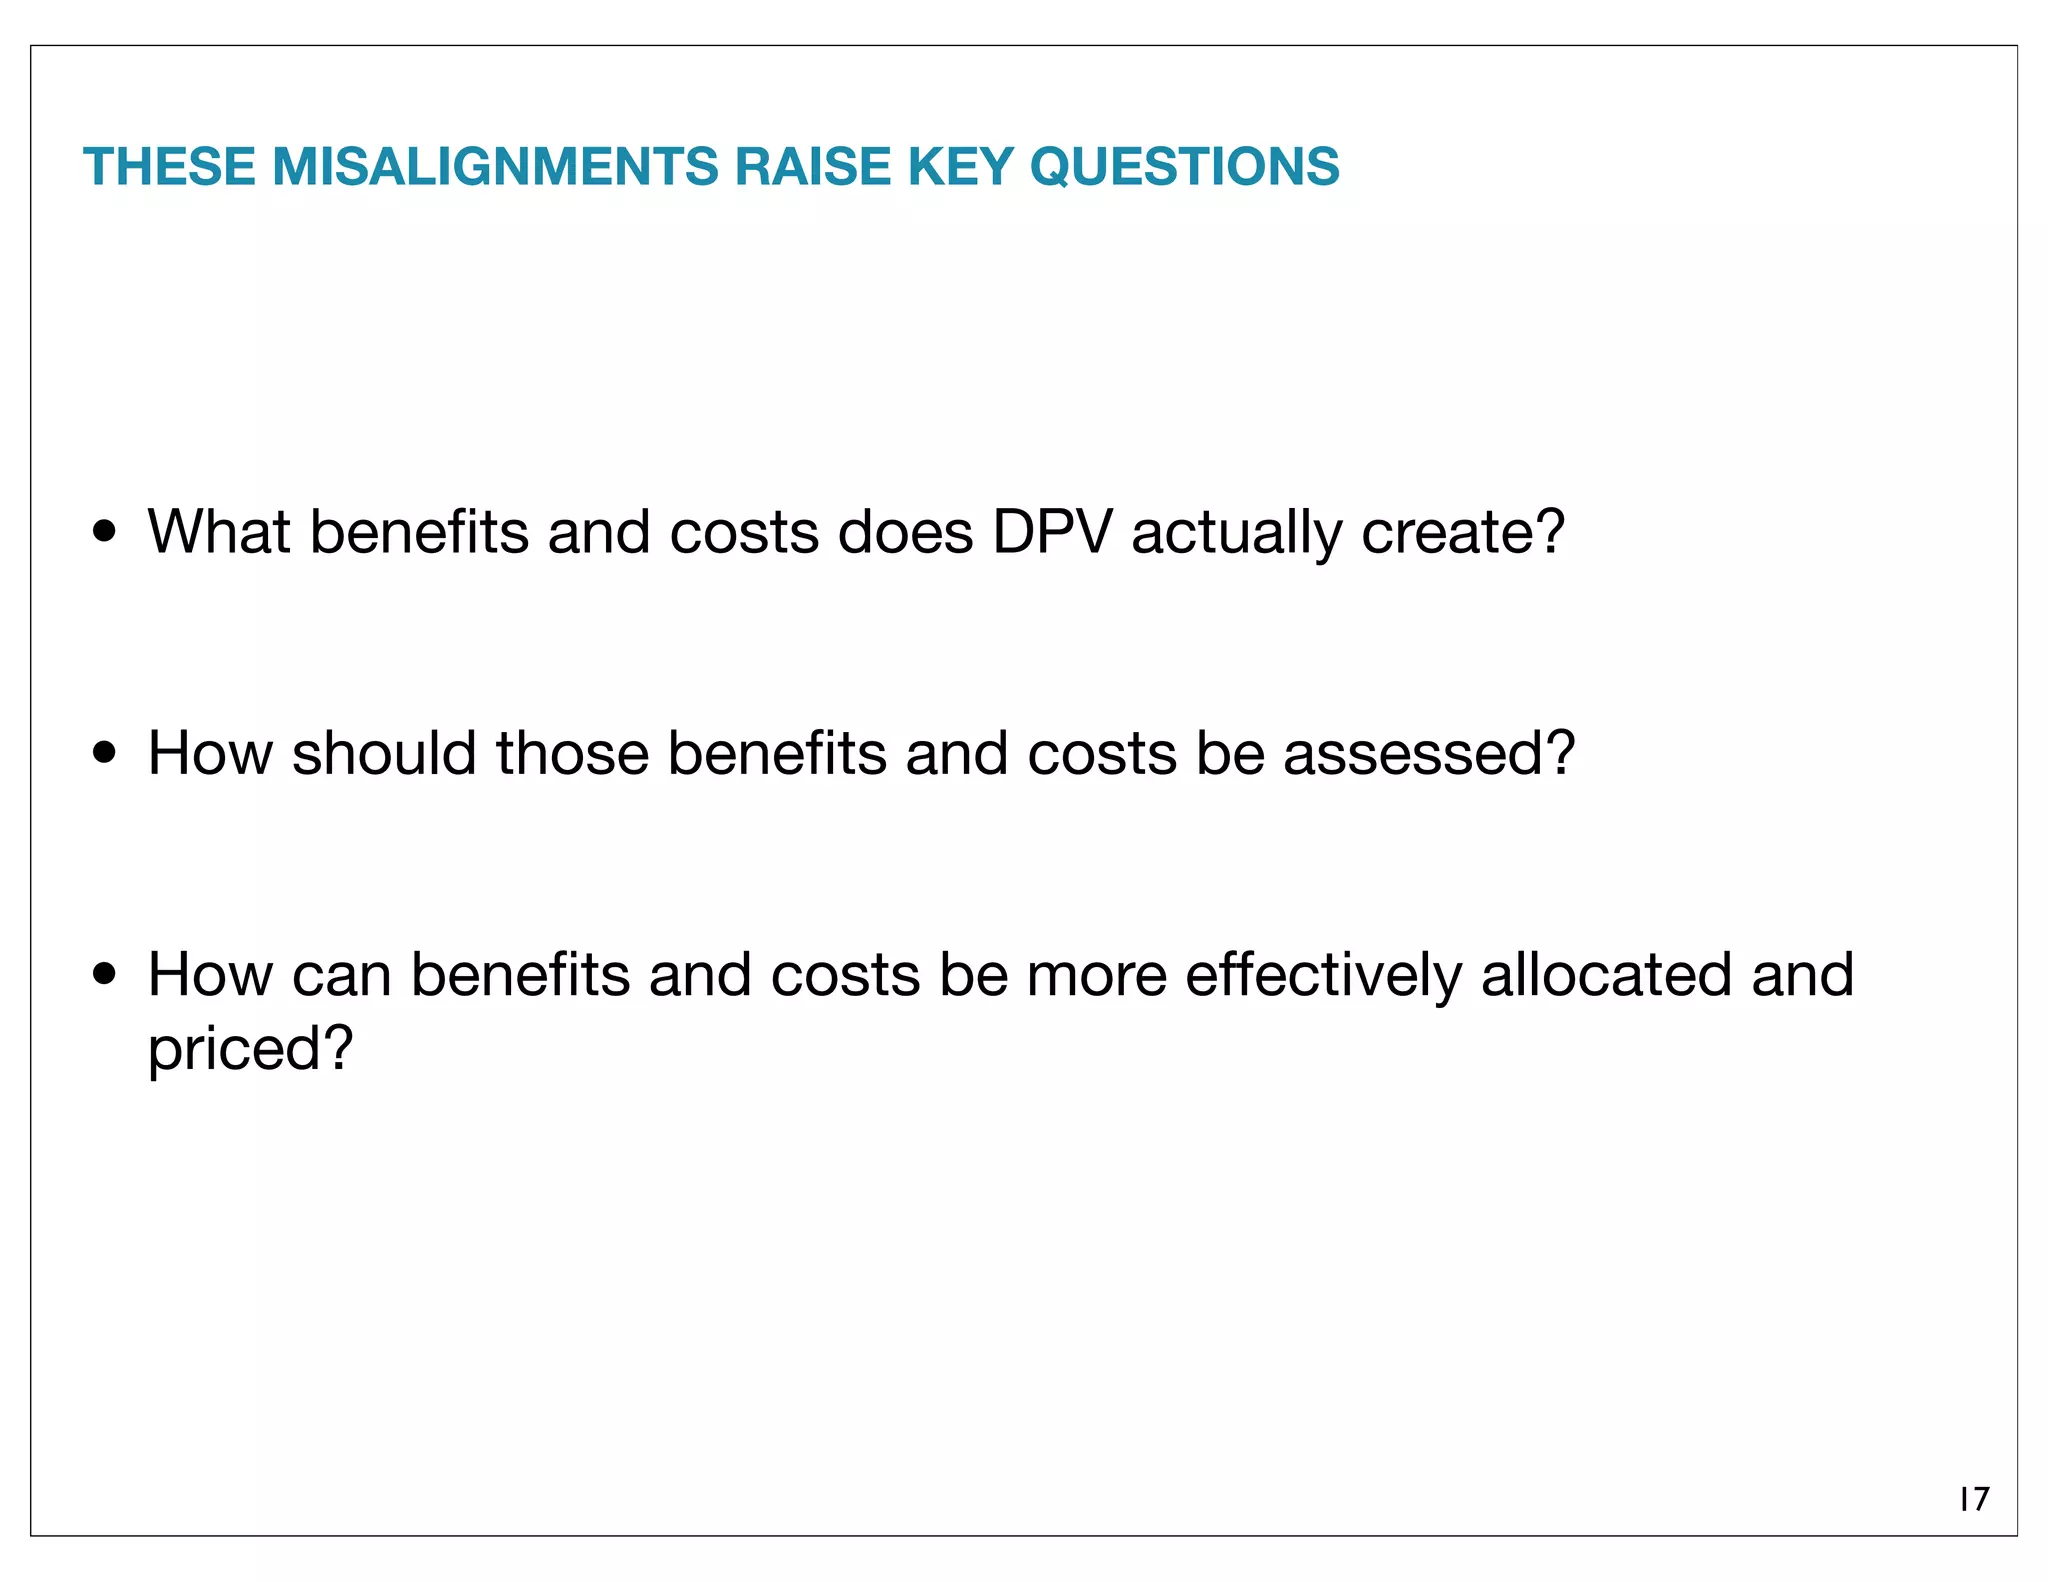

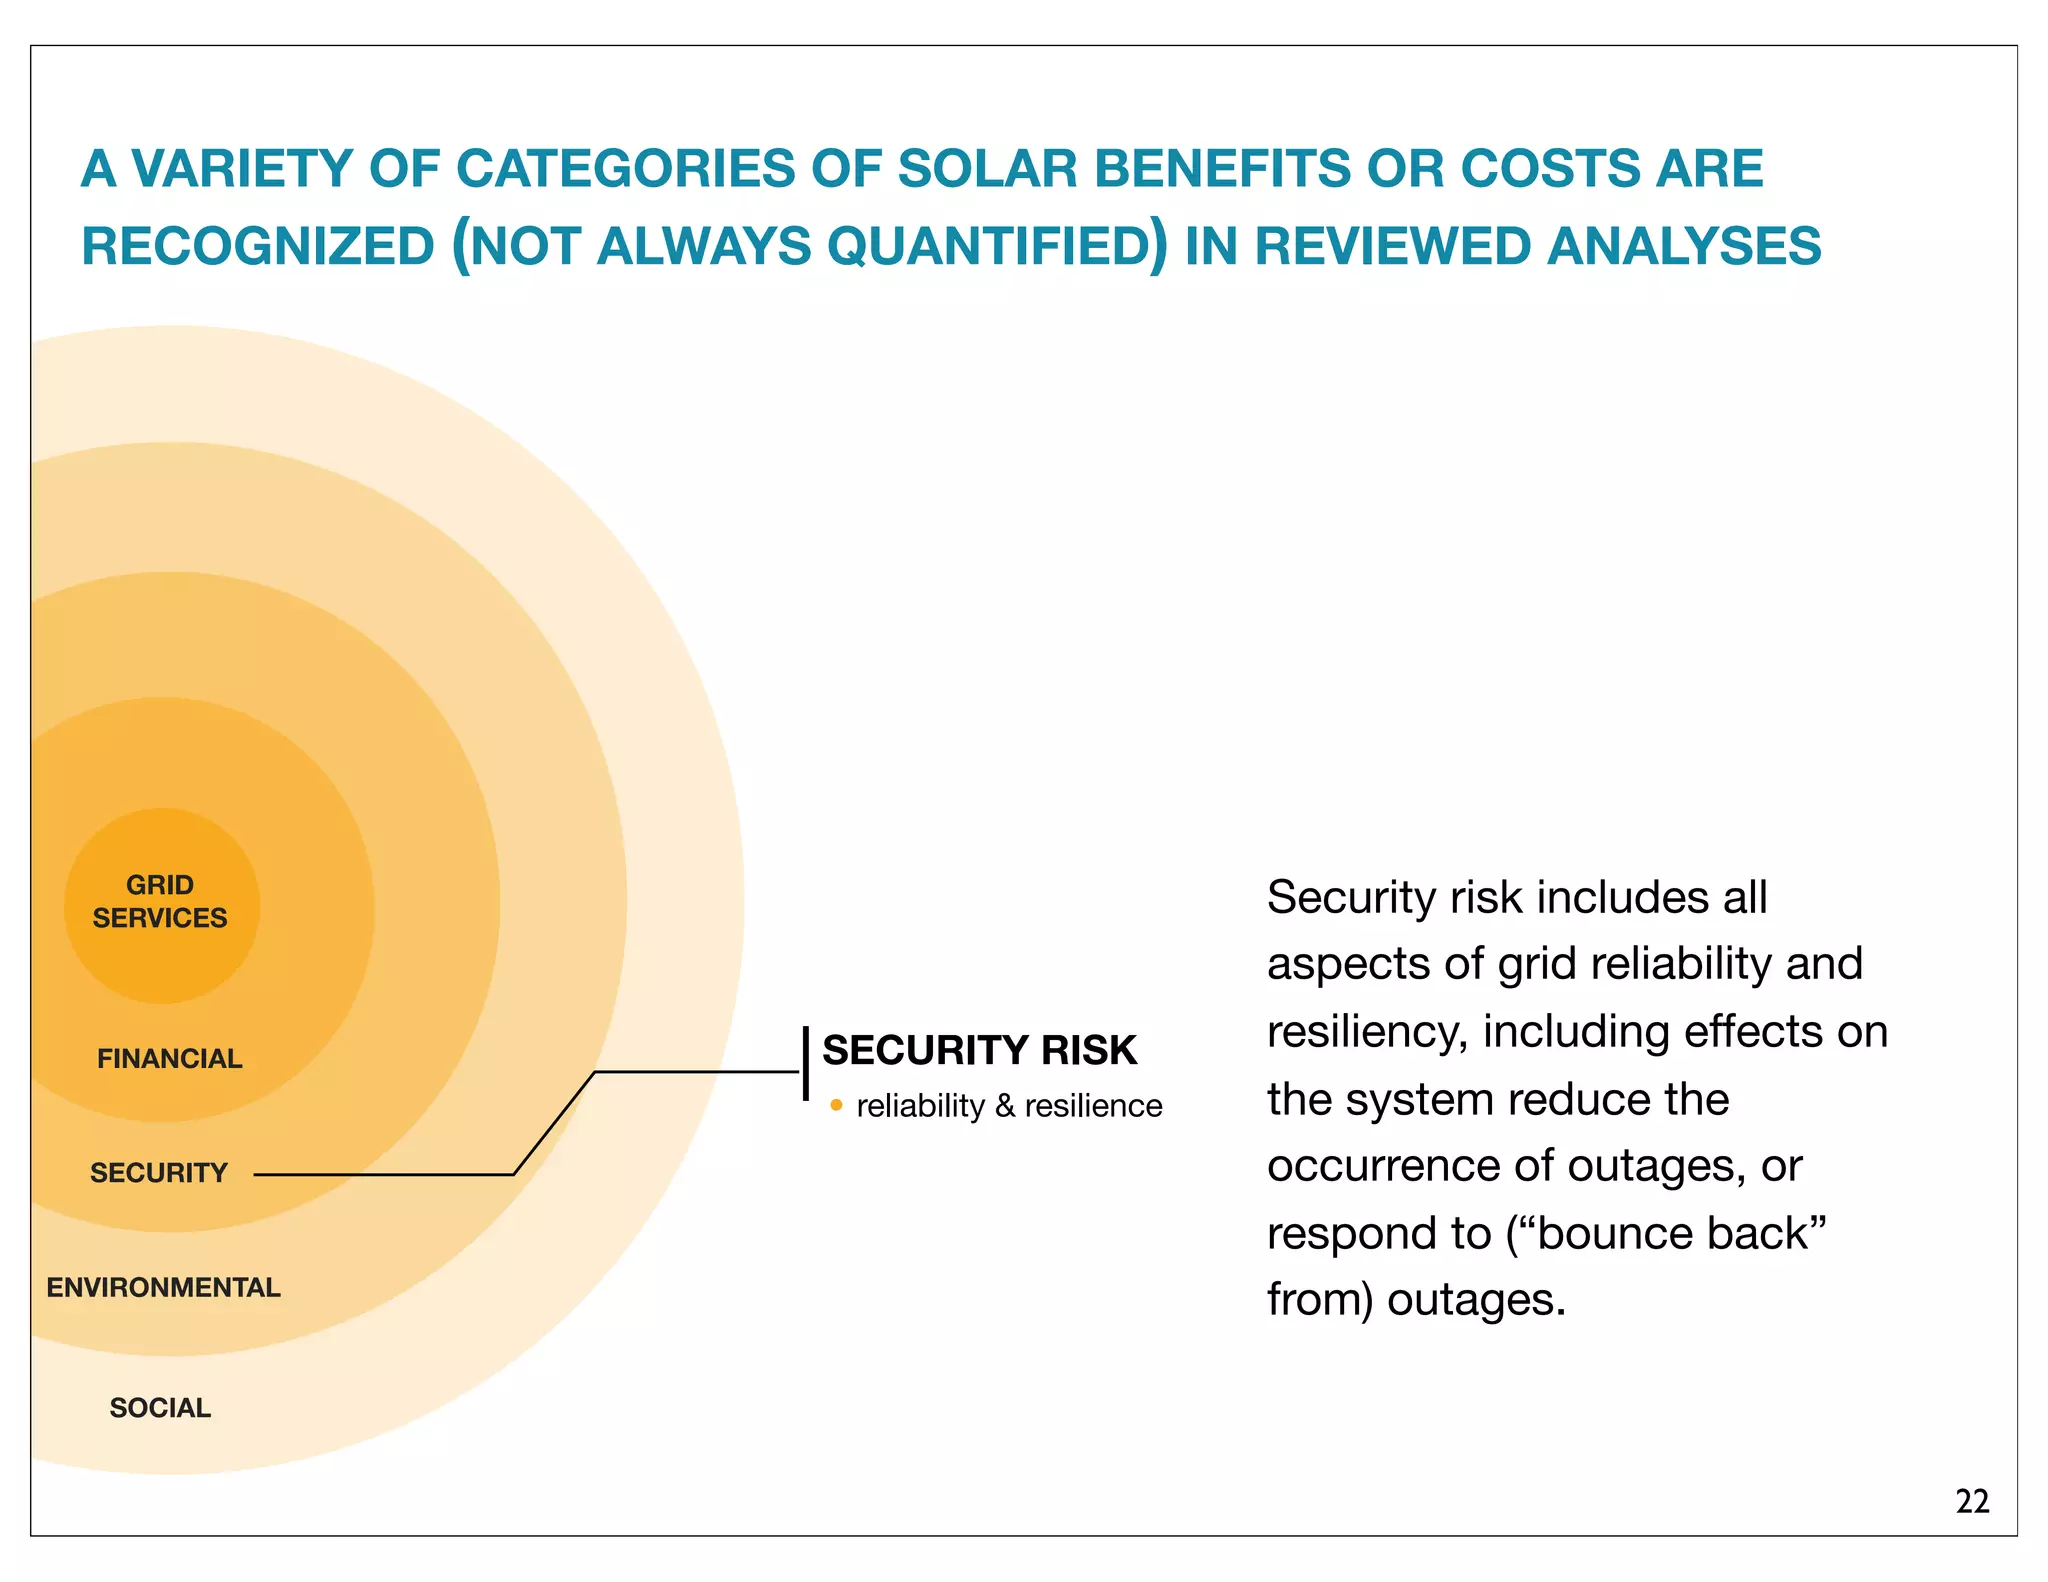
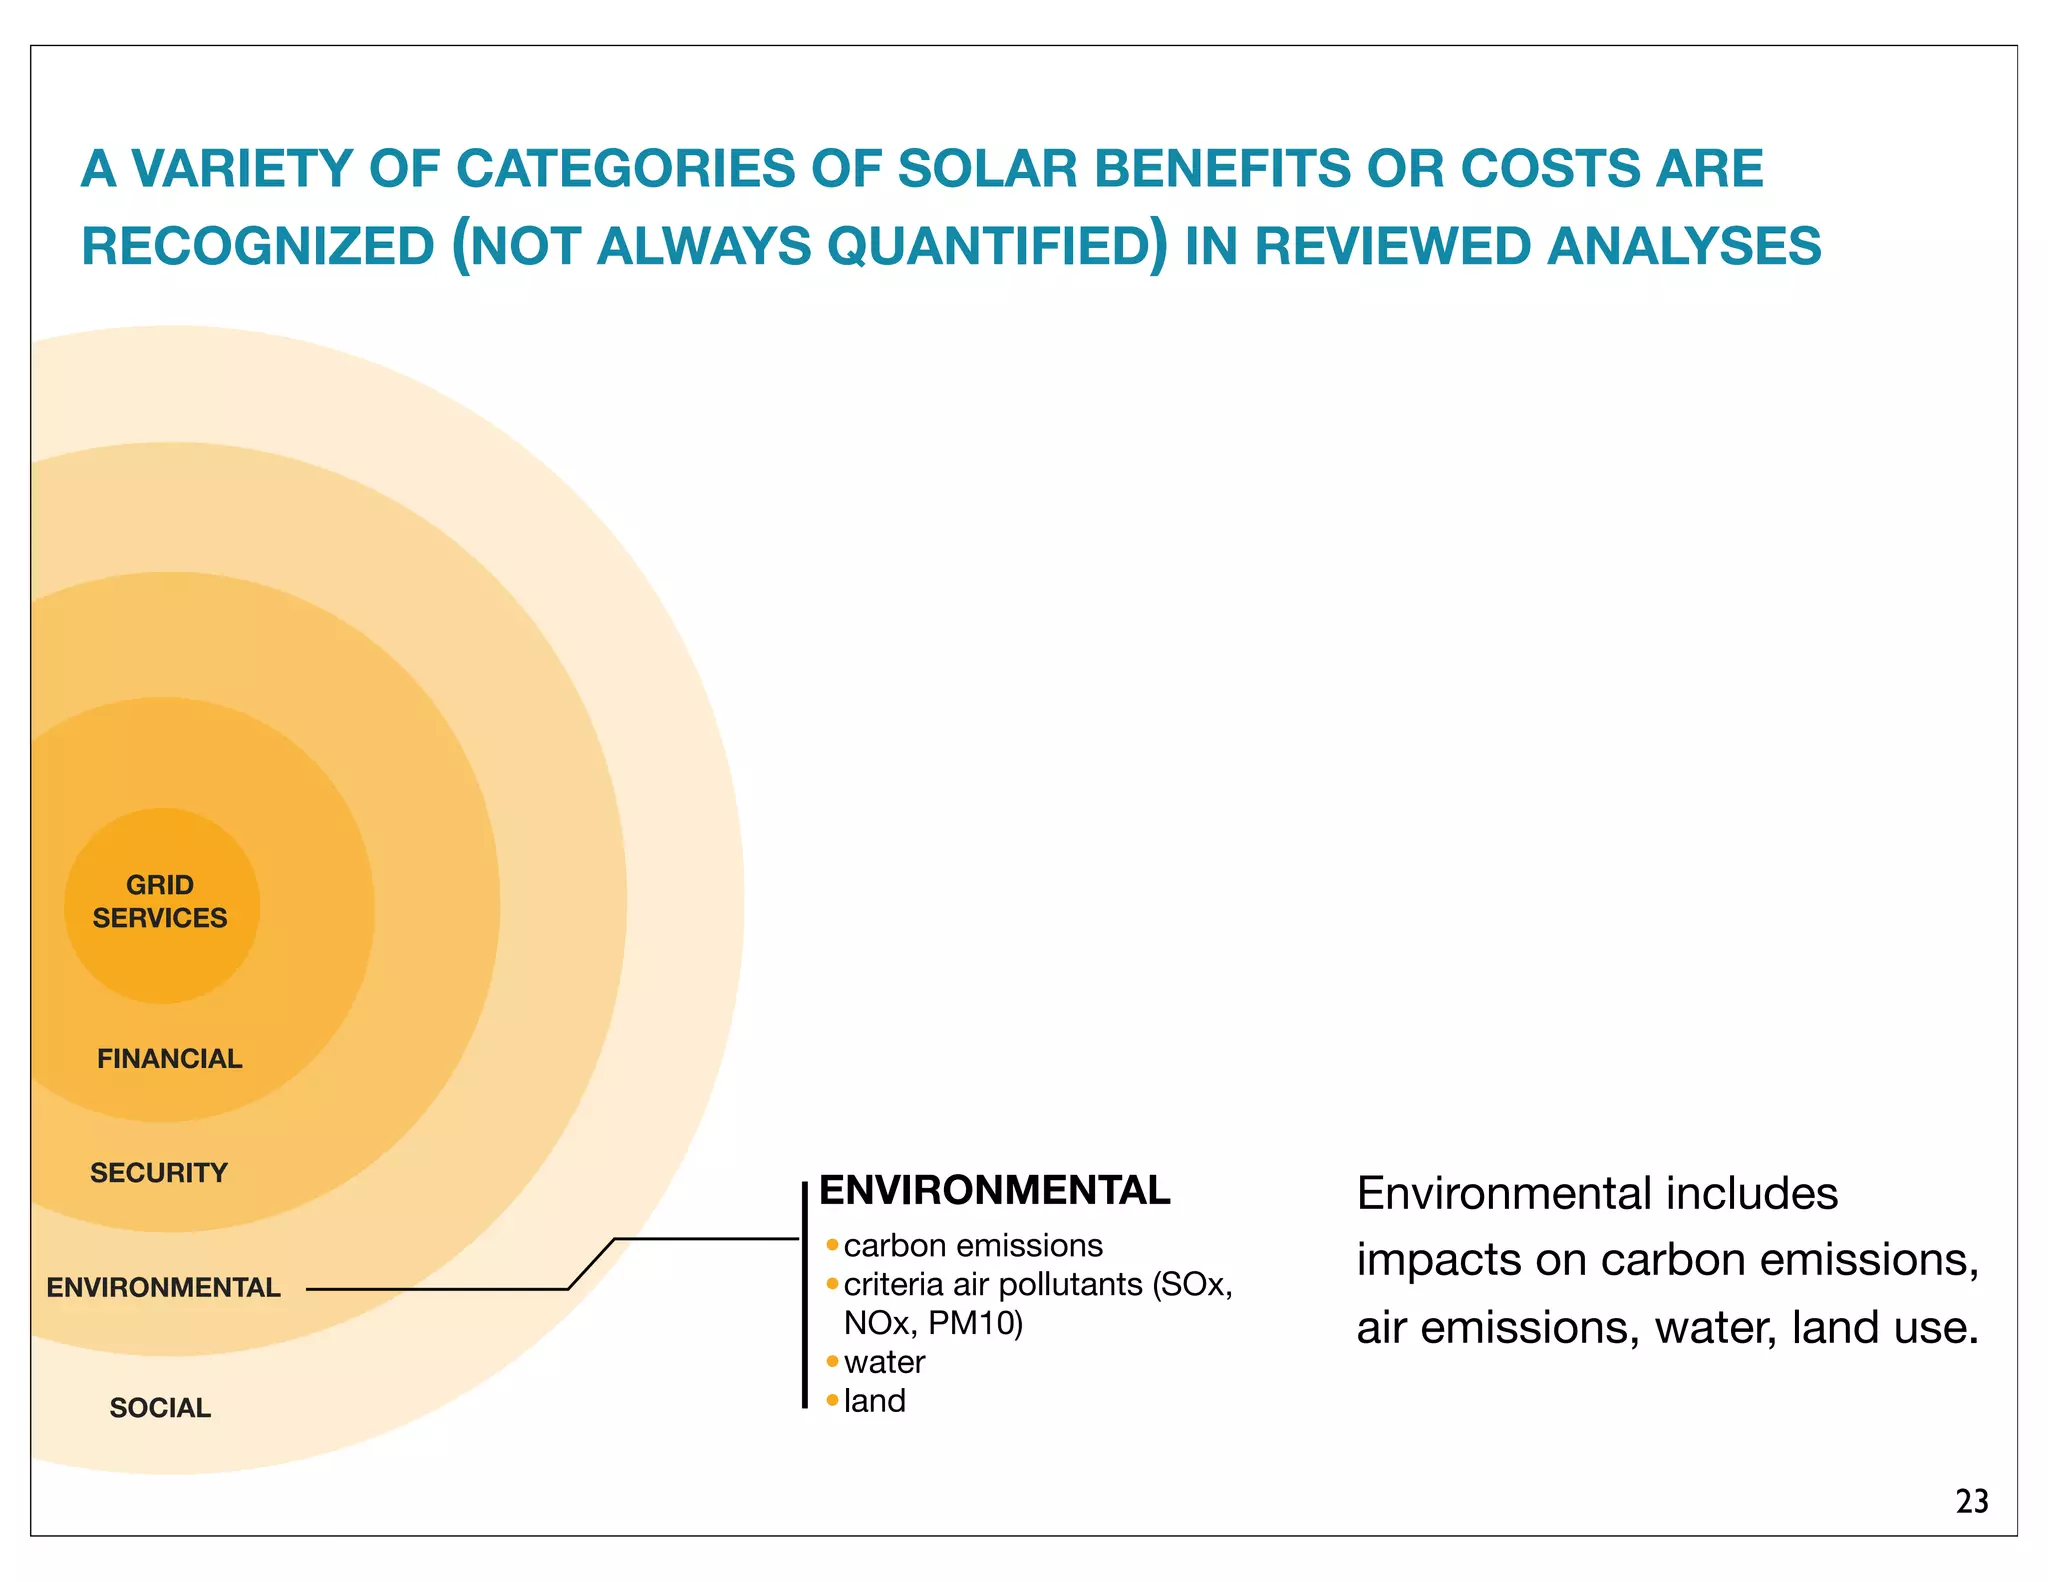
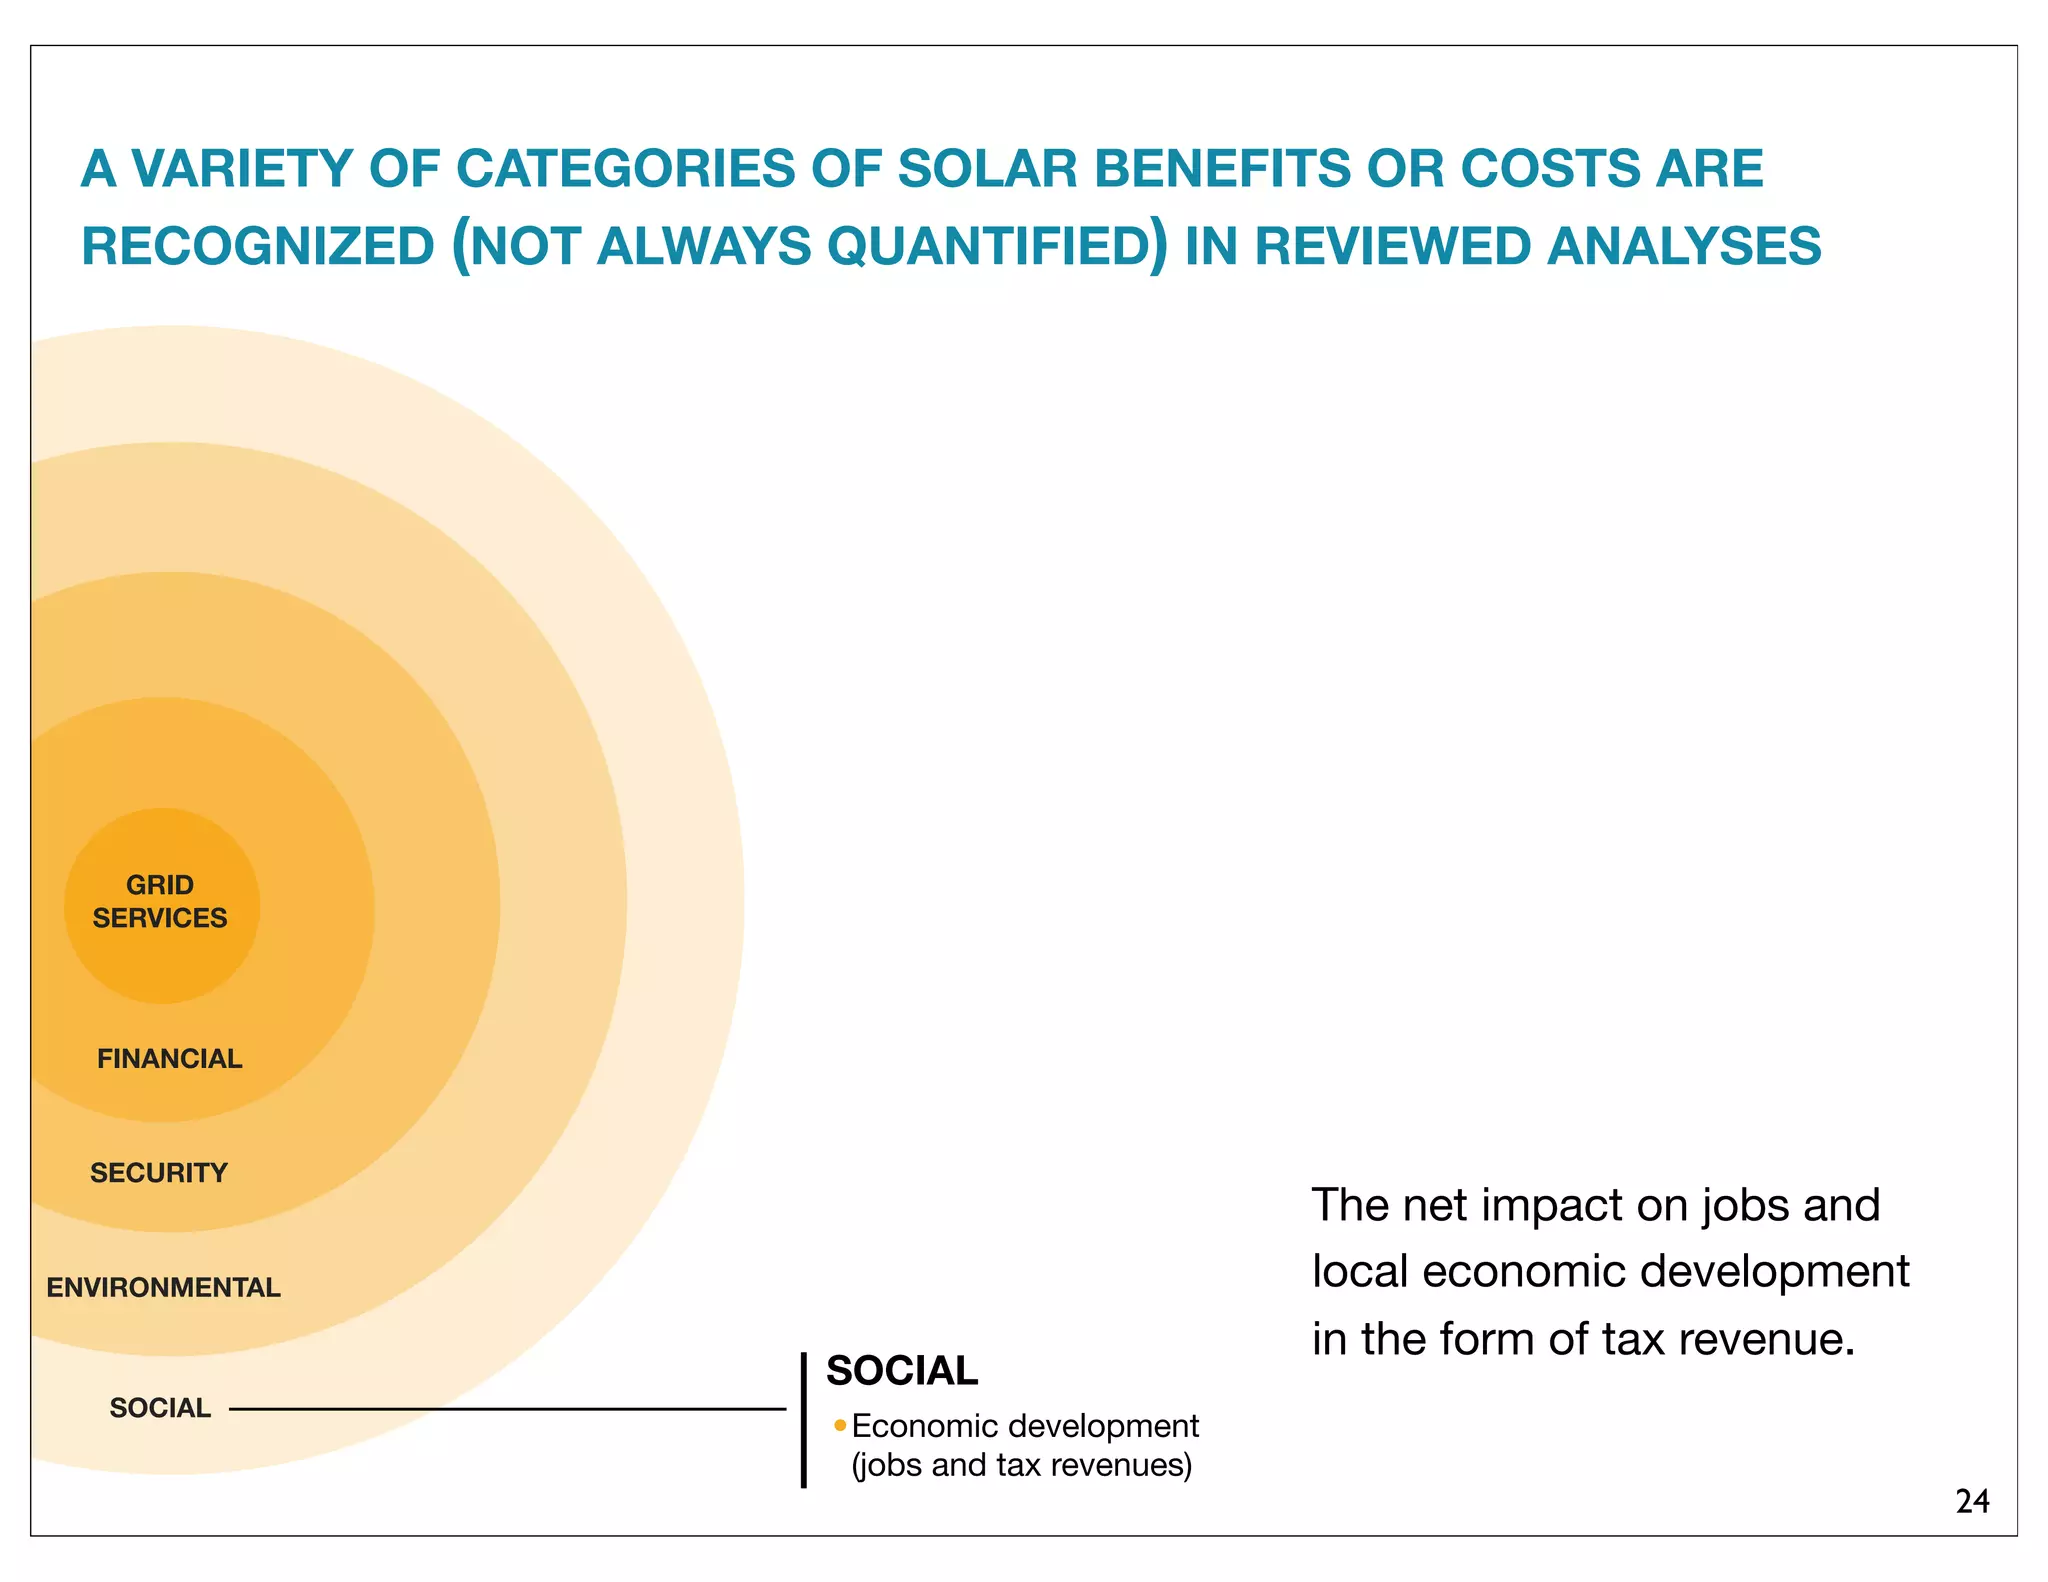

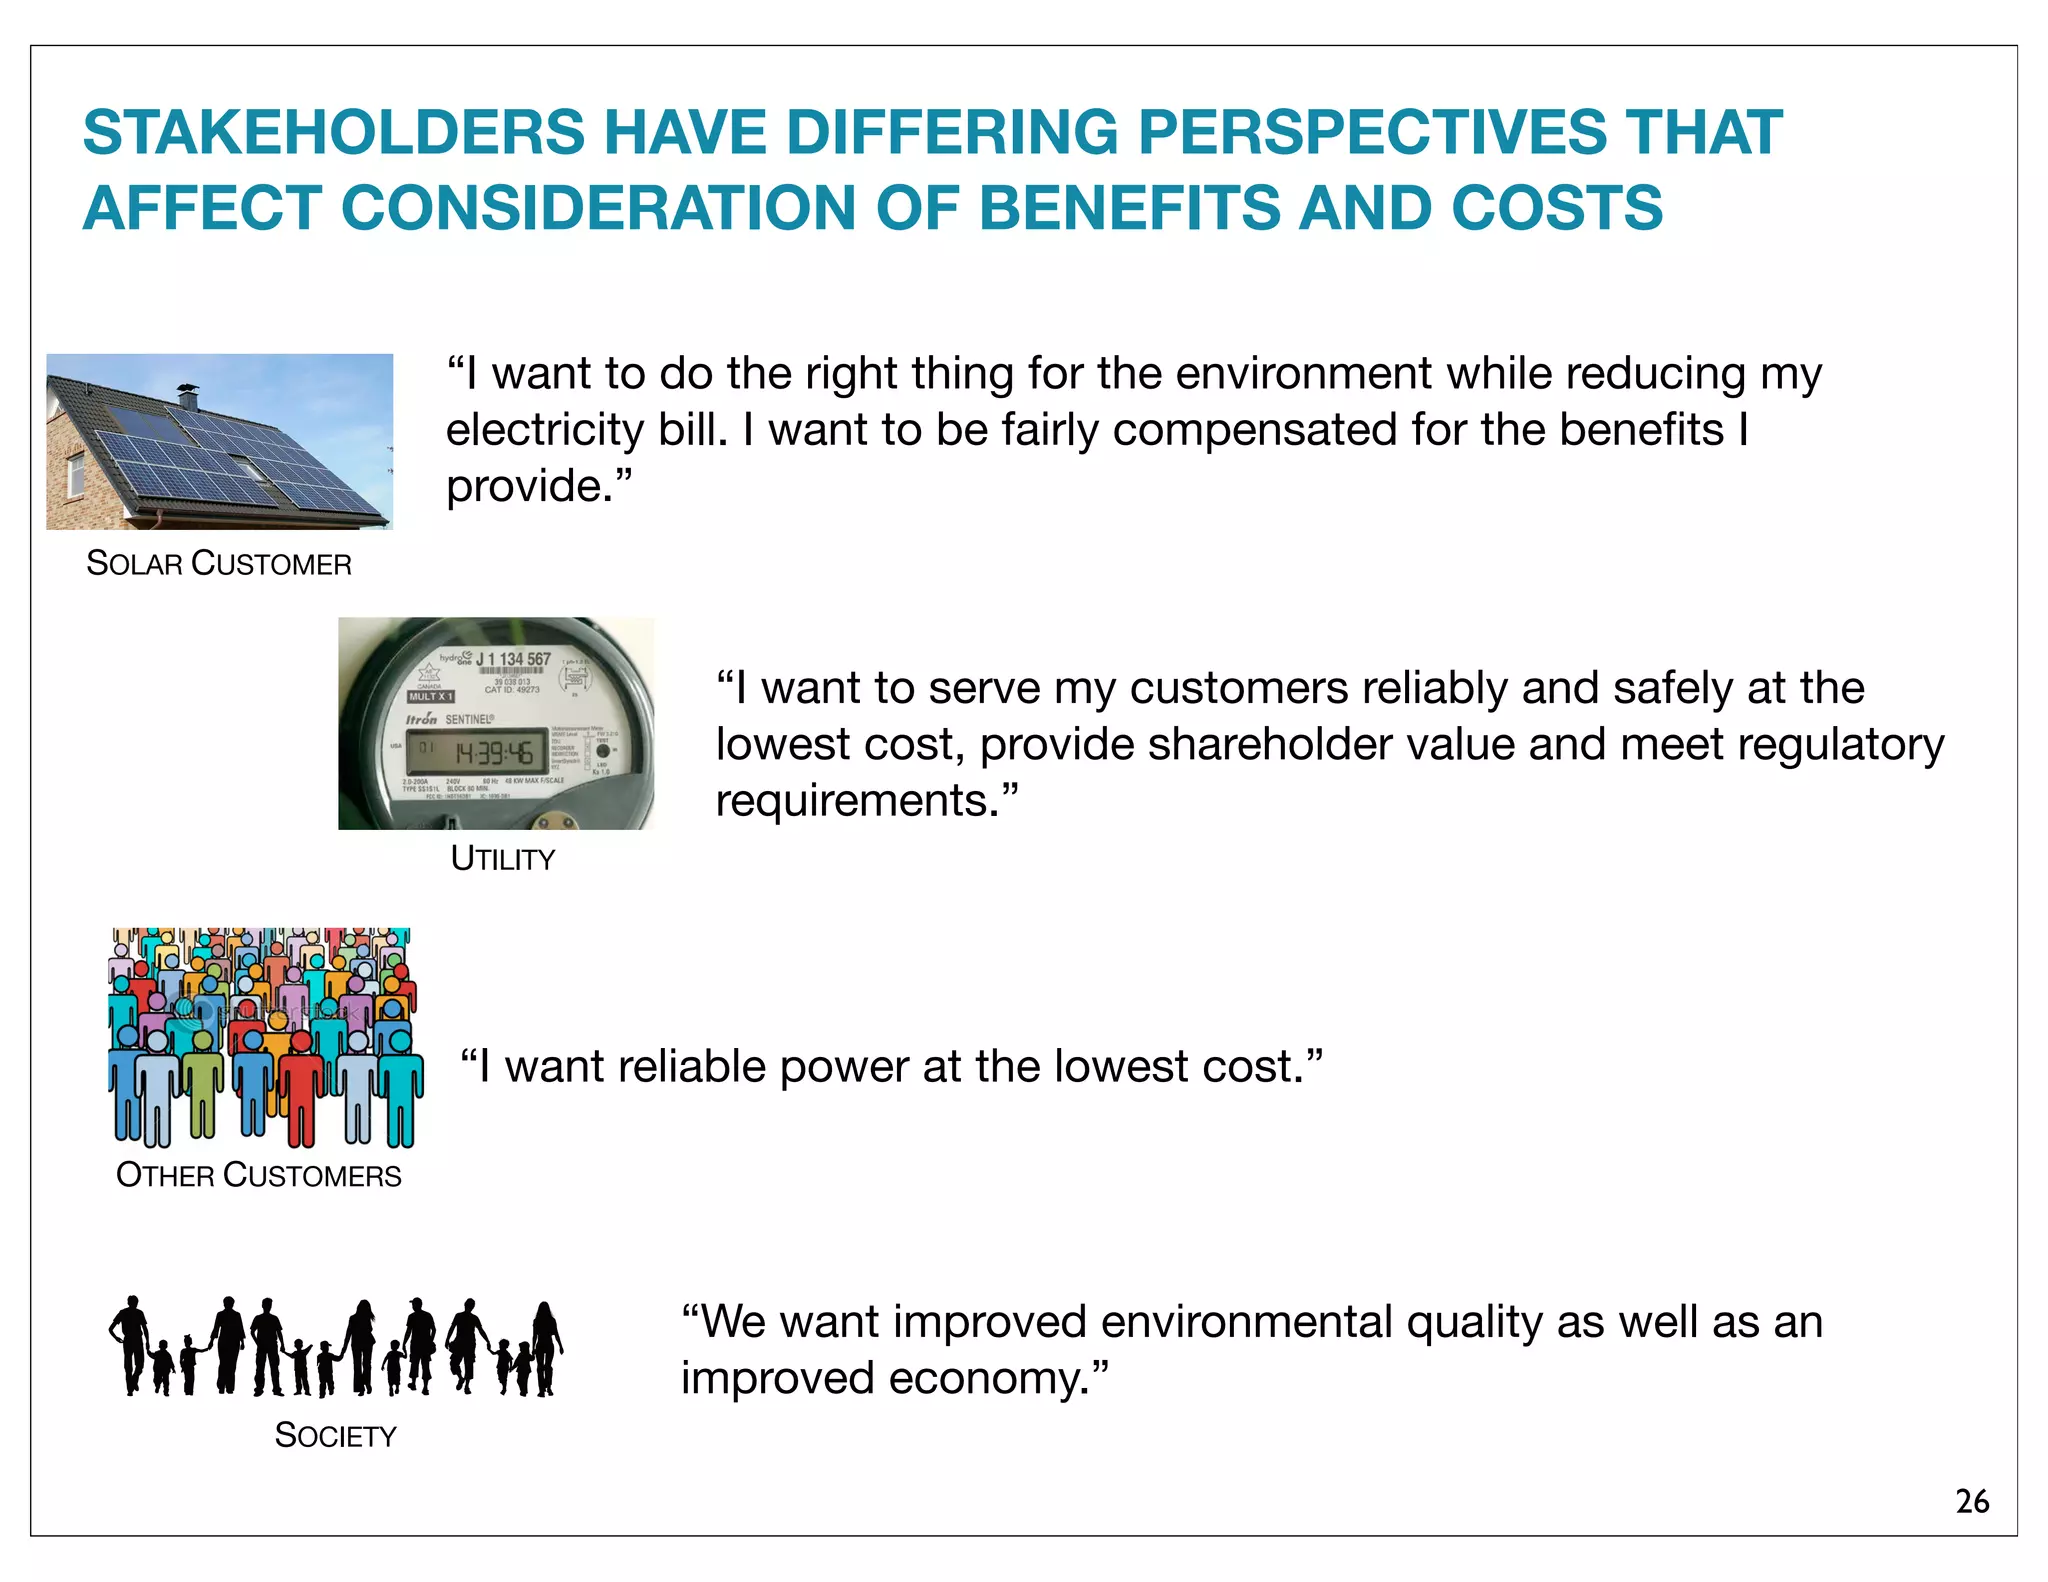
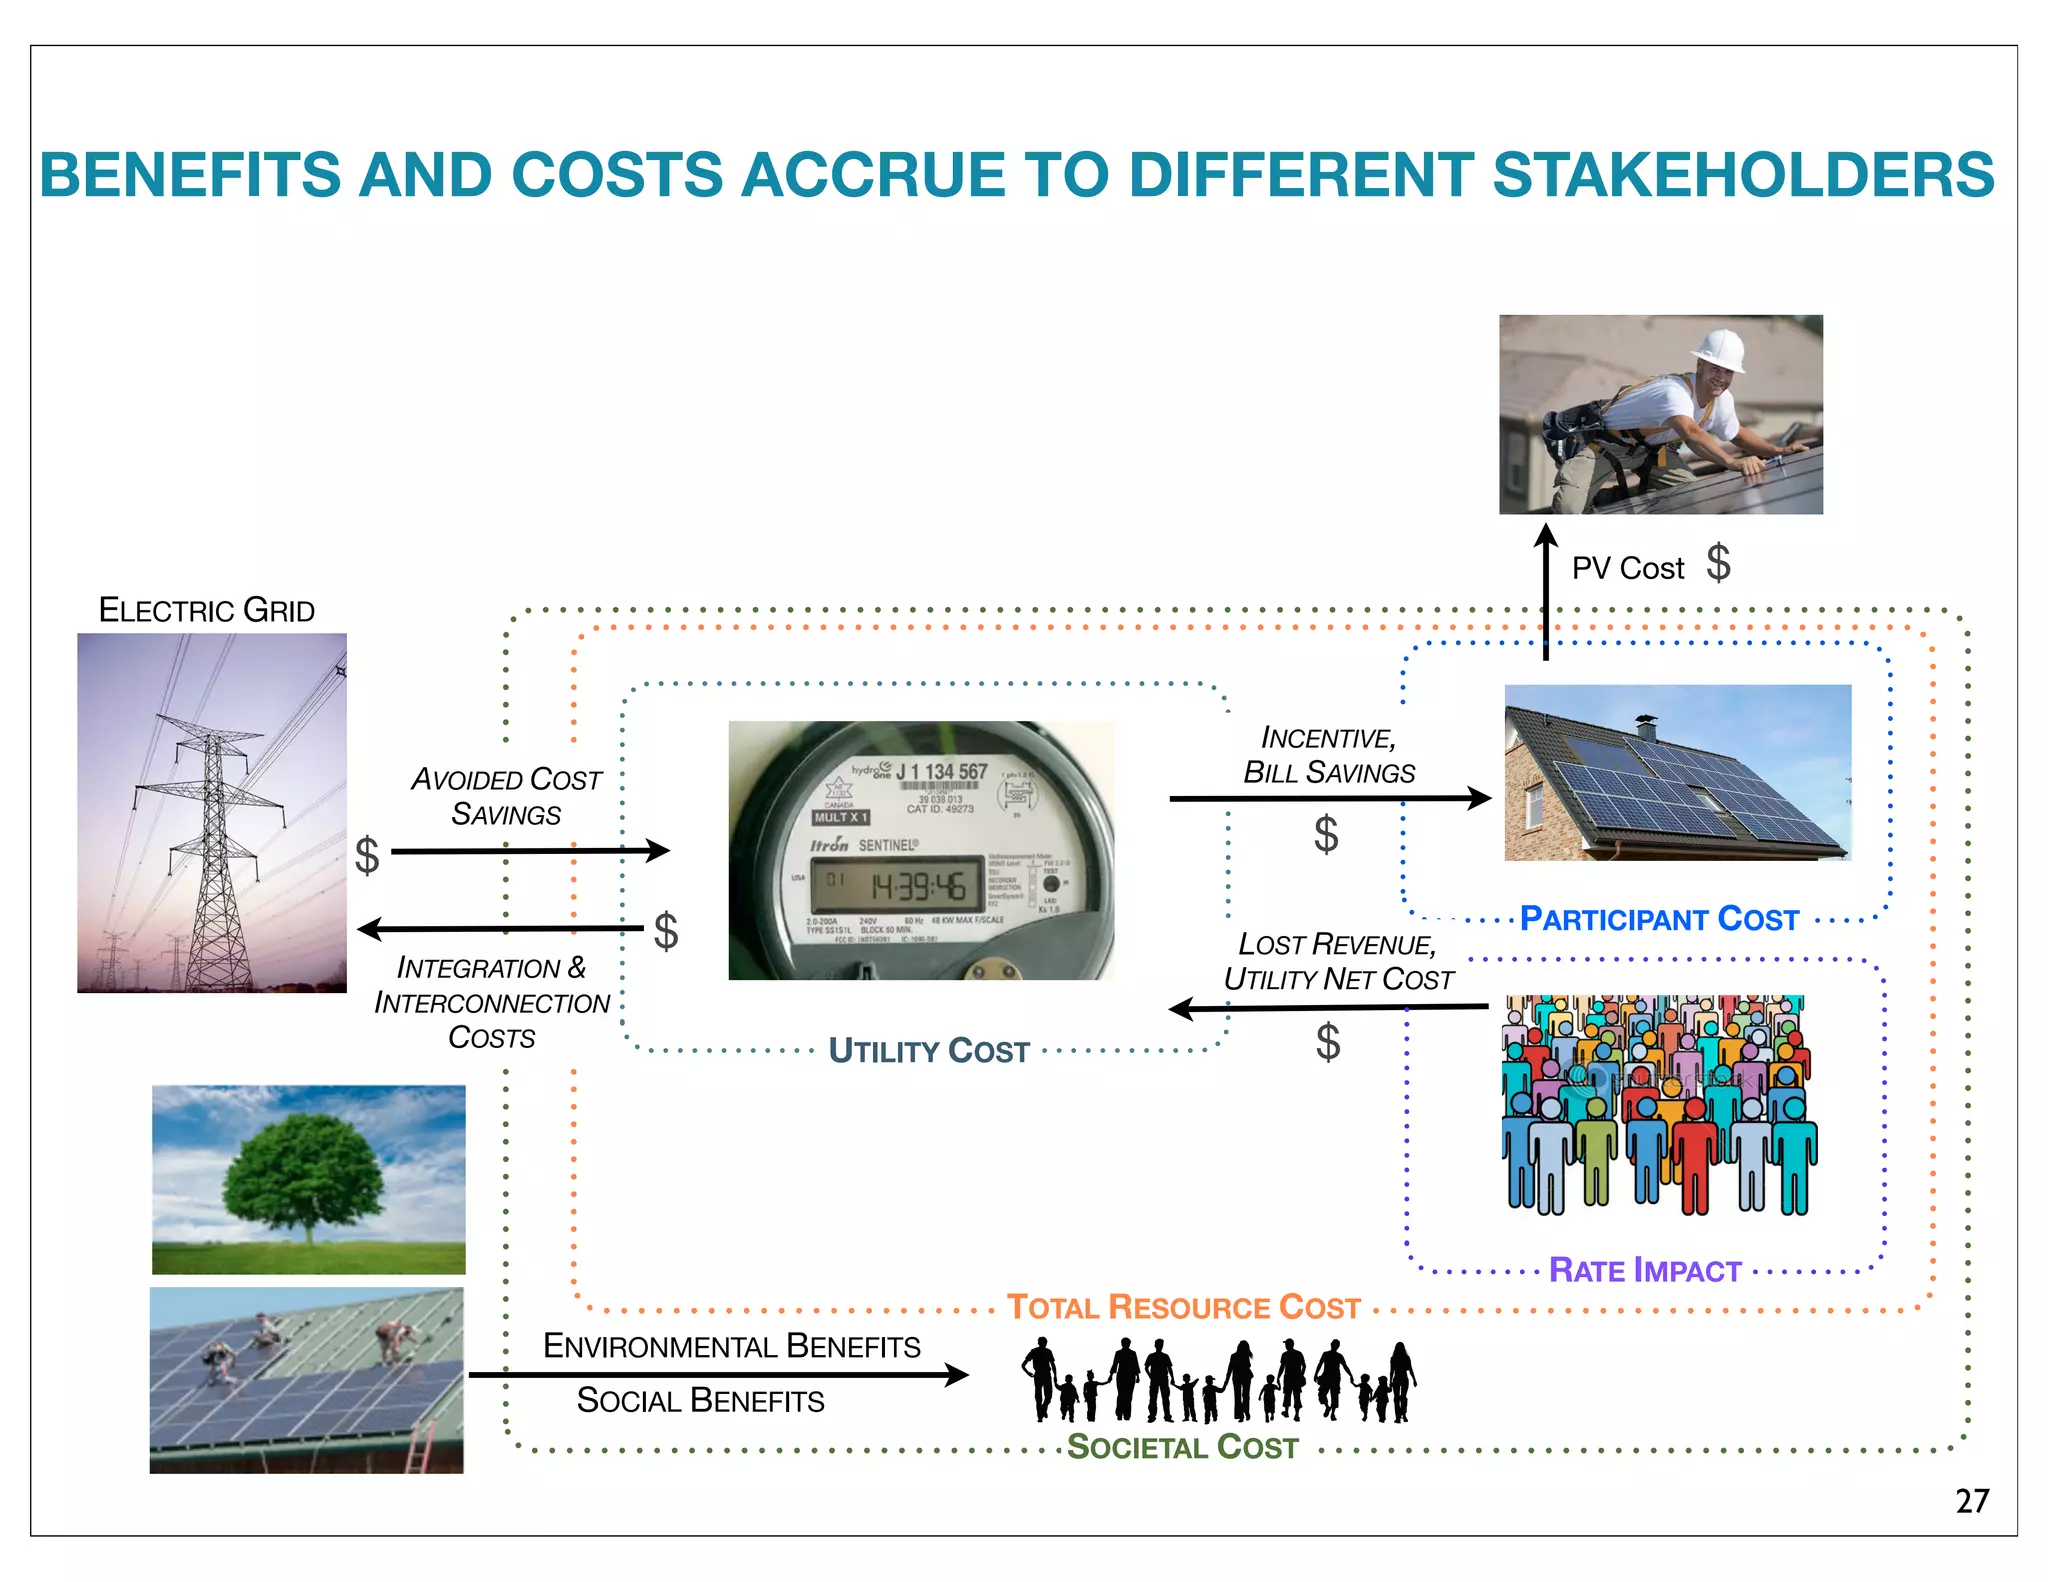
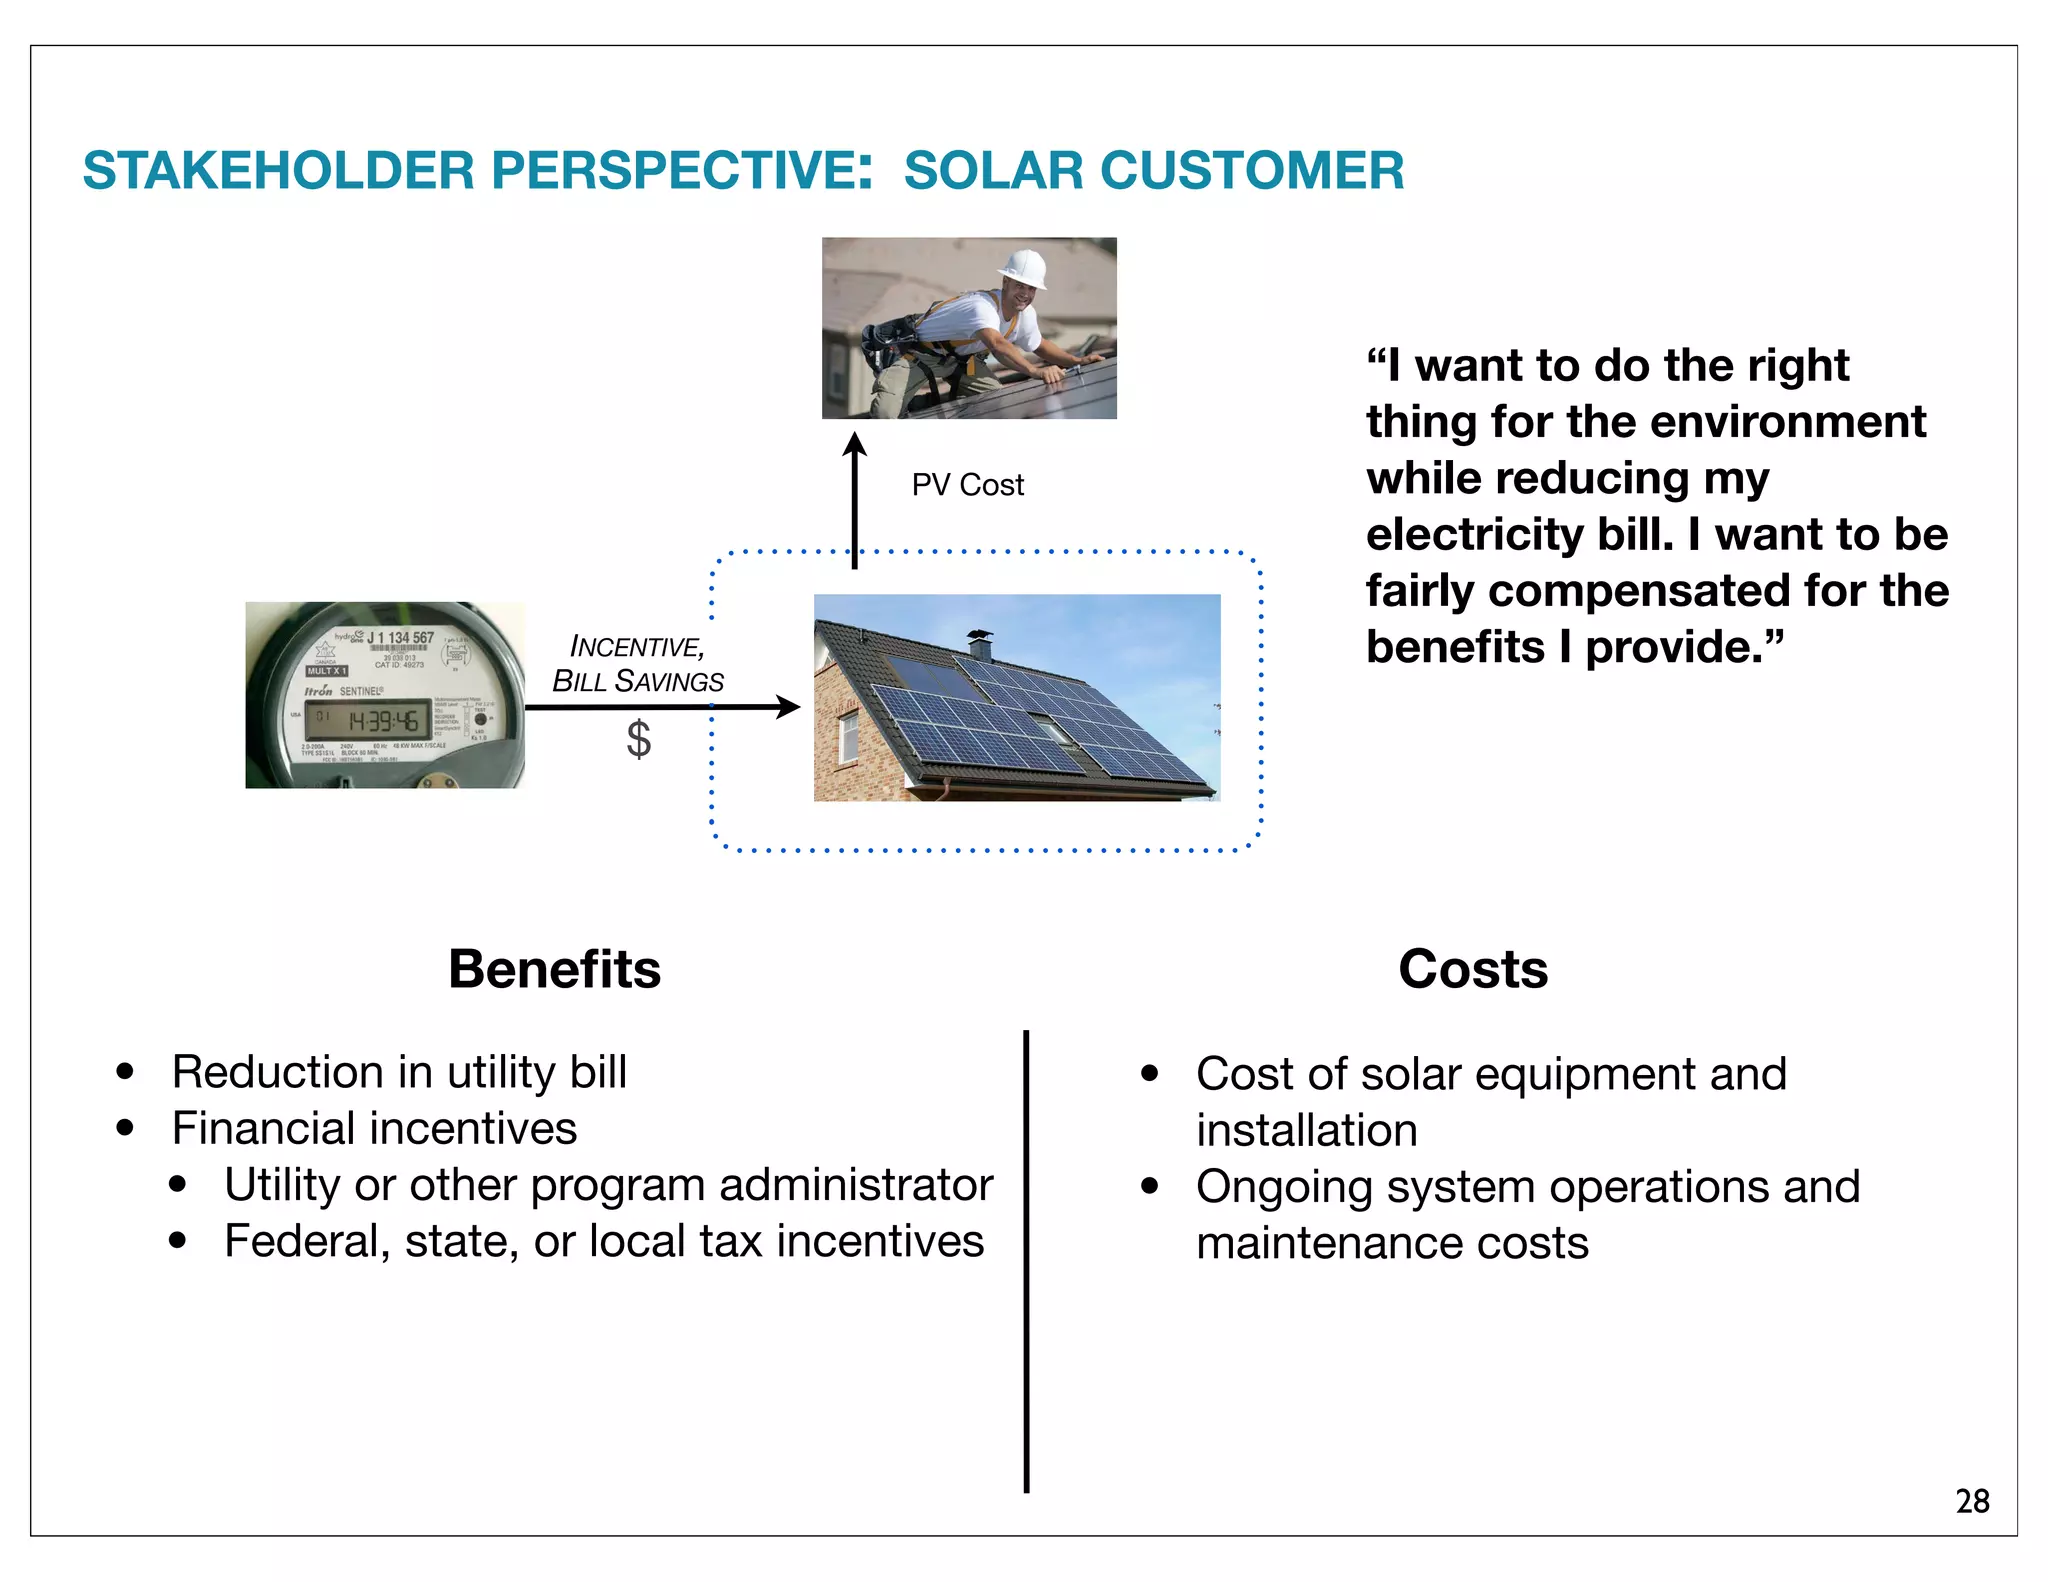
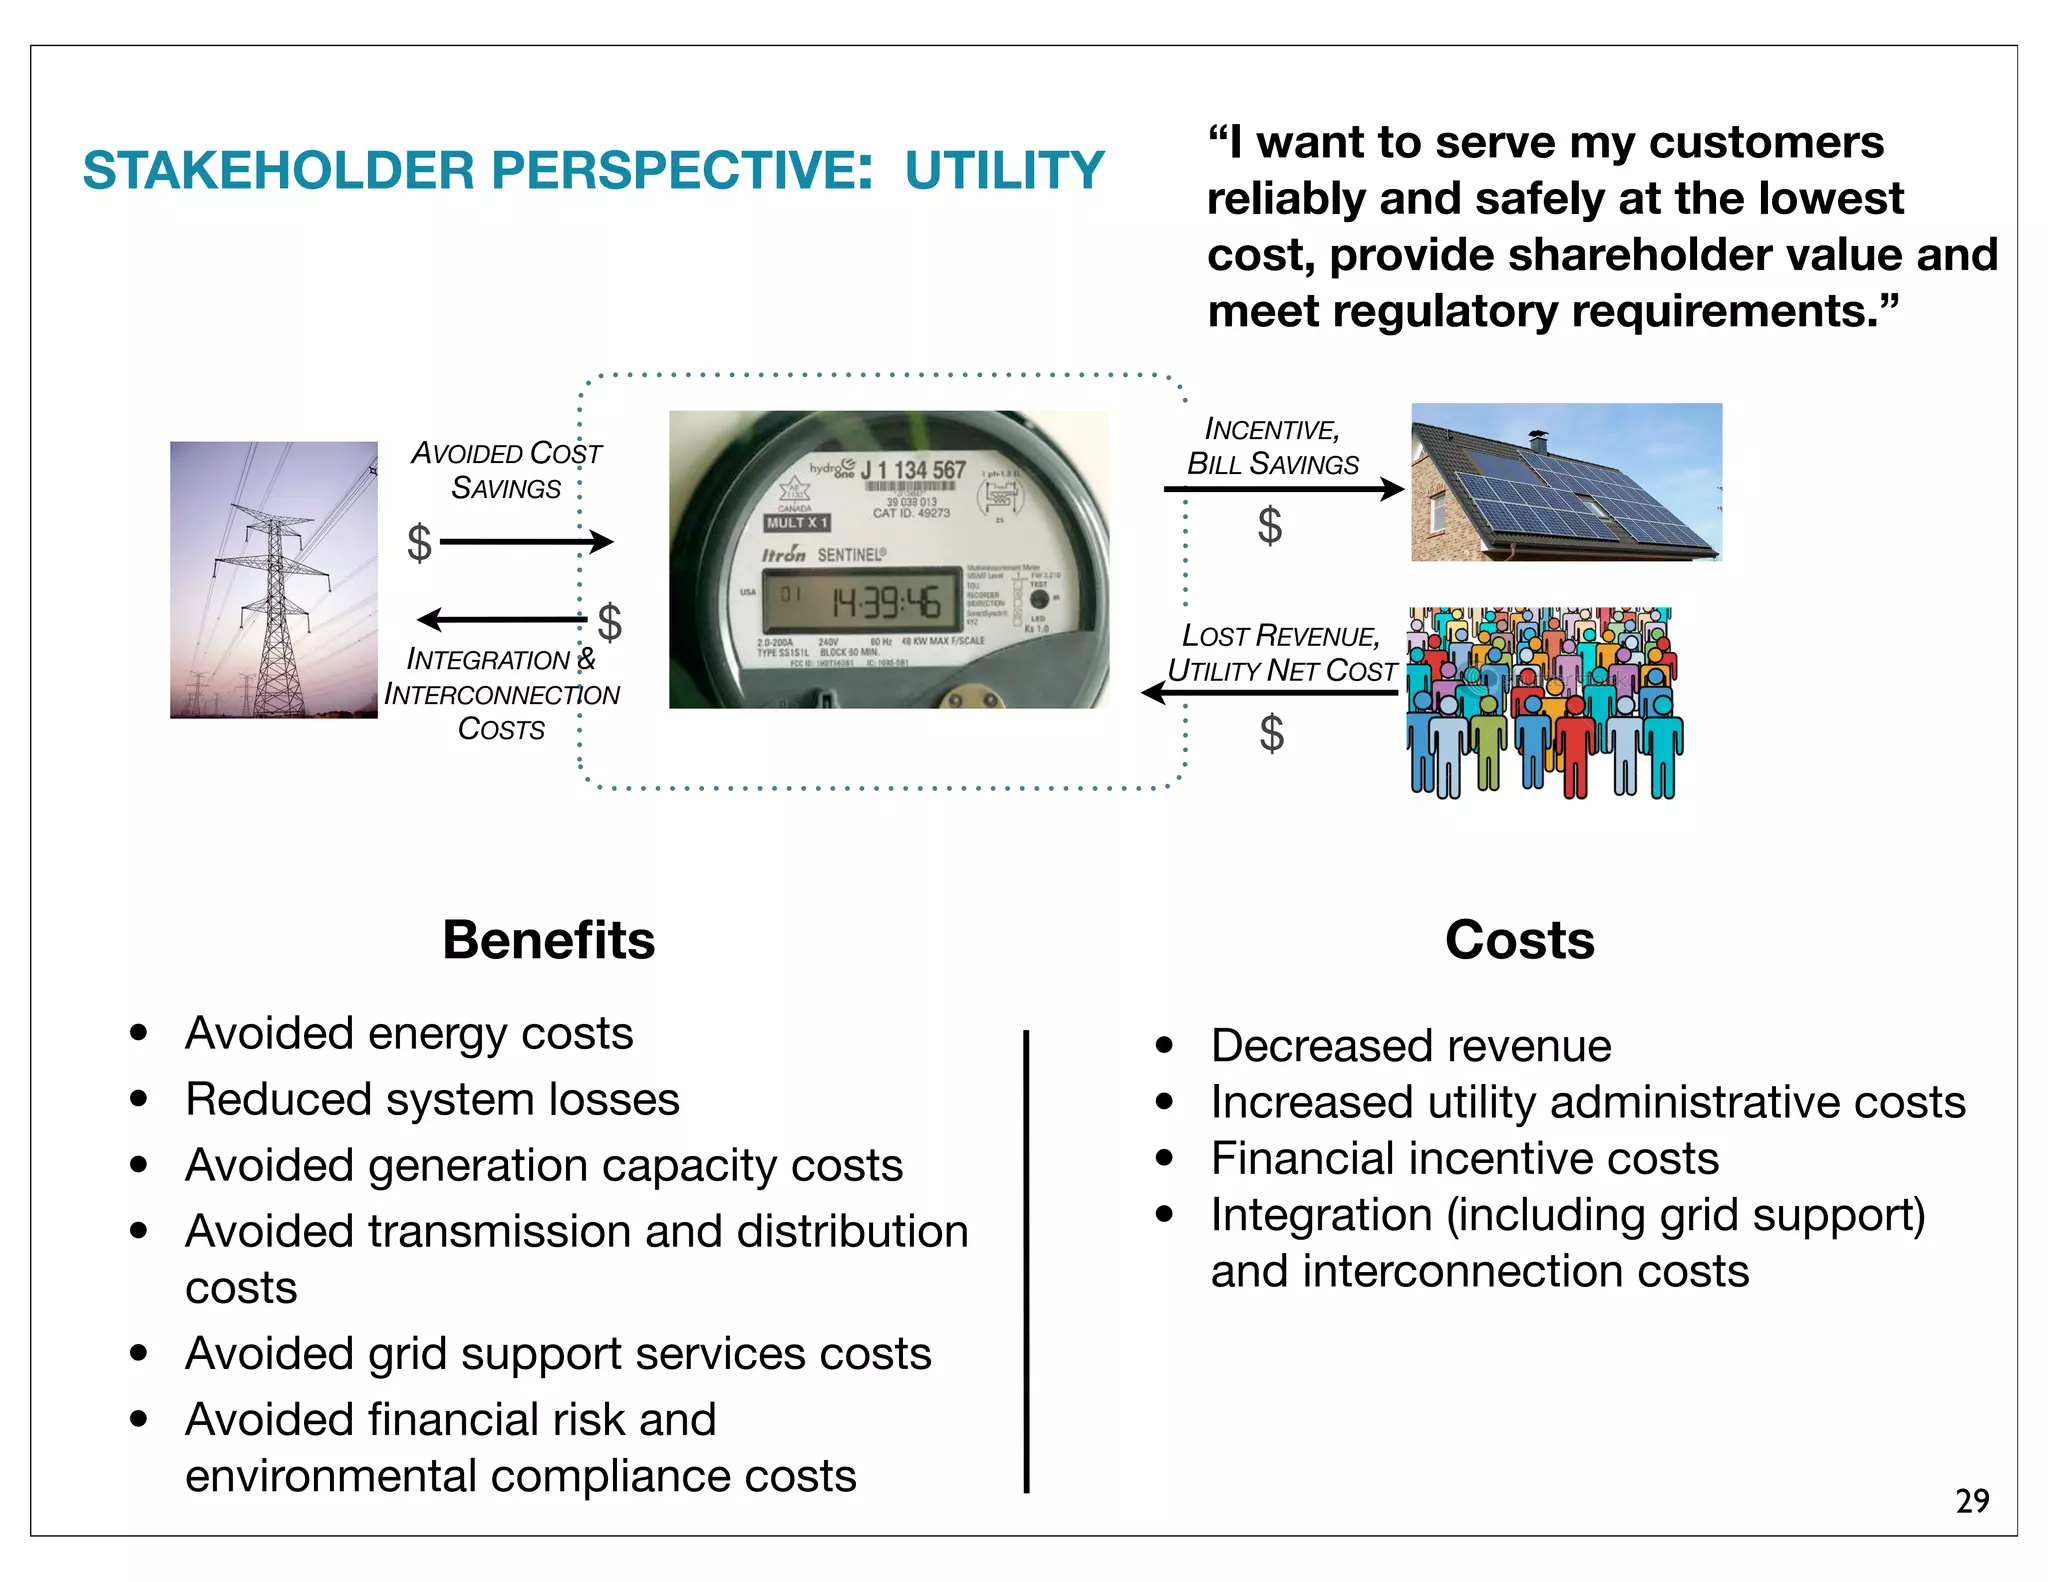
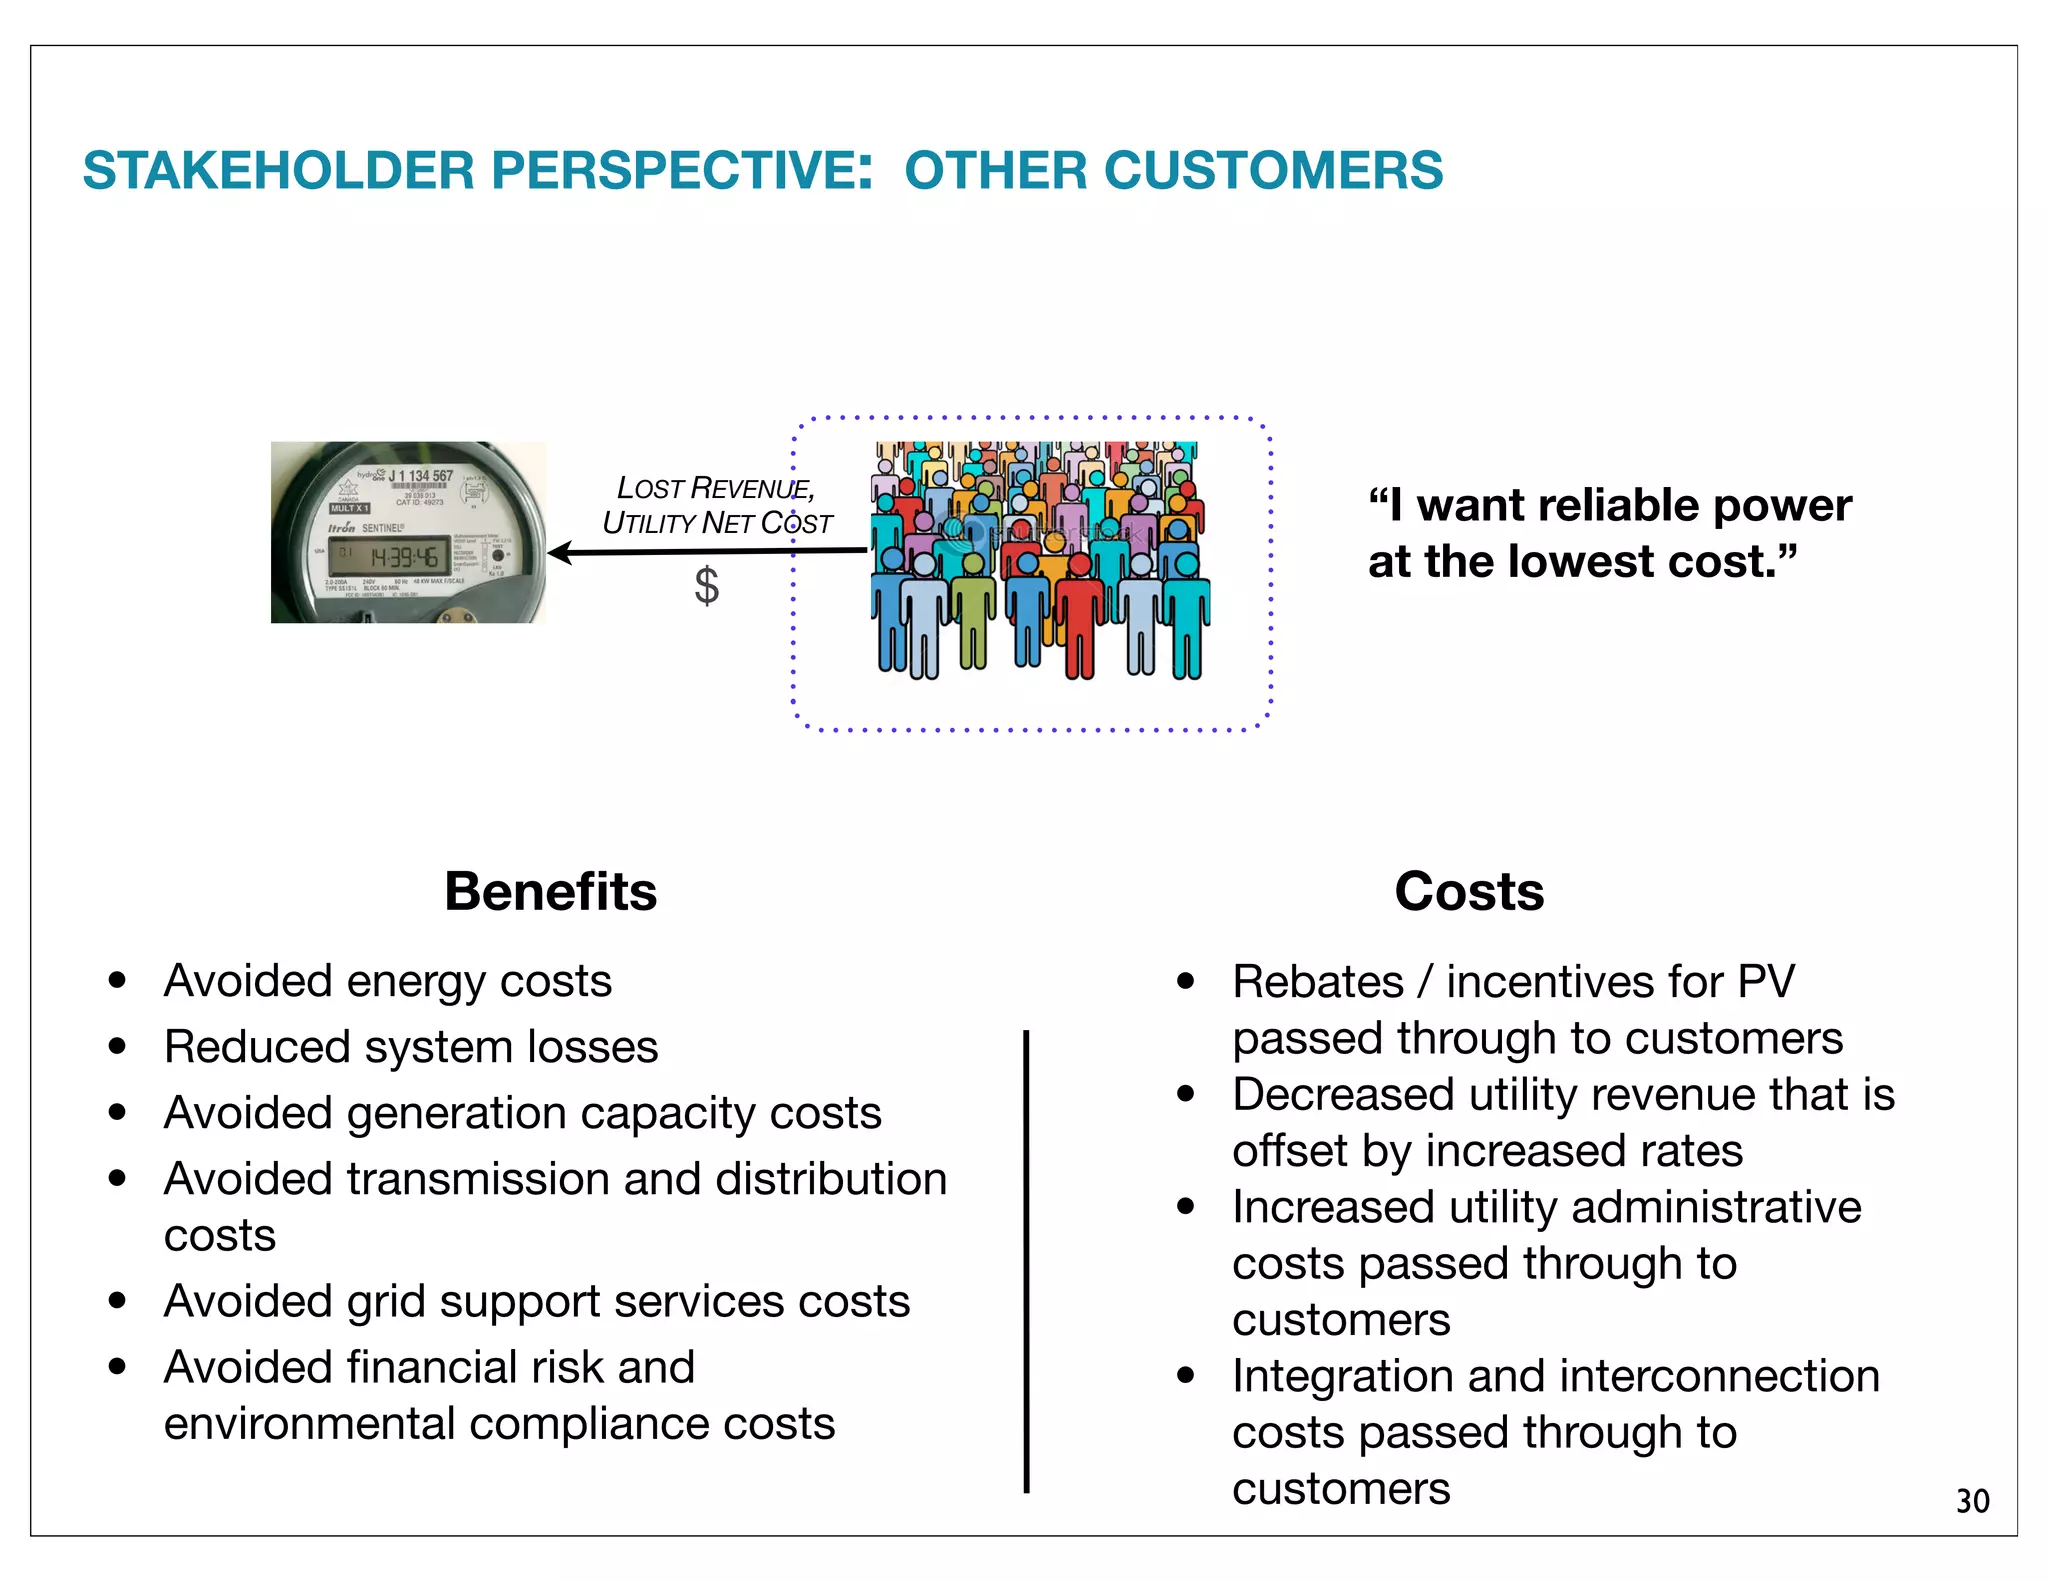
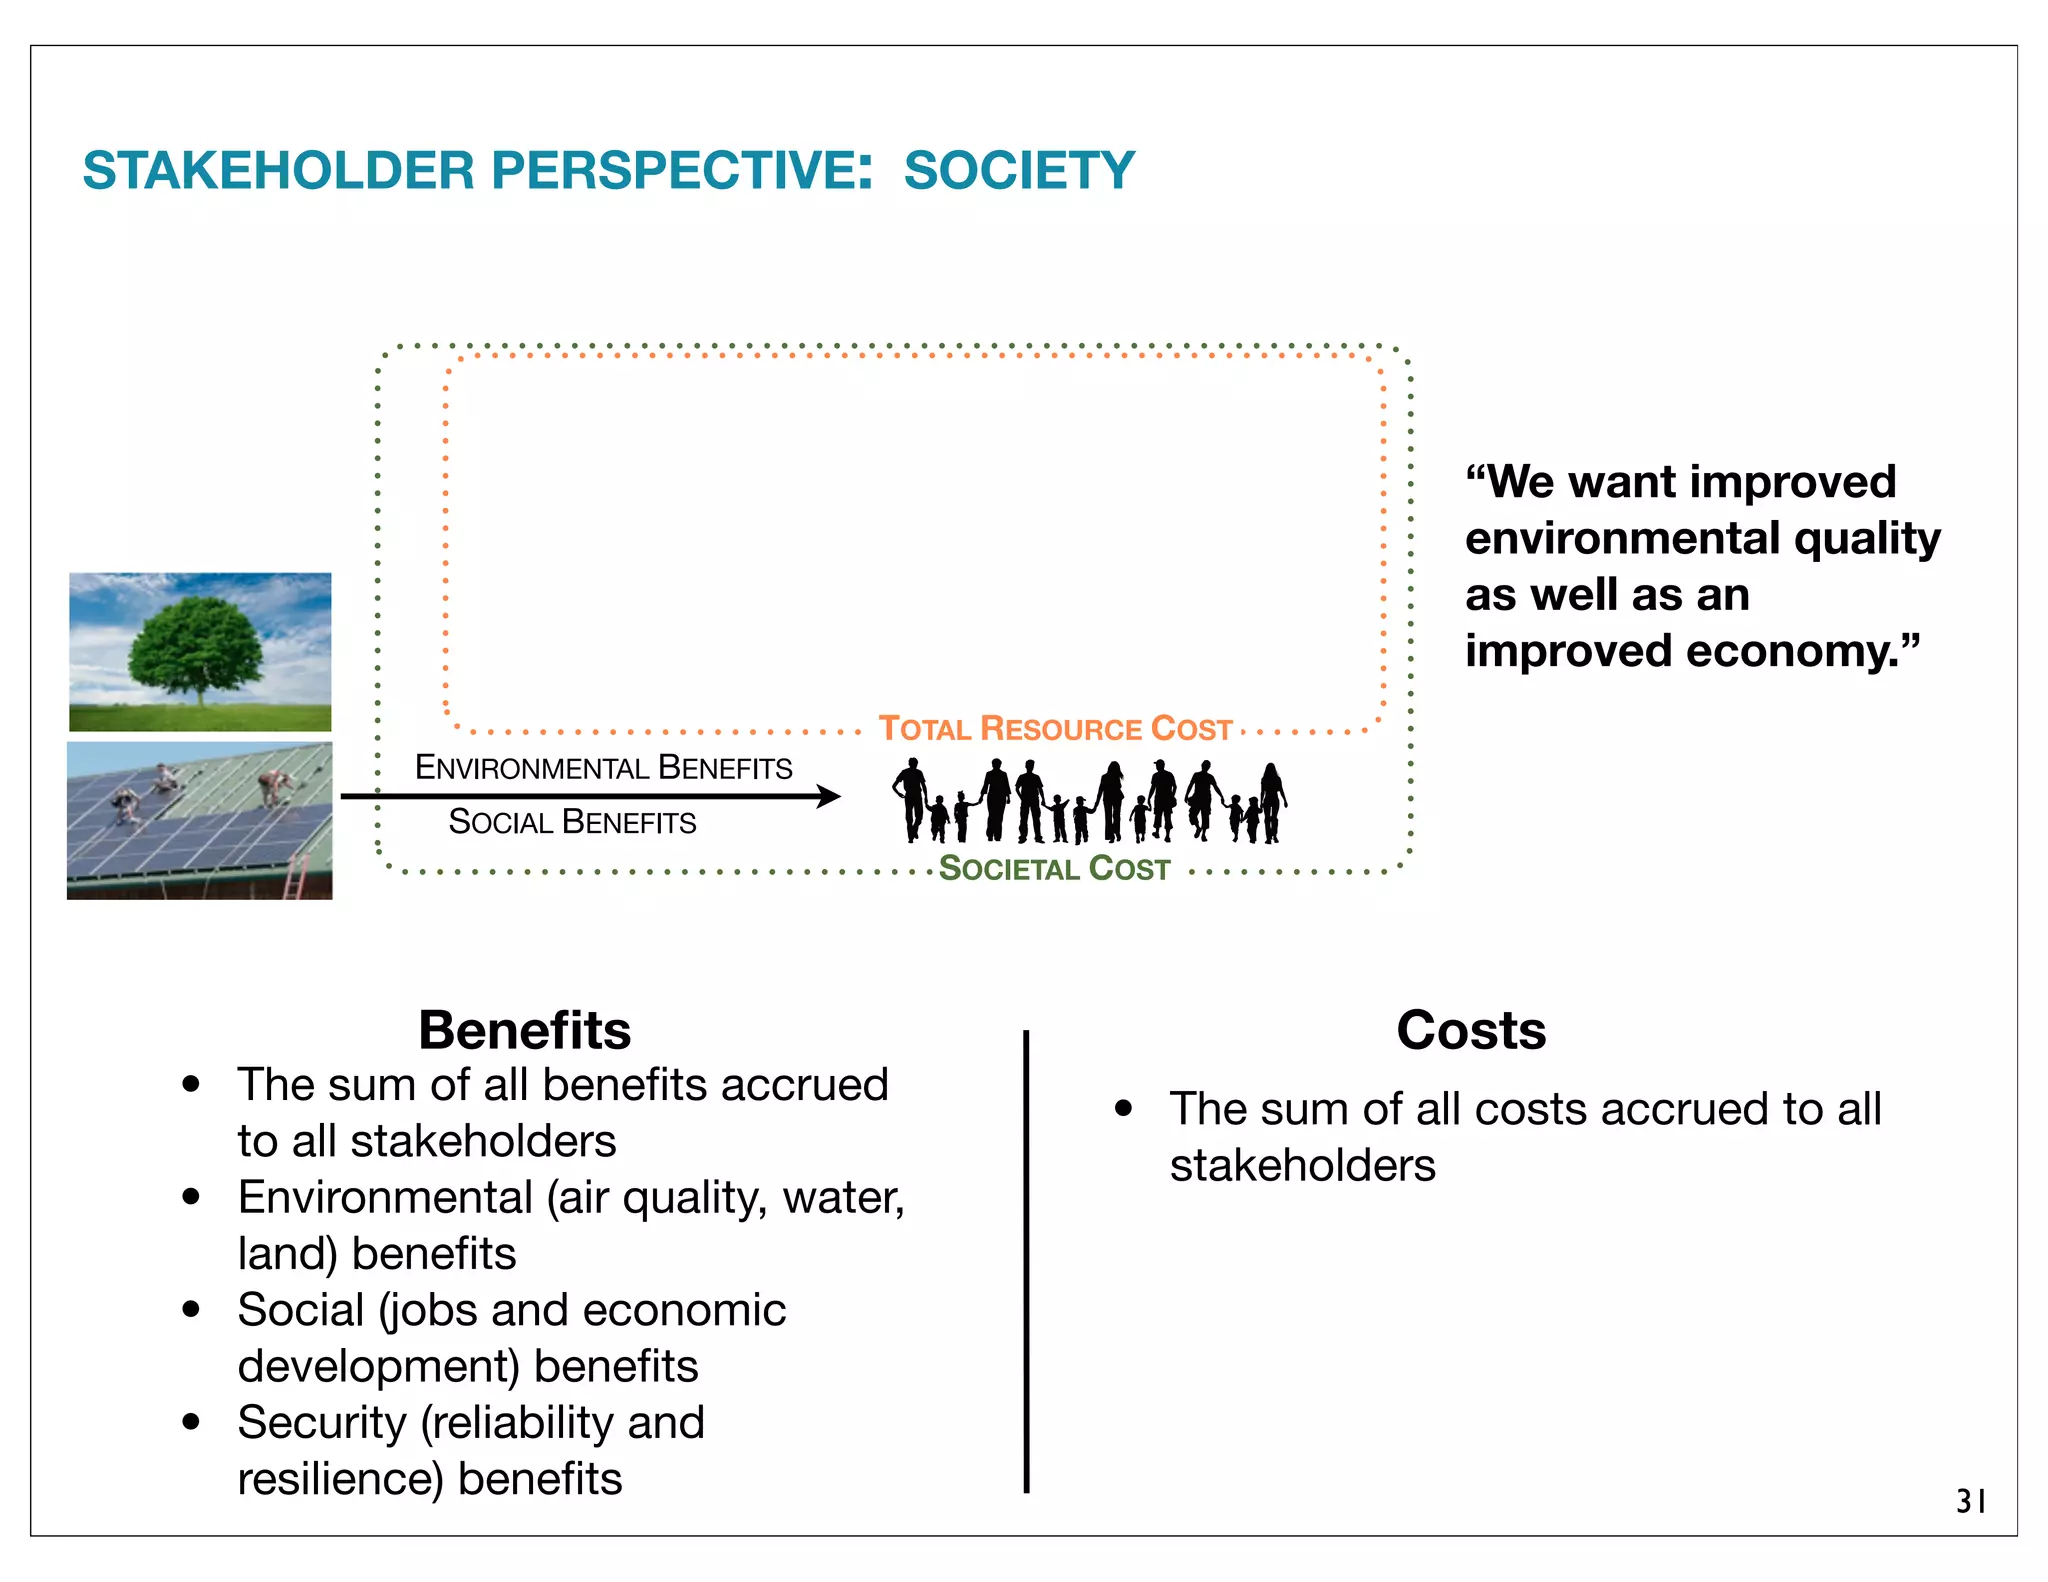
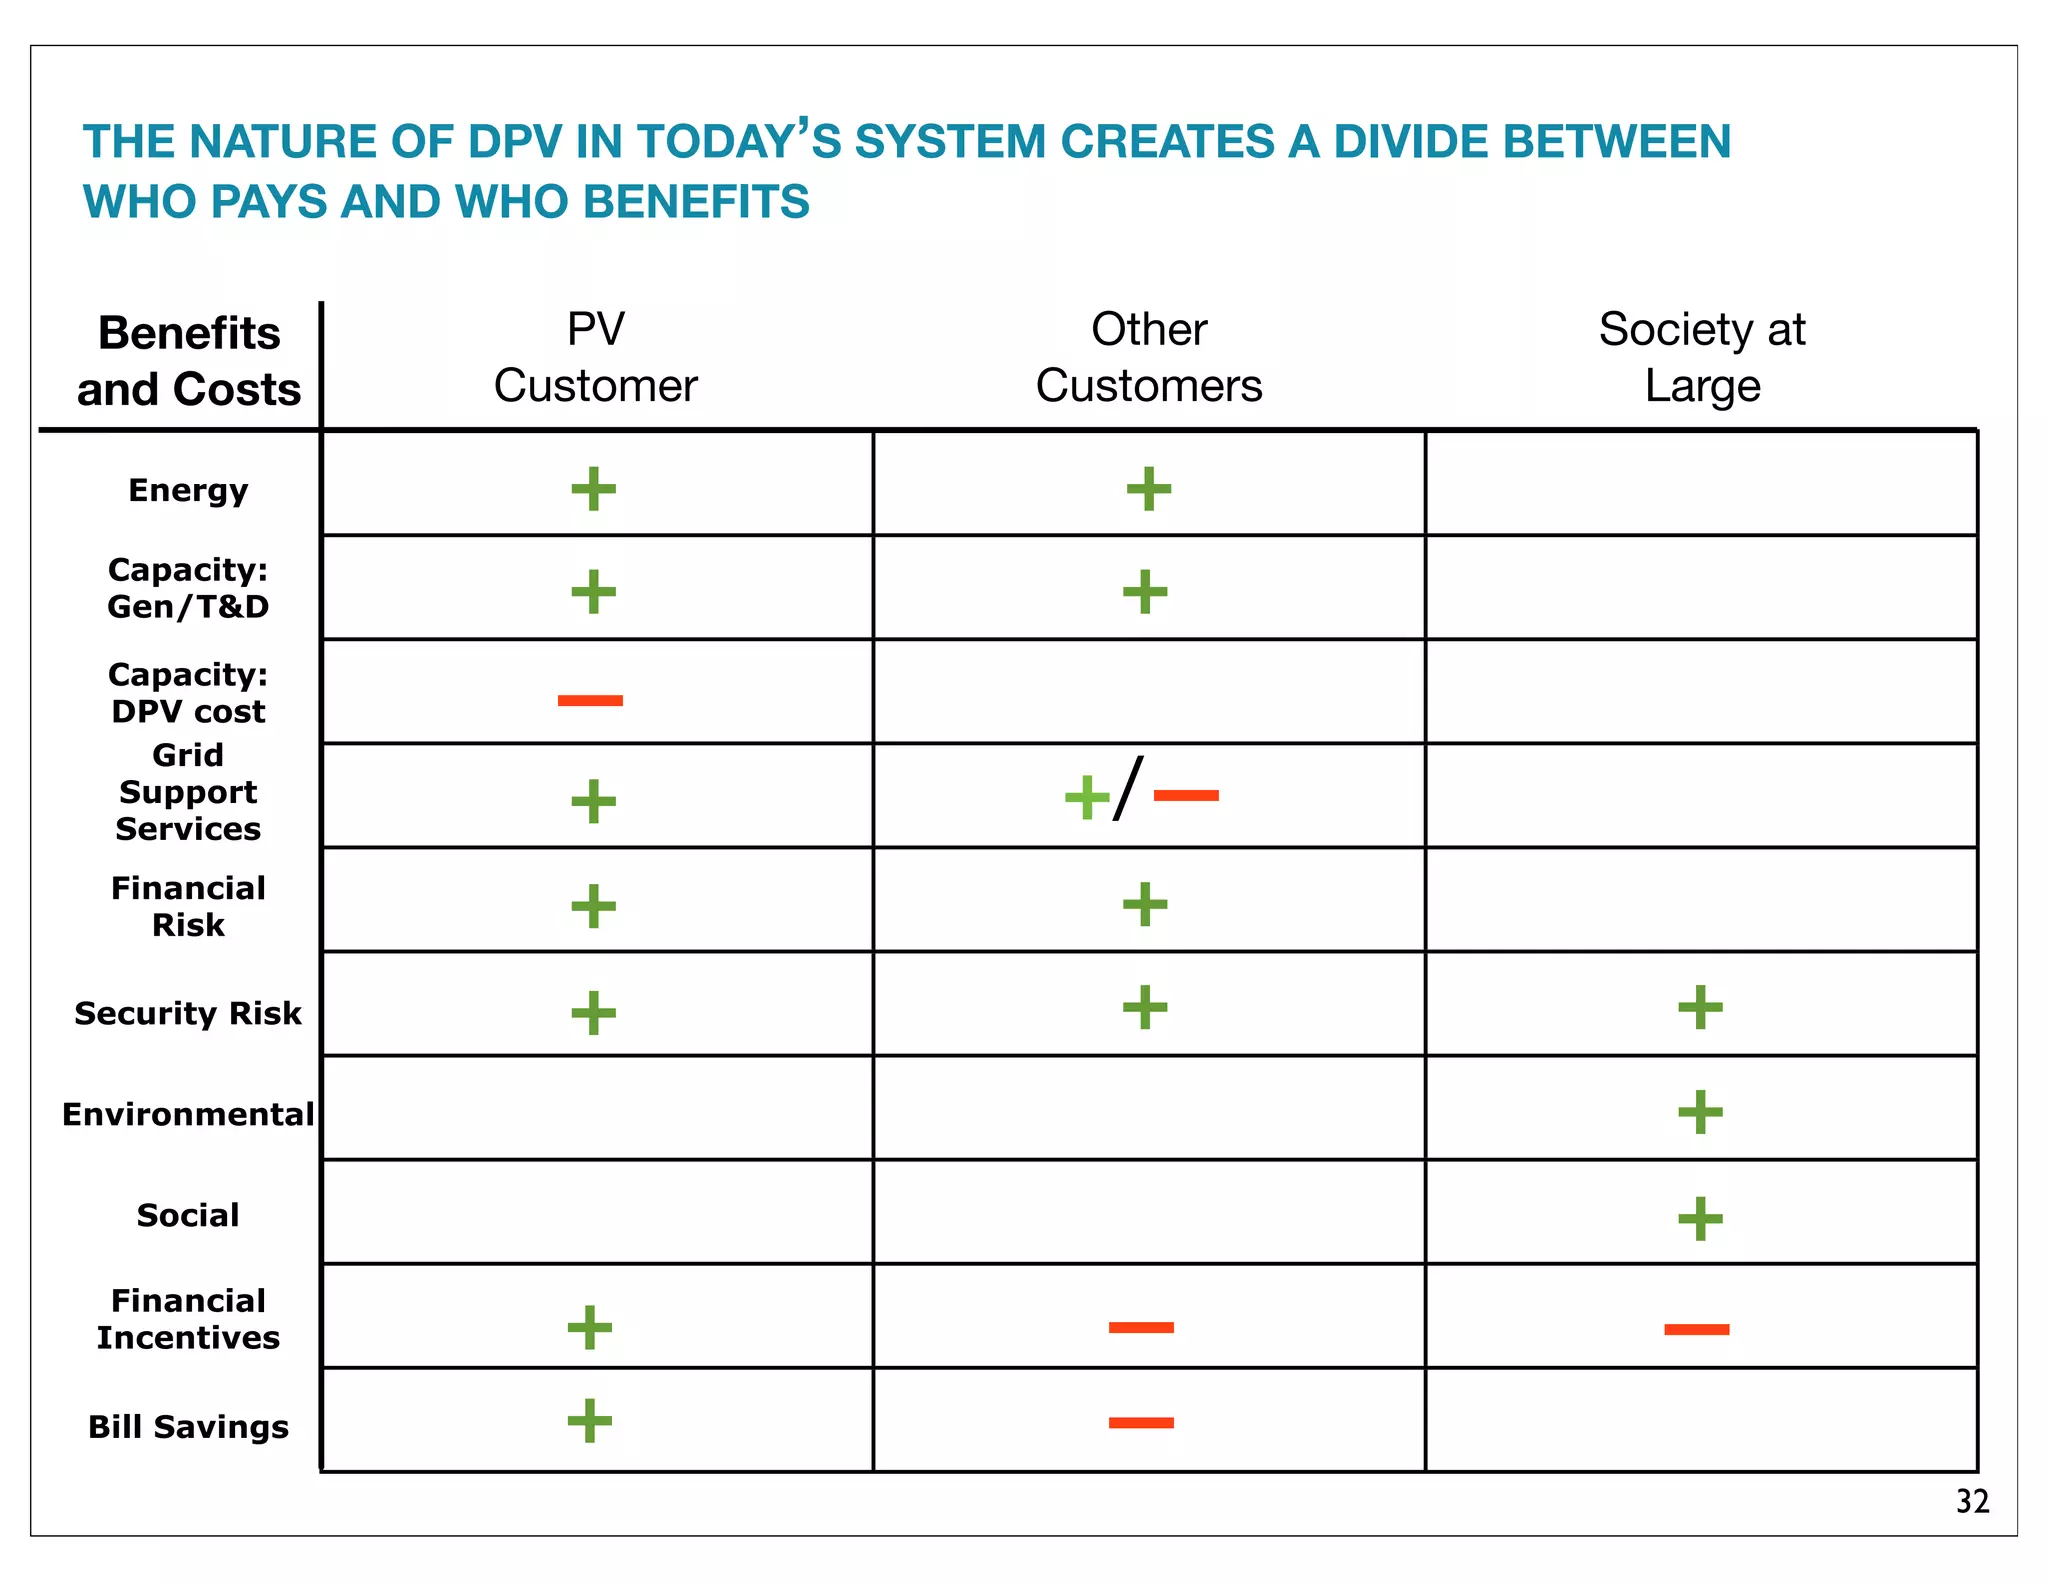
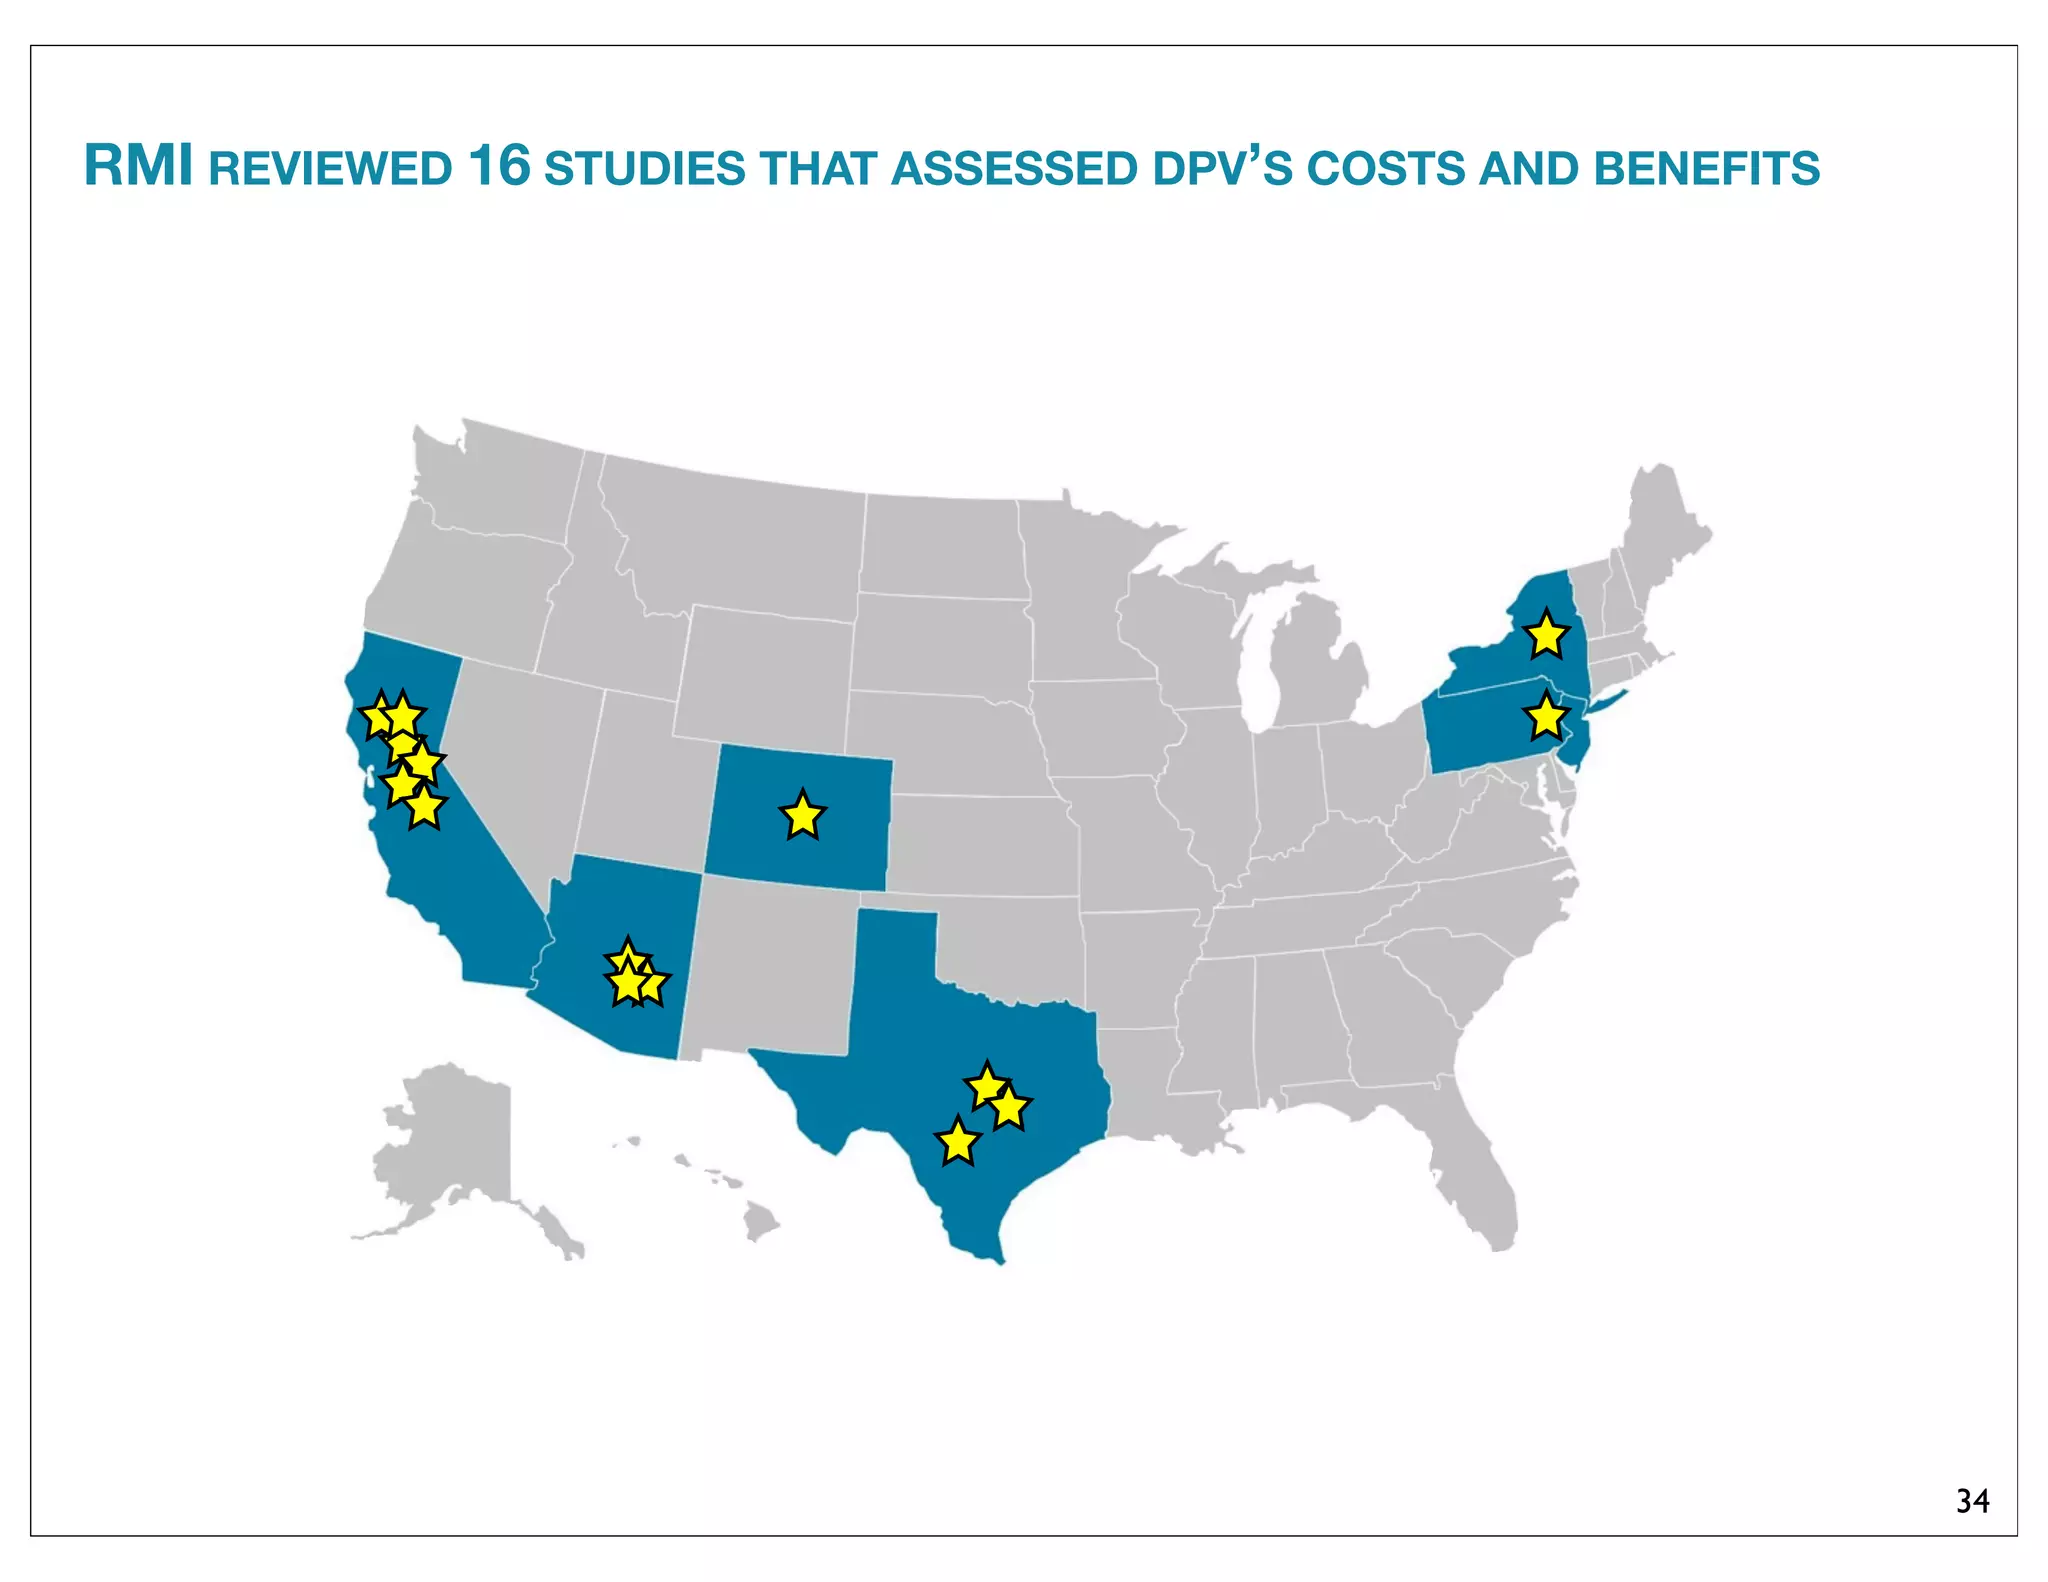
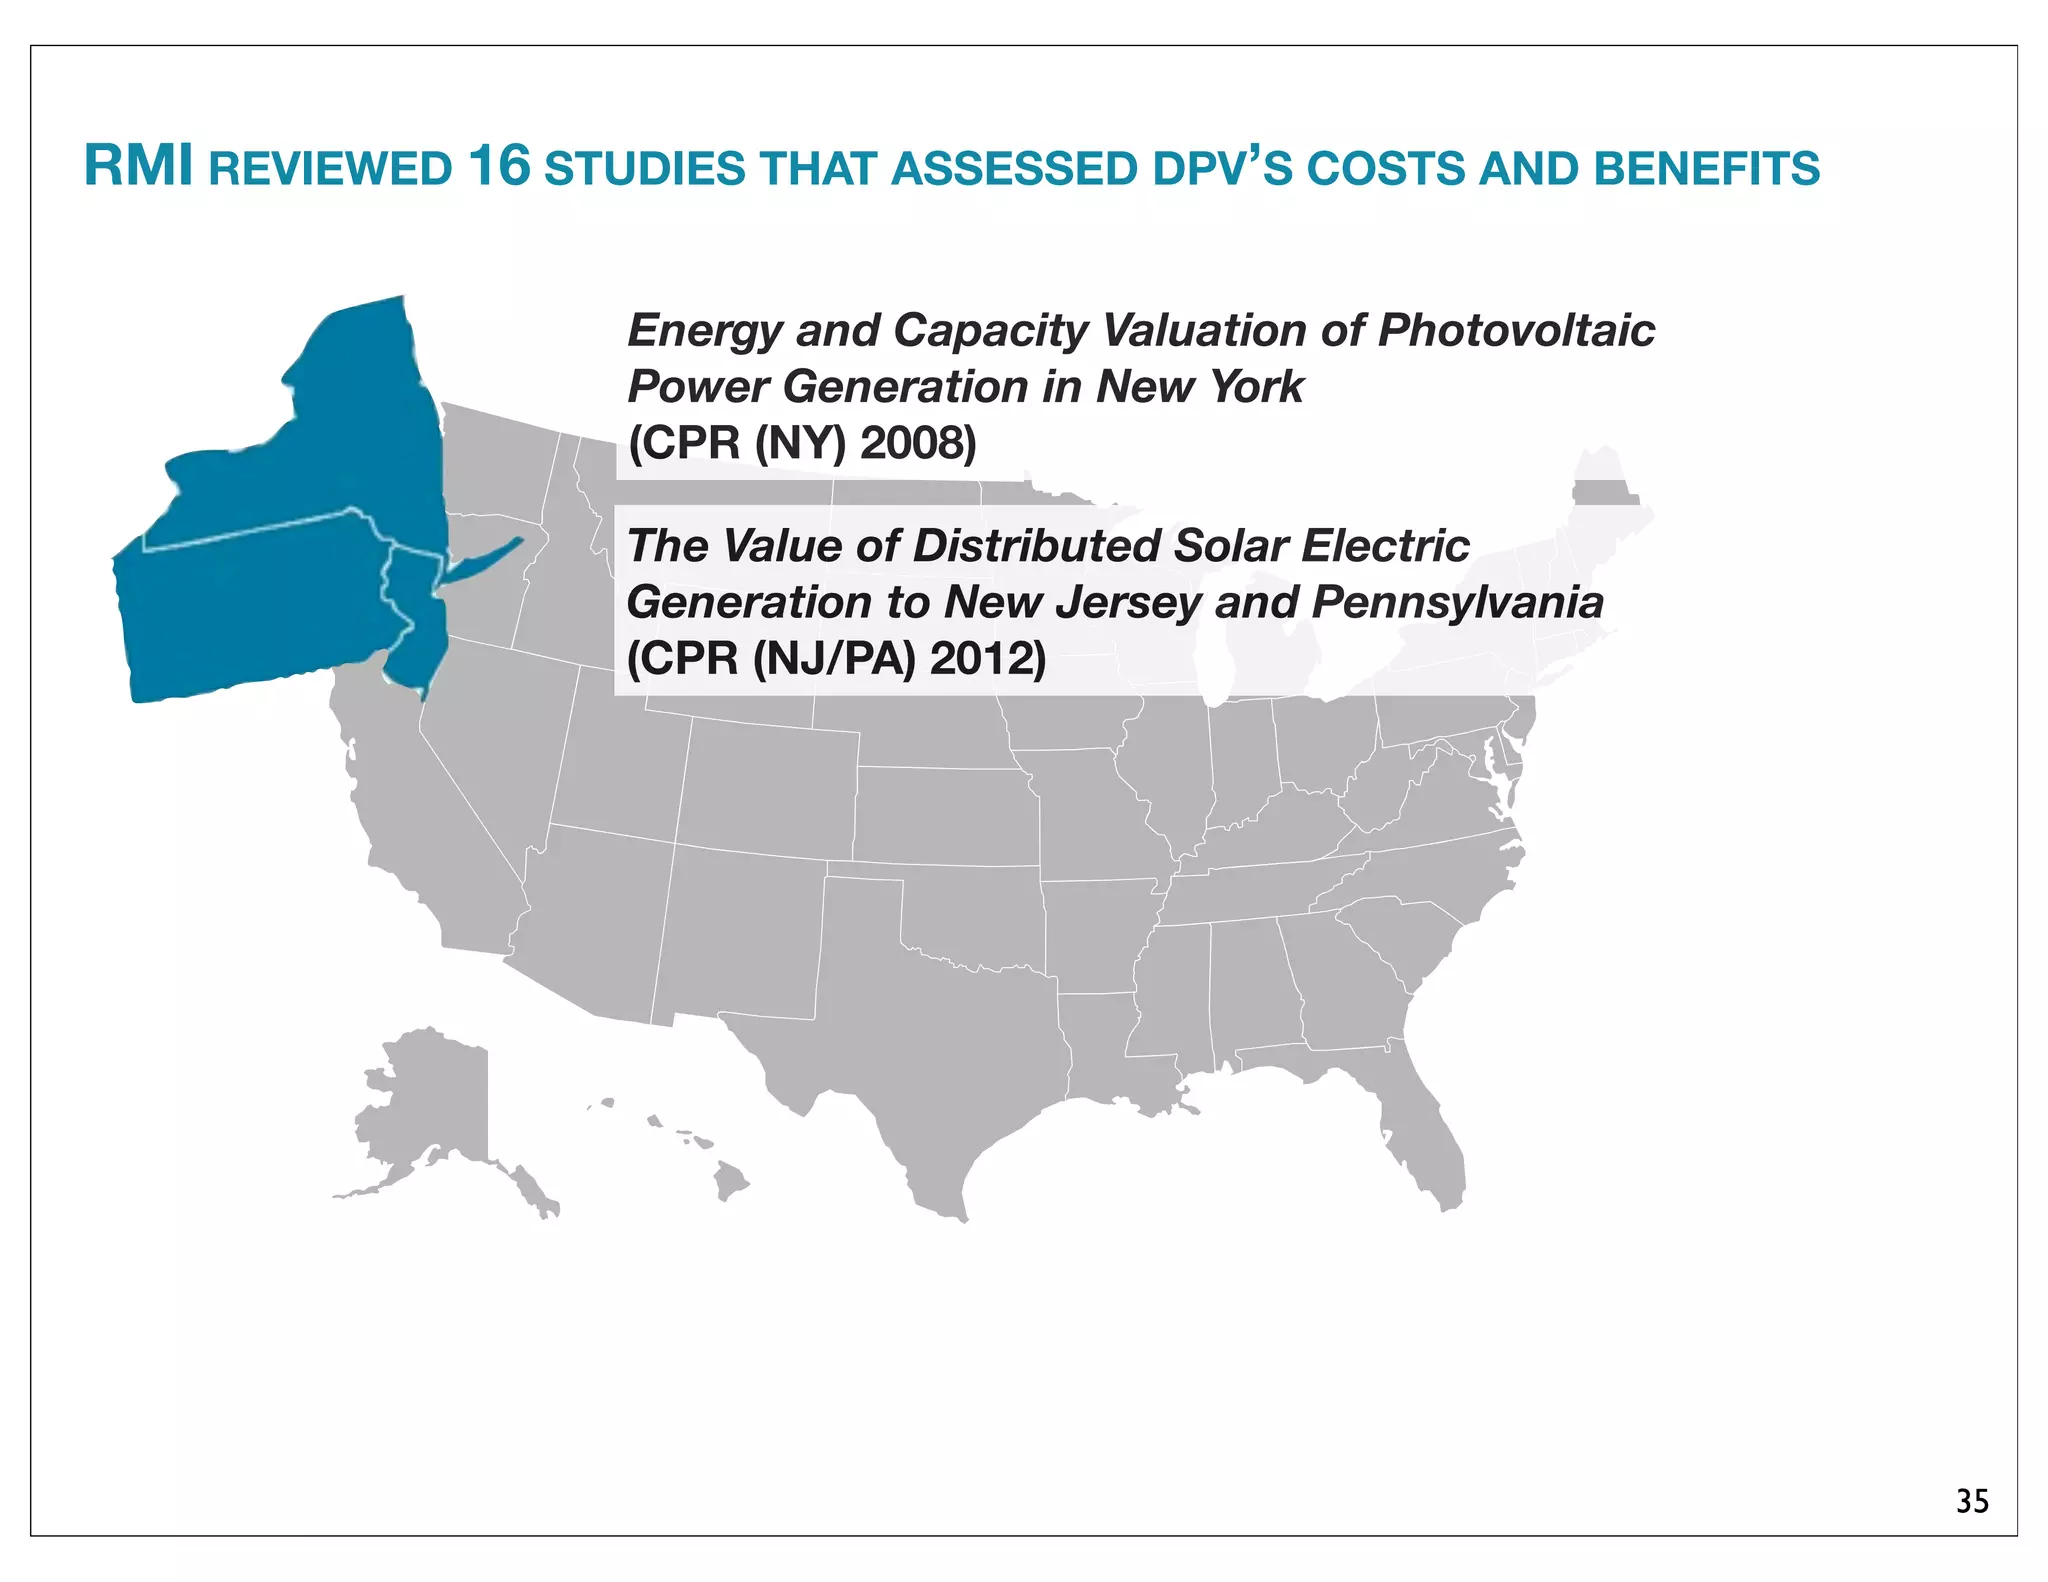
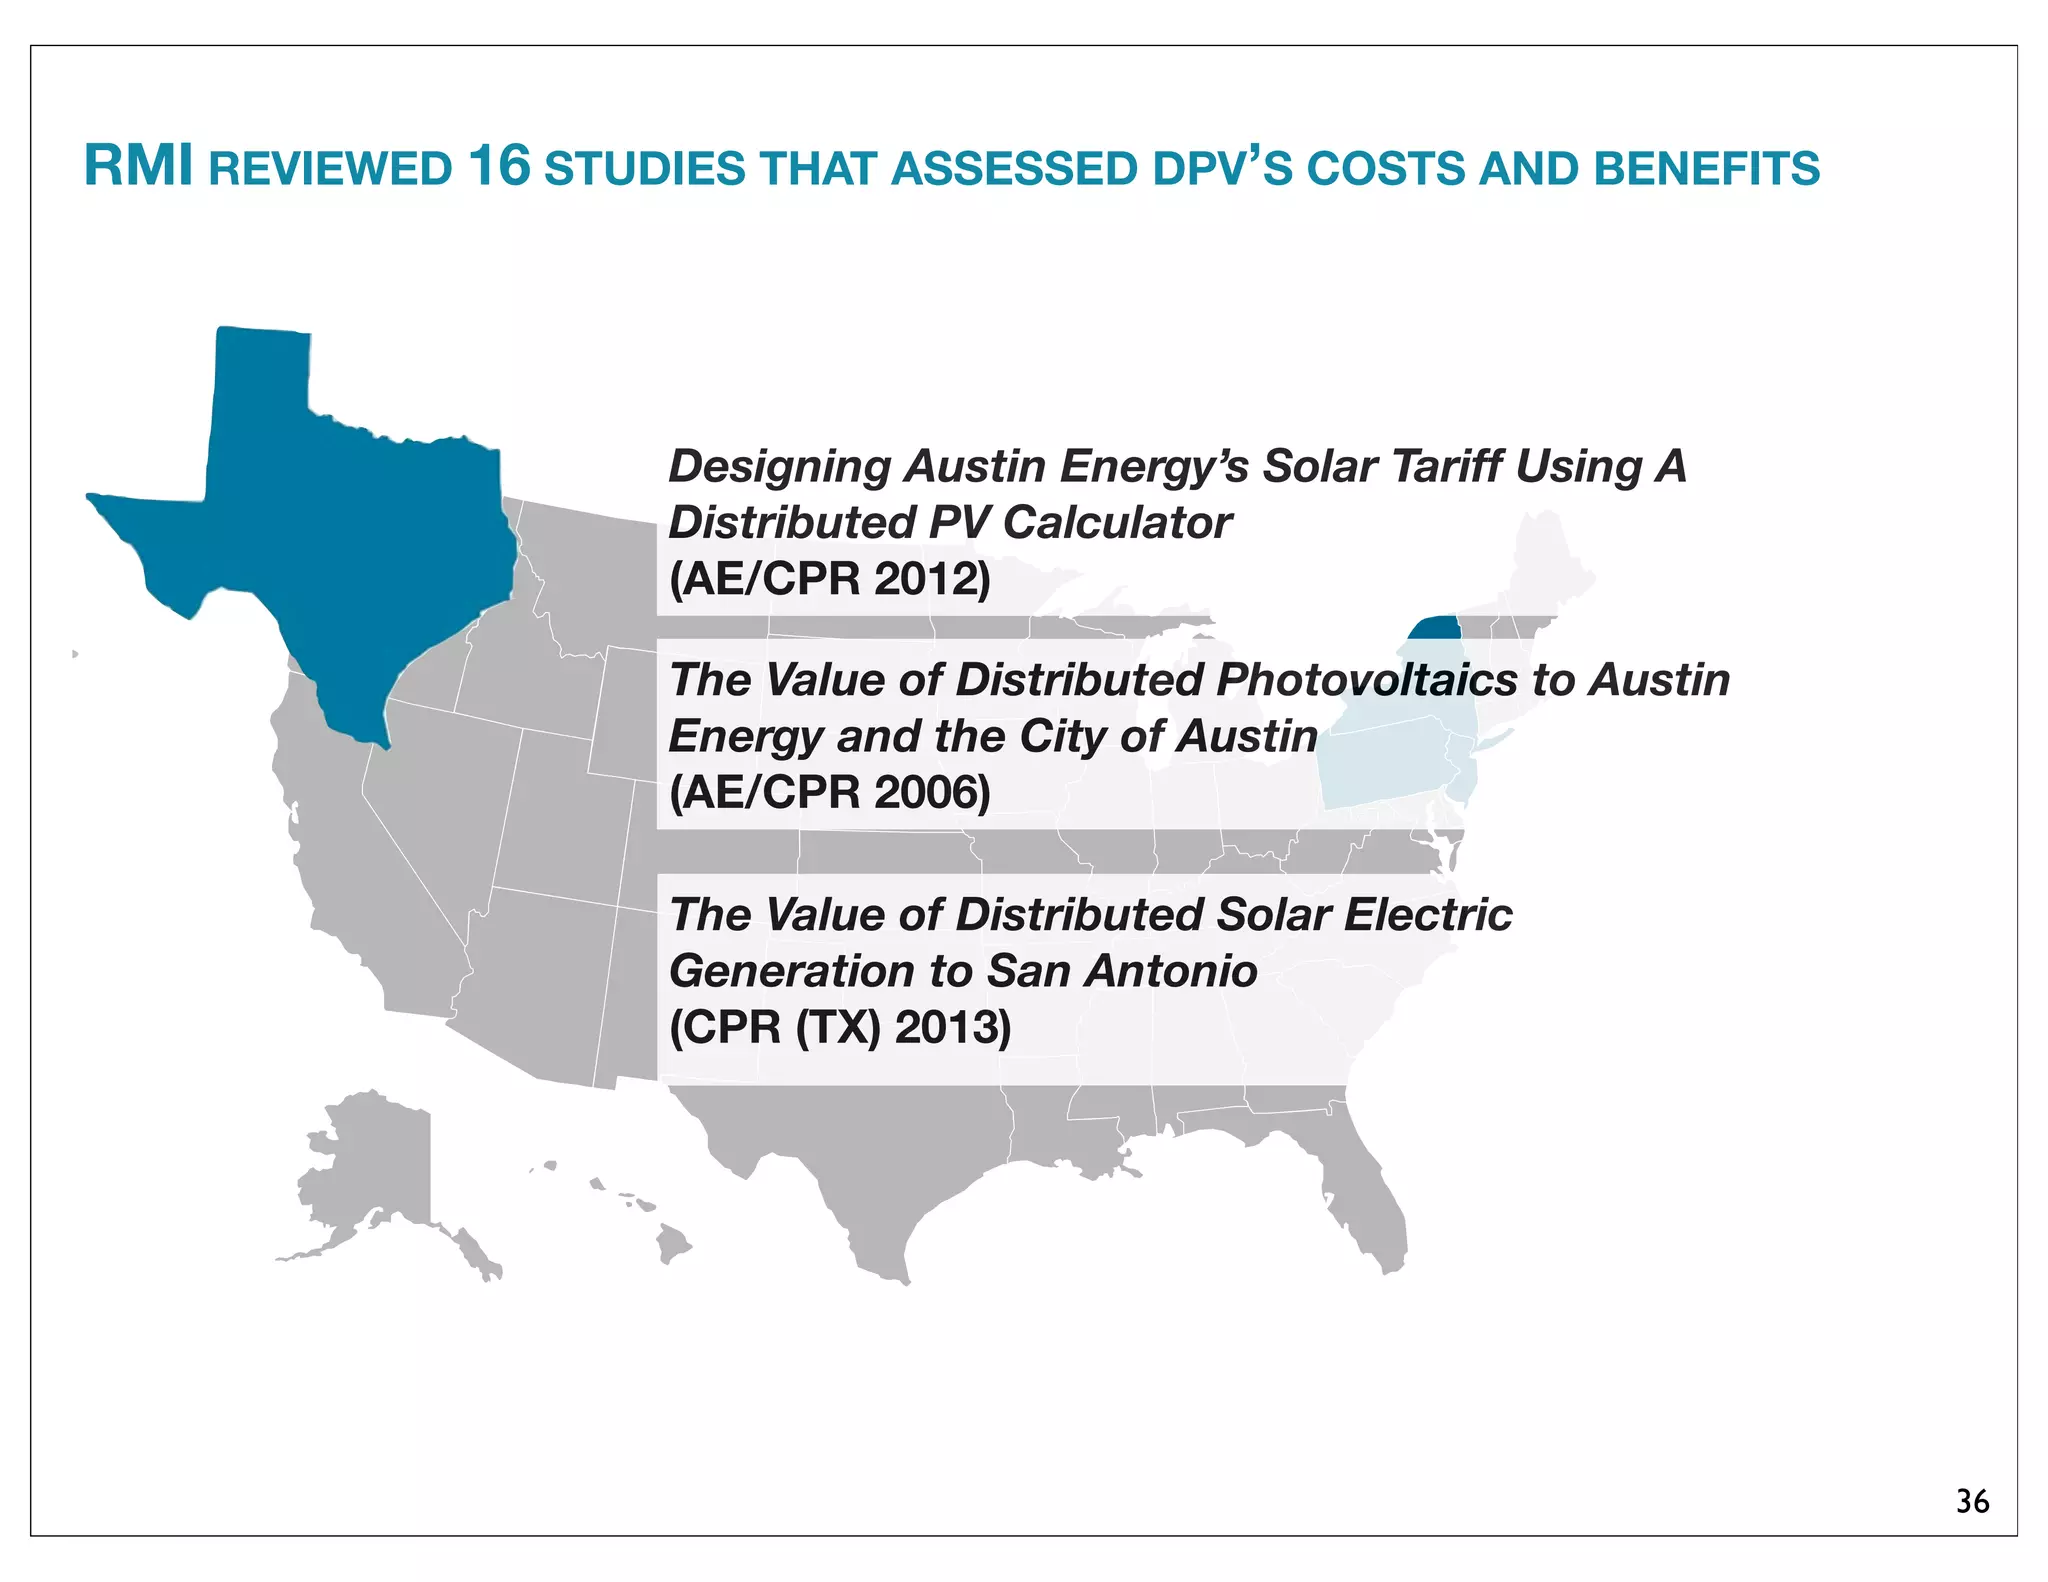
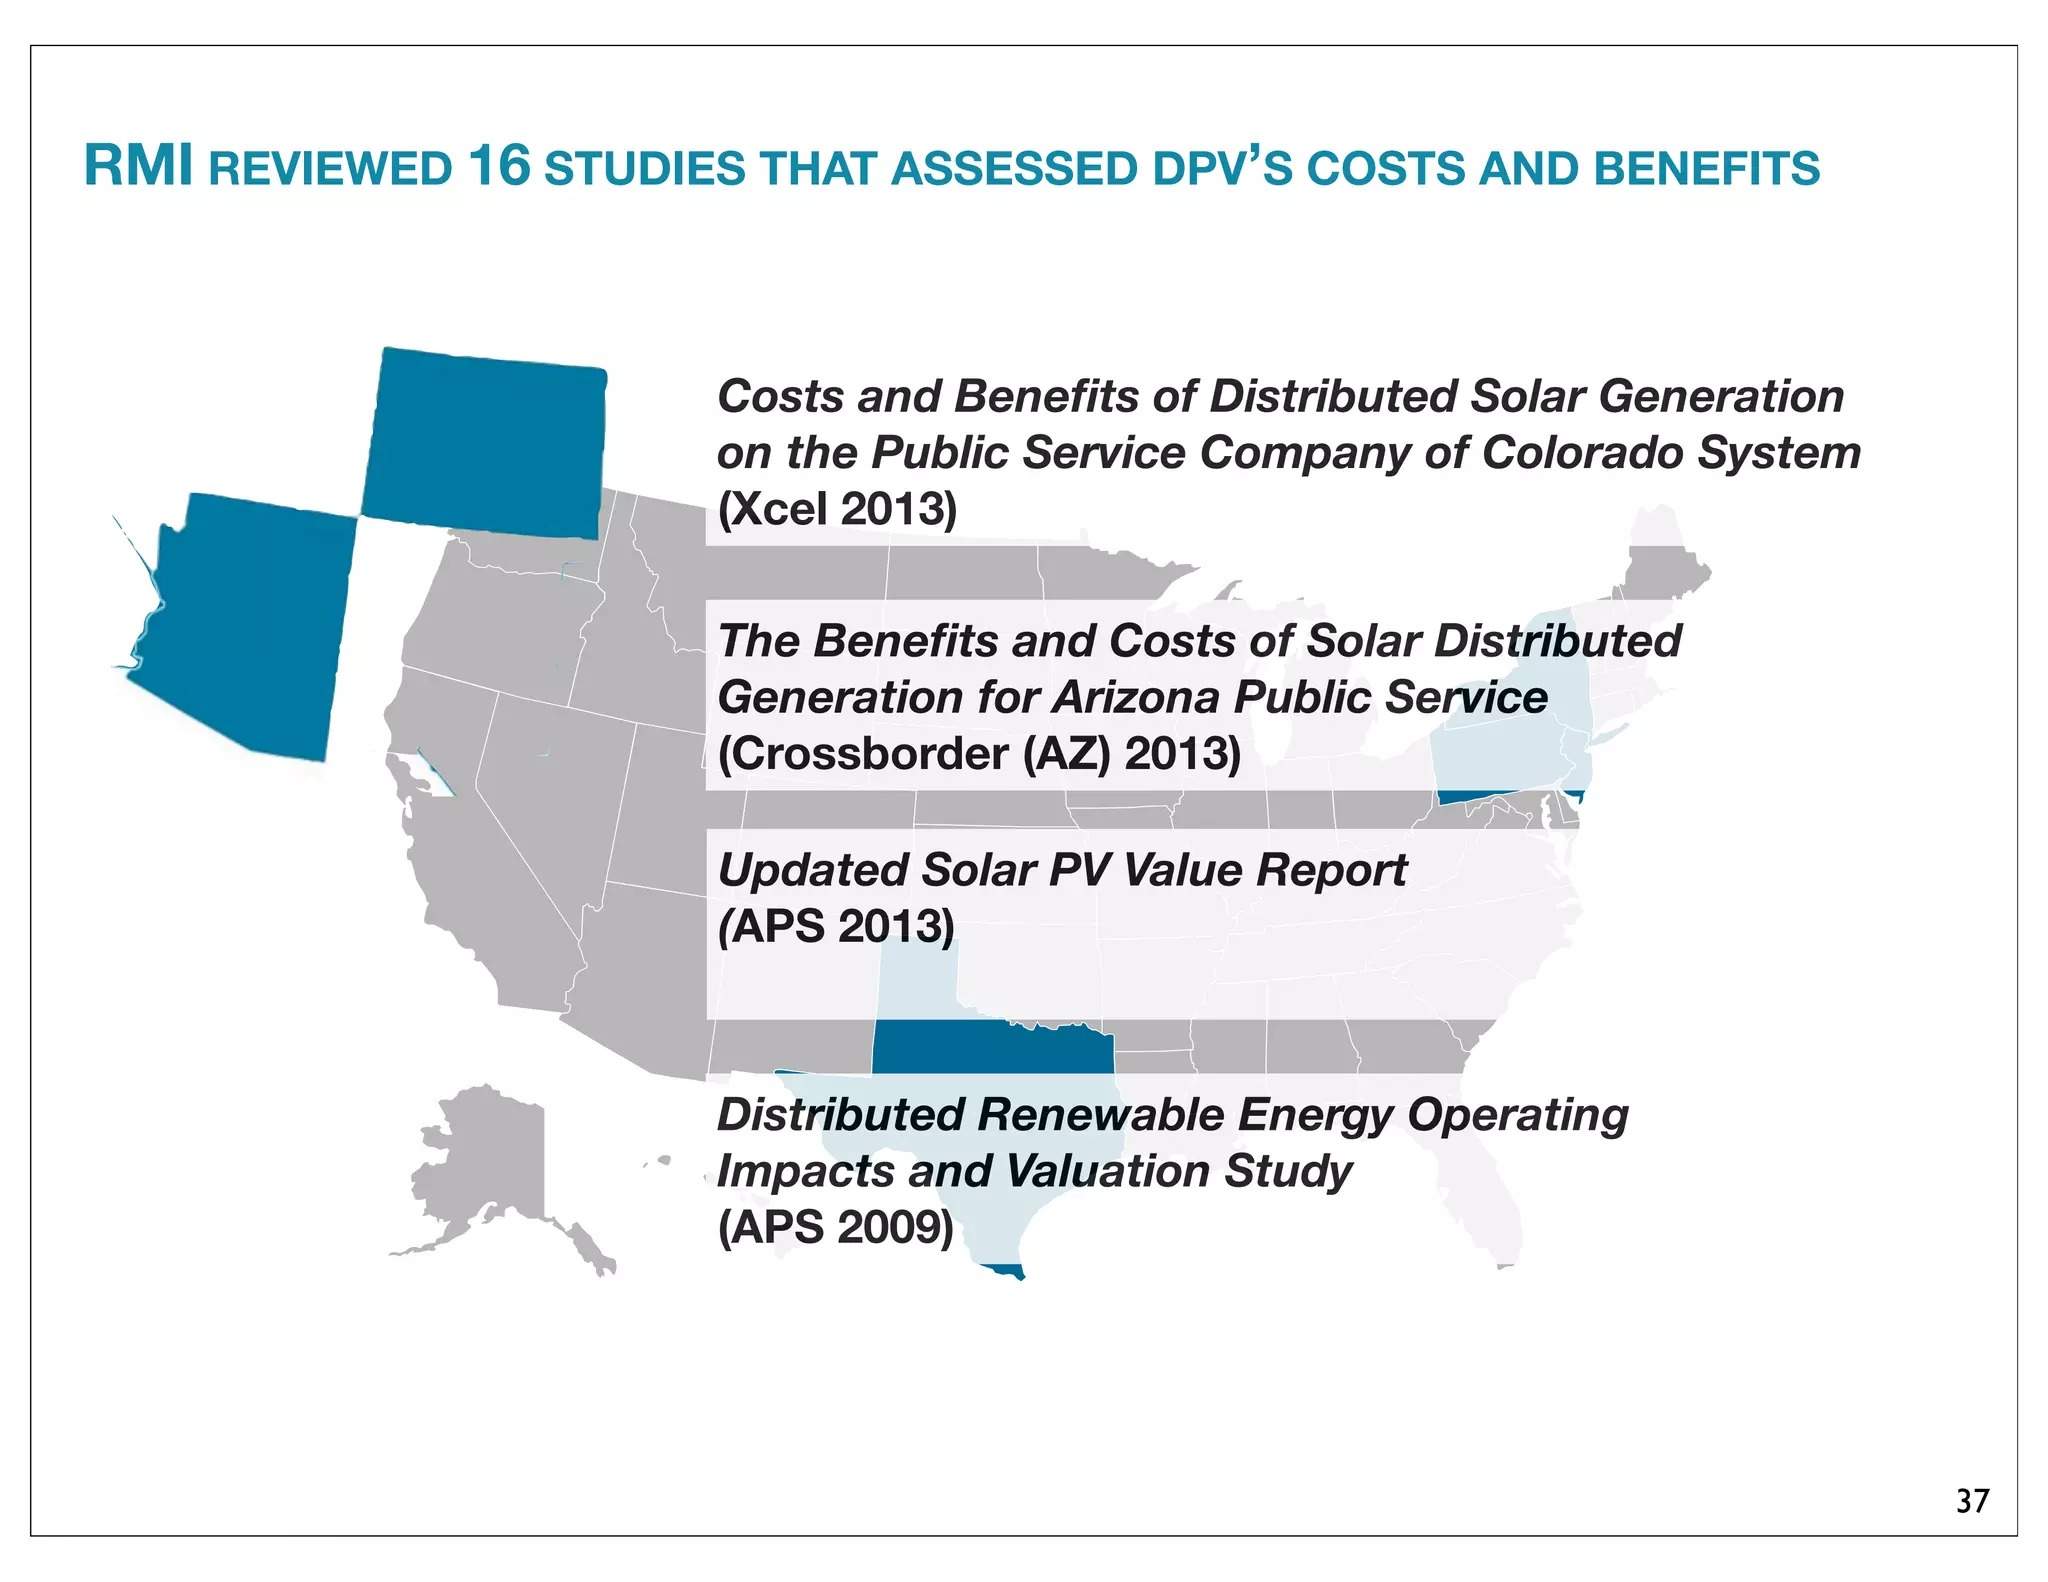
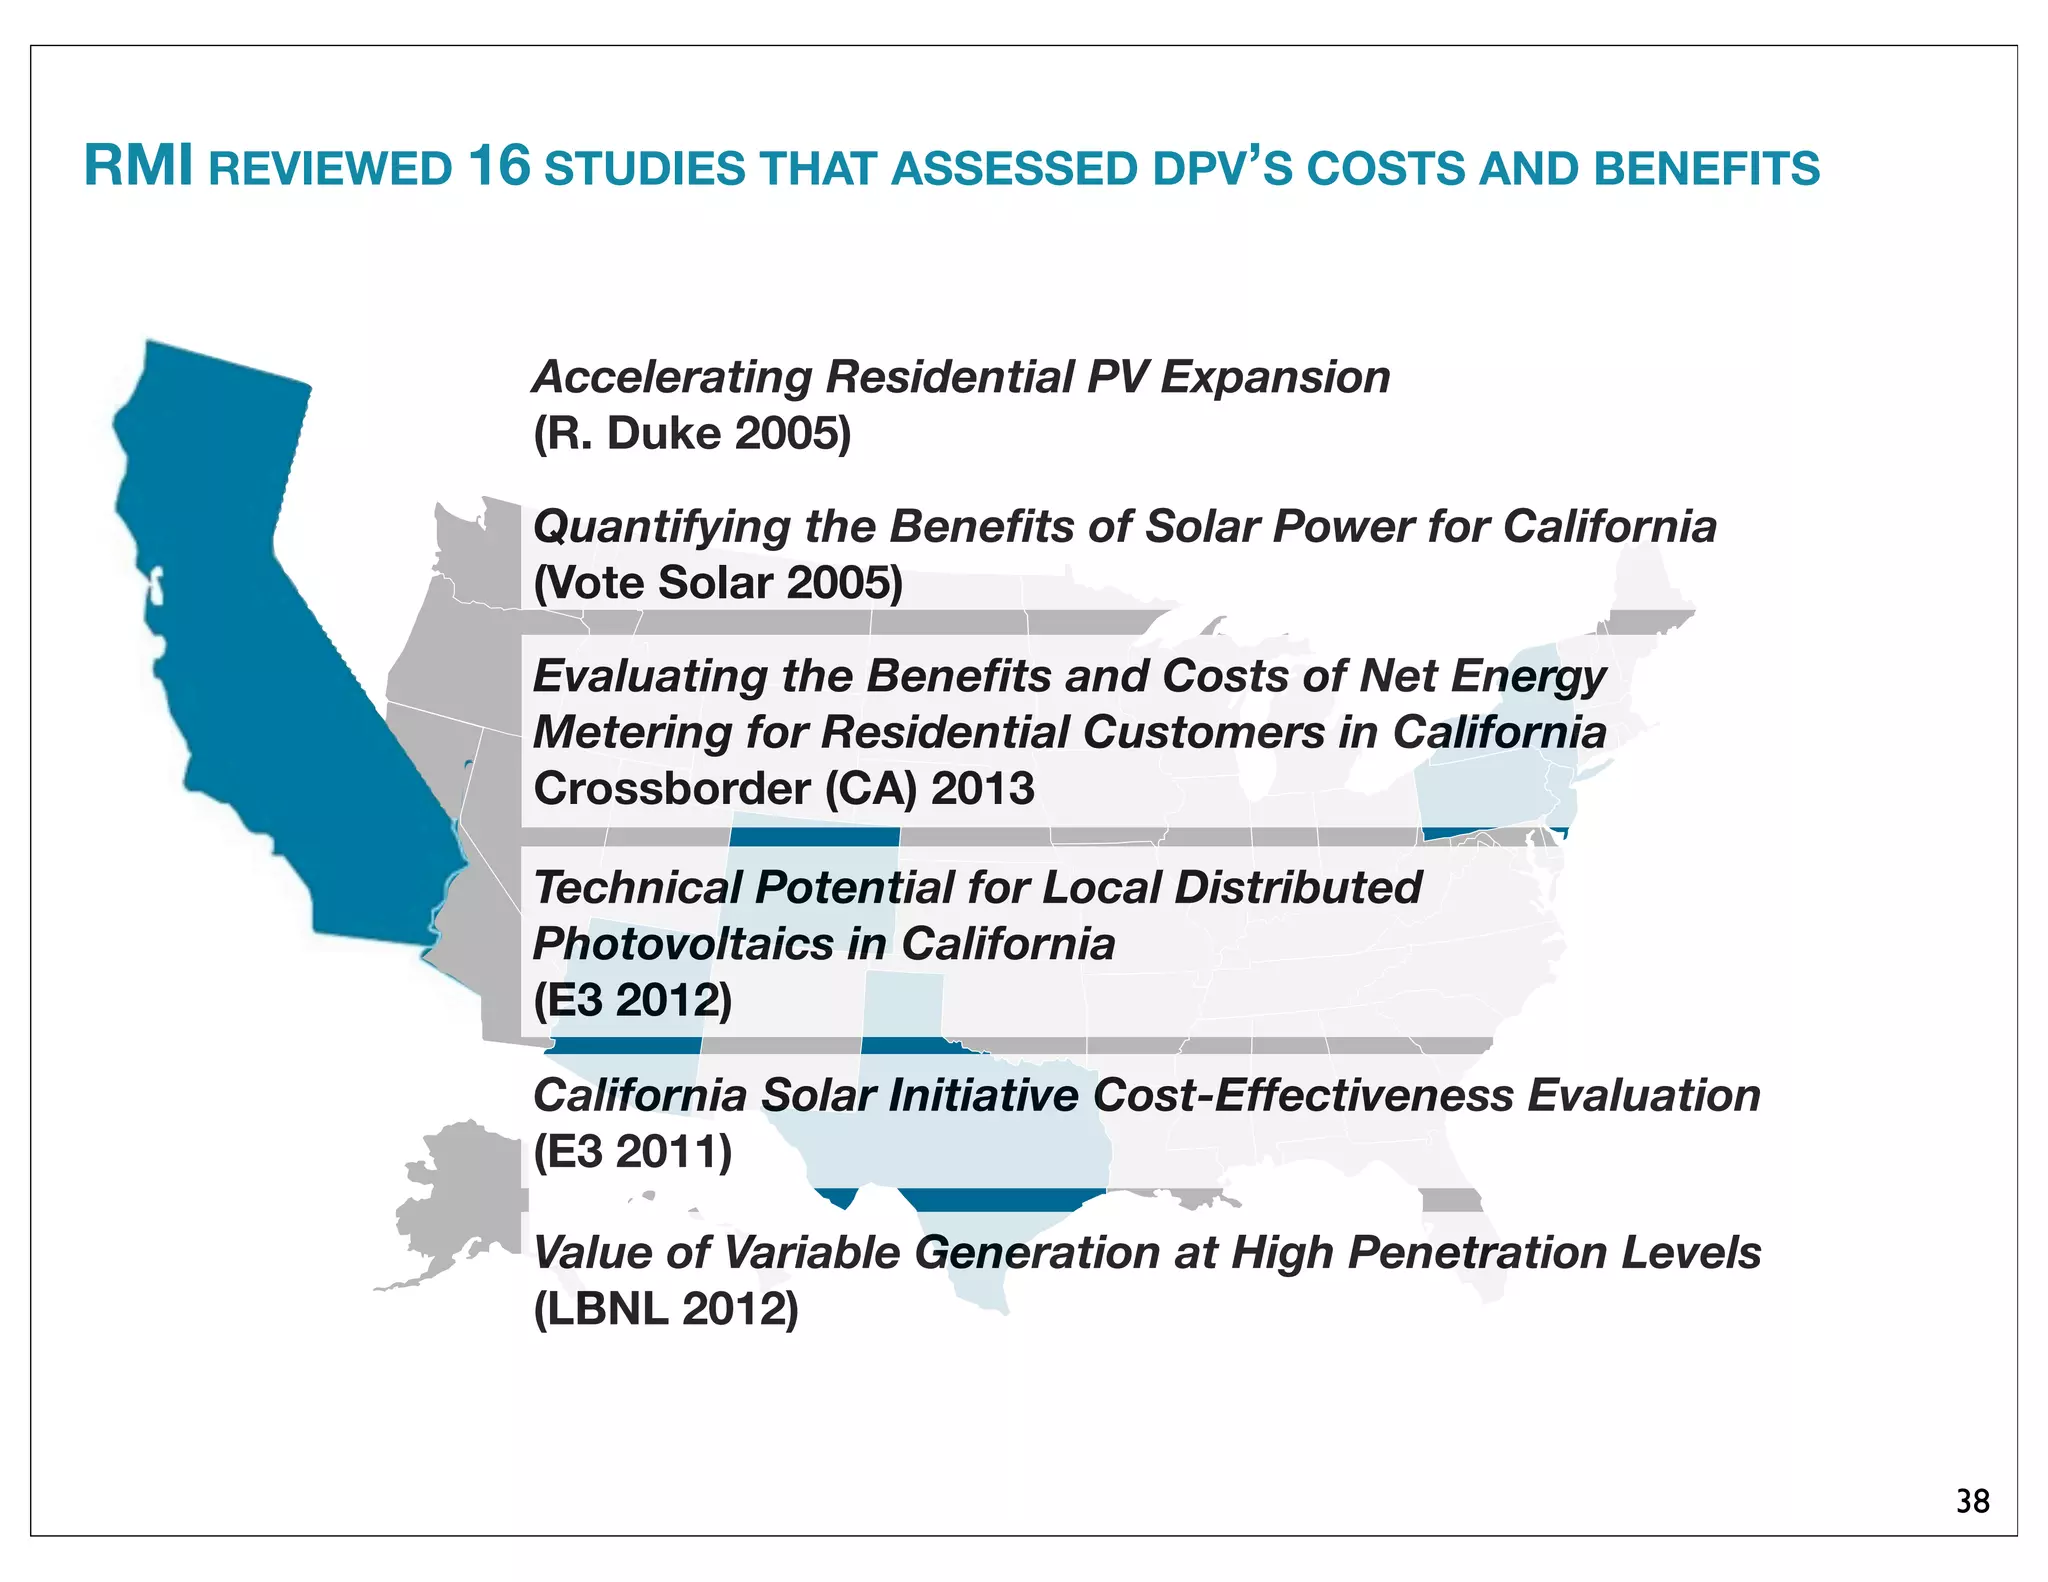
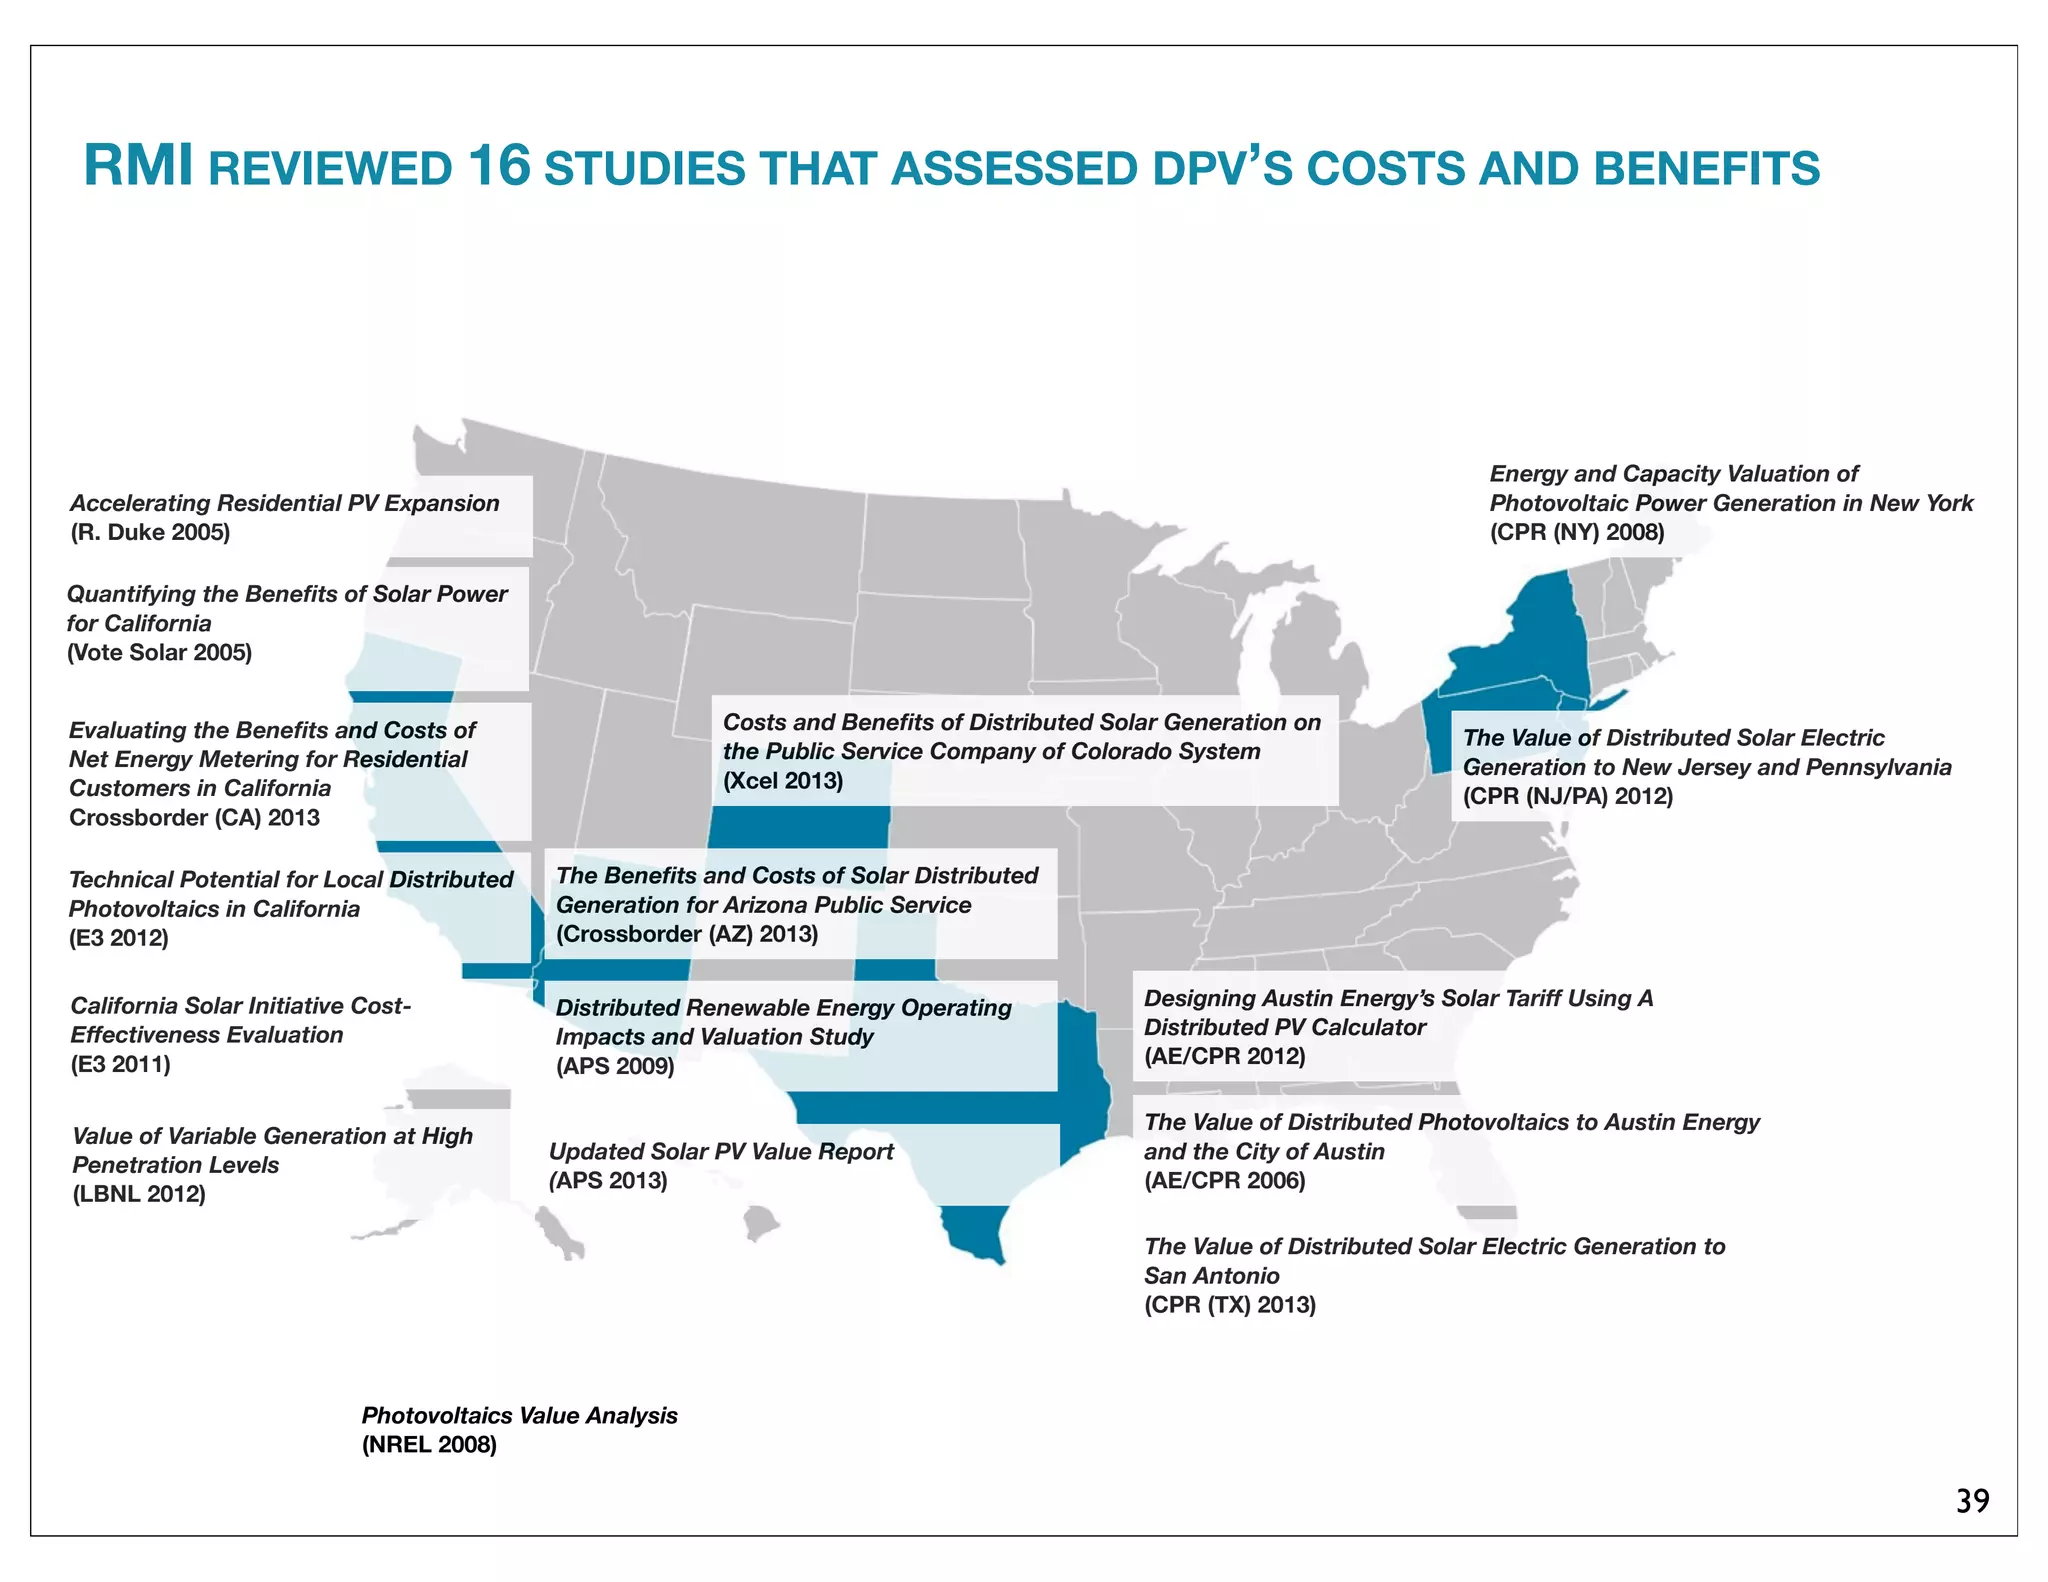
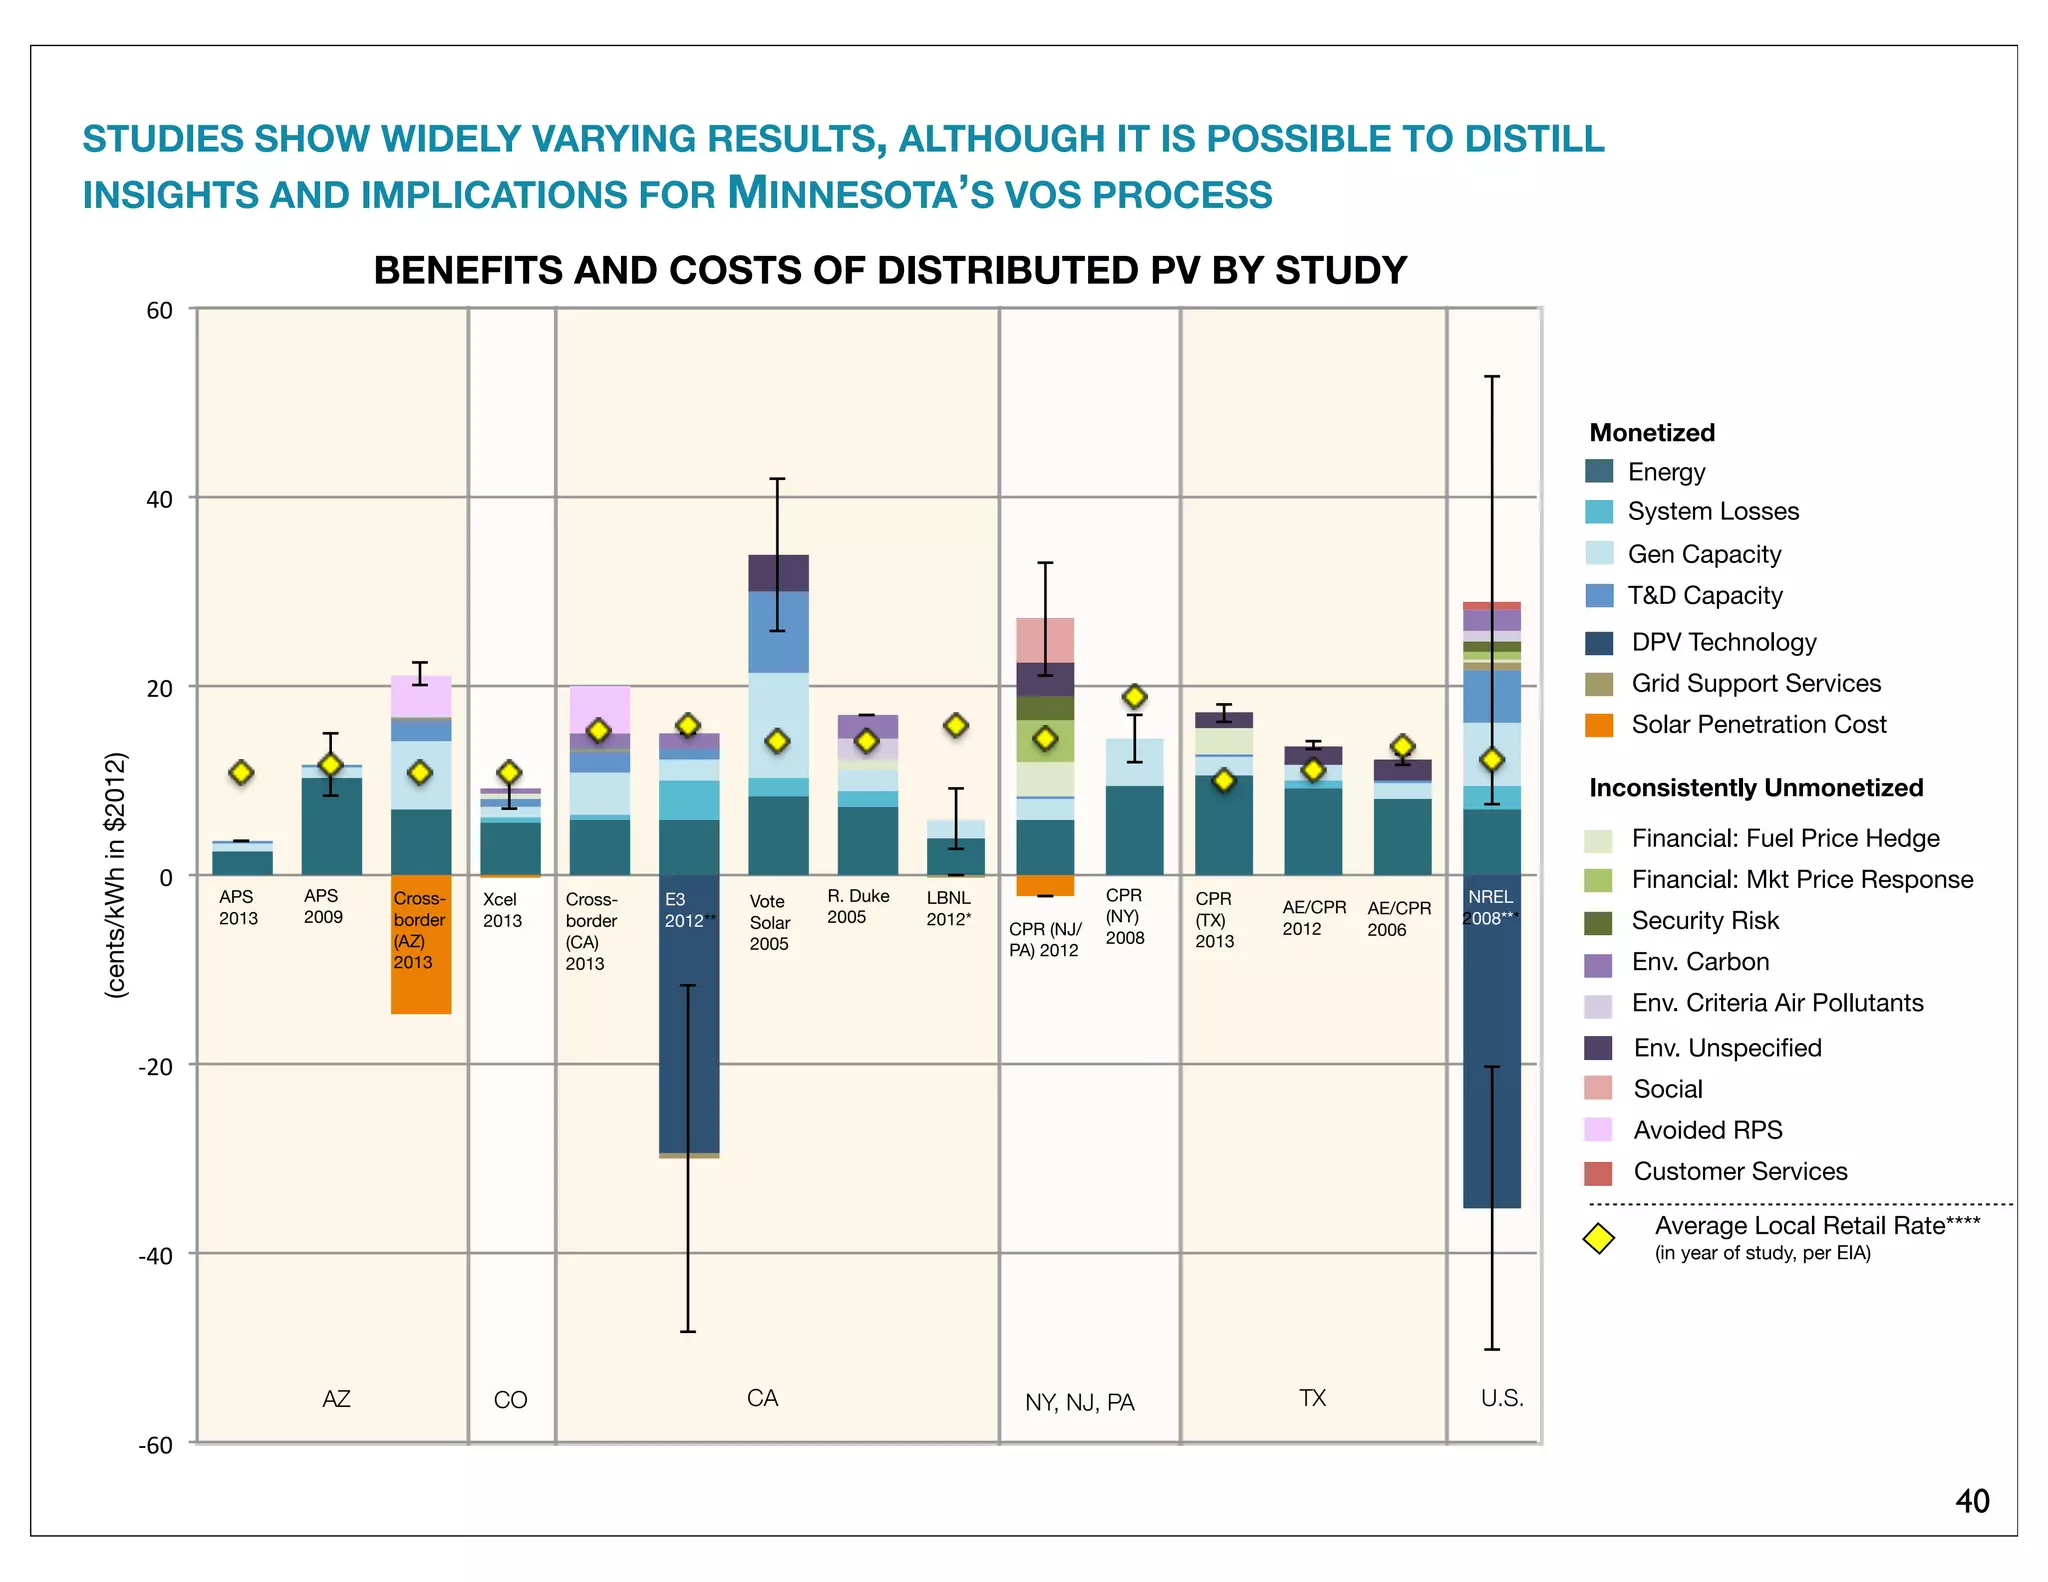
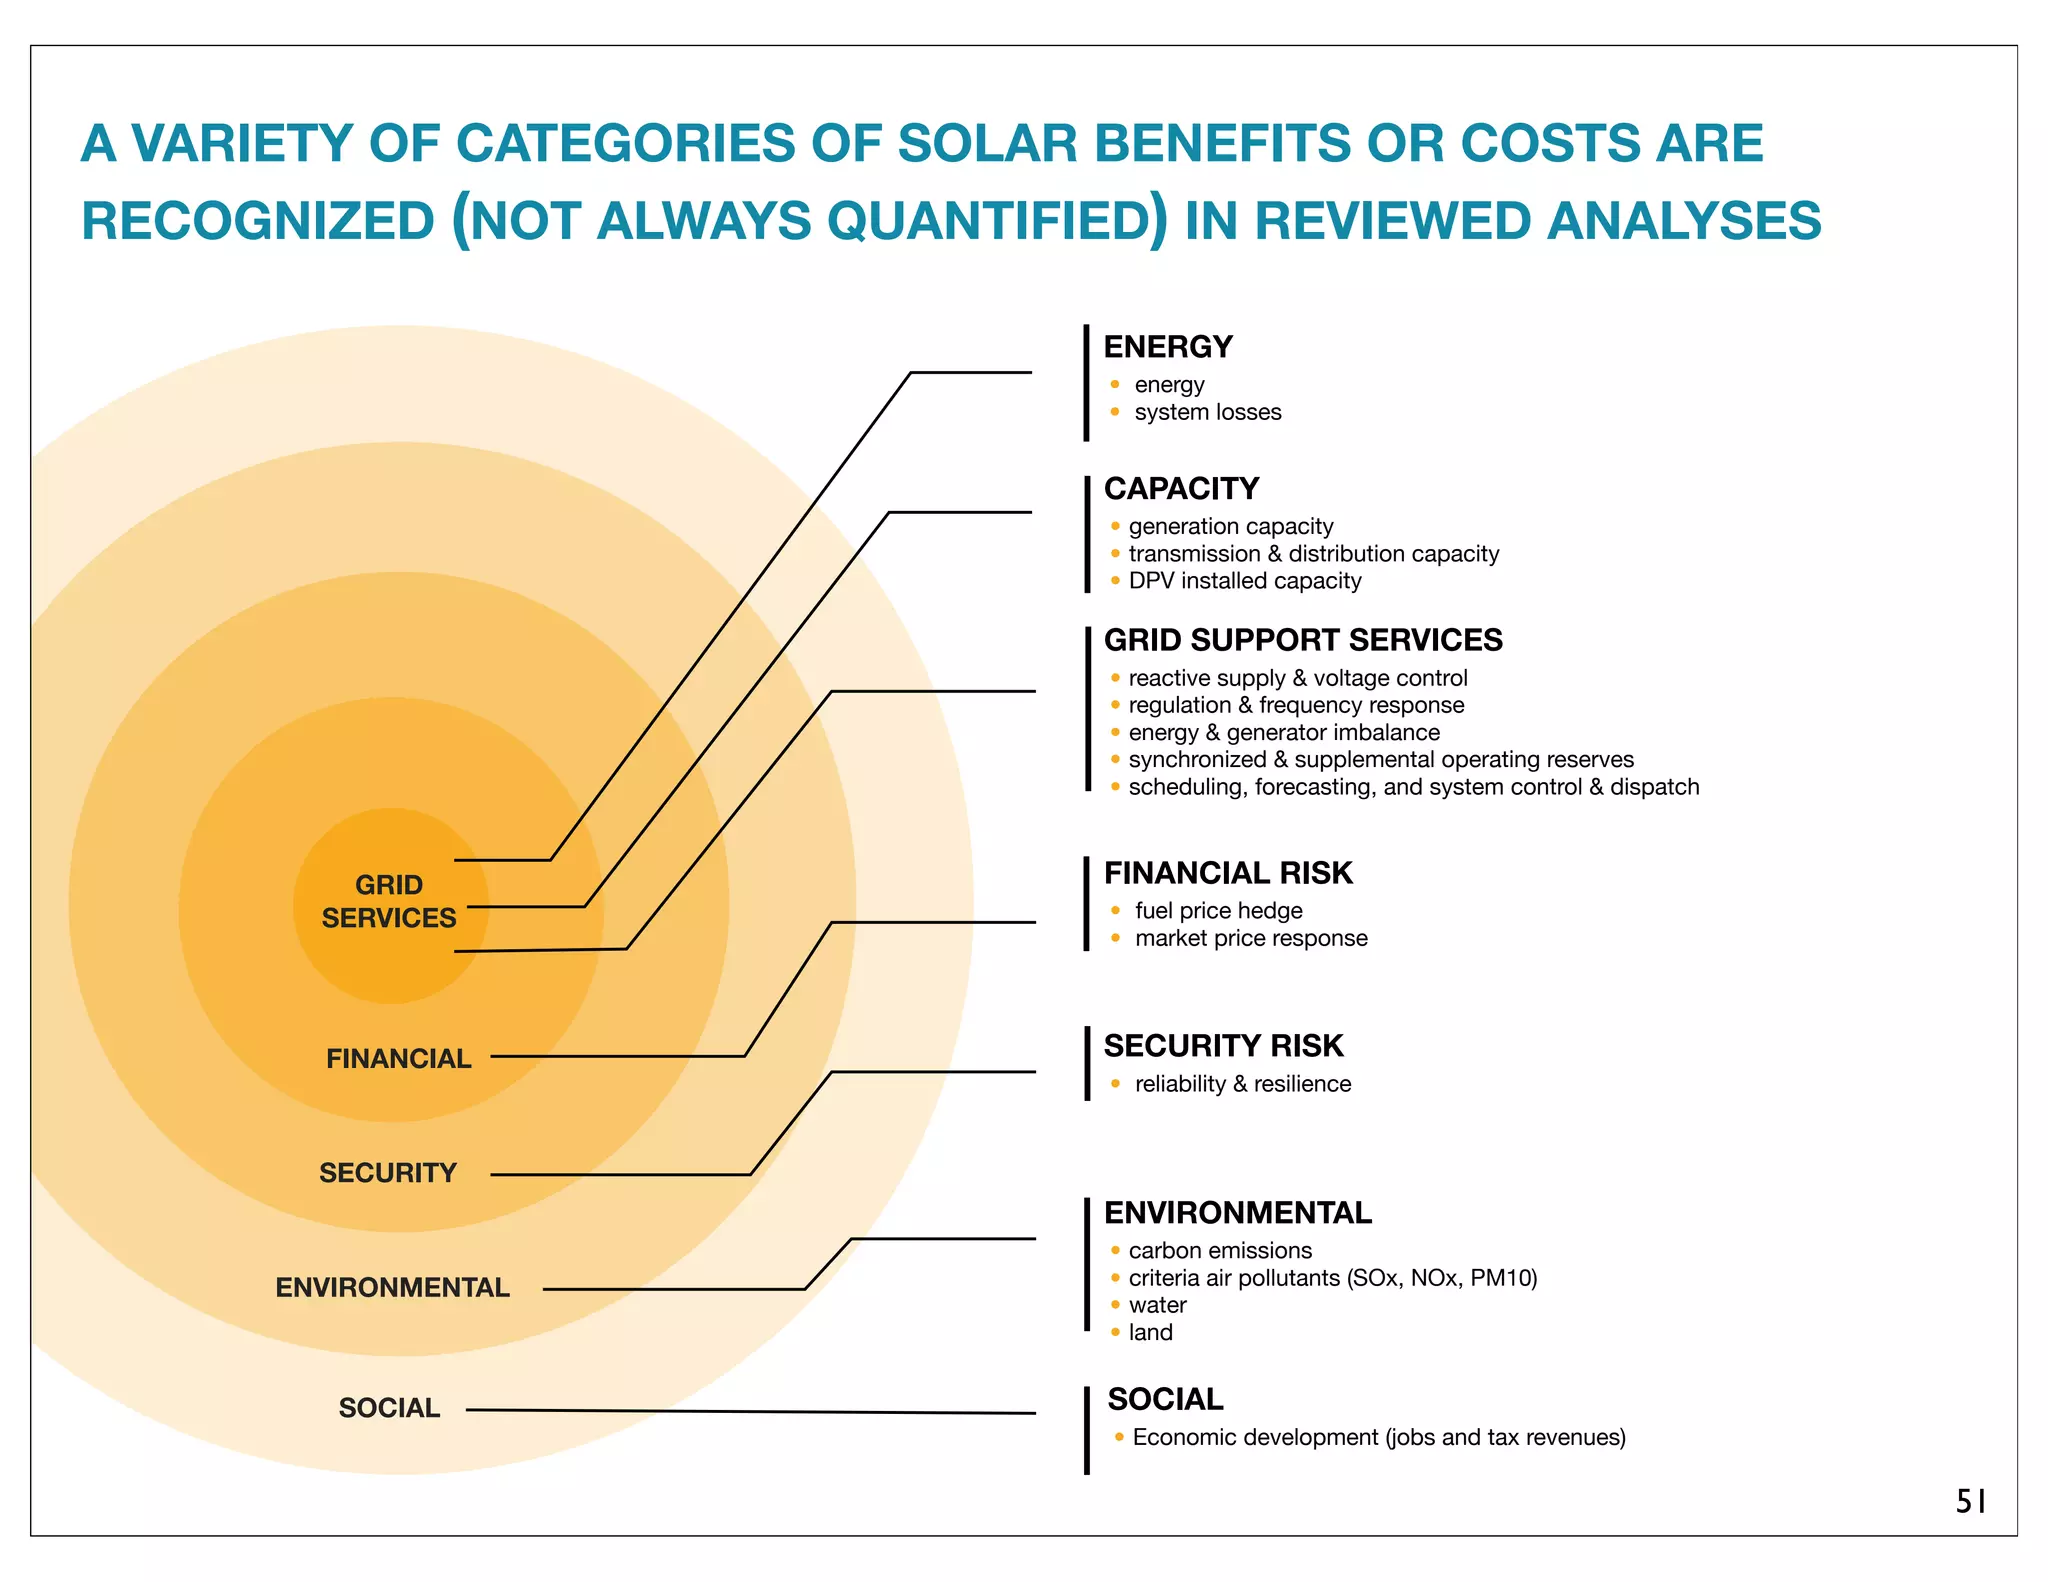


The document reviews solar photovoltaic (PV) benefit and cost studies, highlighting the growing adoption of distributed resources like solar and their economic implications. It discusses the misalignments in recognizing and allocating the benefits and costs of distributed solar, and how differing stakeholder perspectives affect these evaluations. The analysis draws on findings from multiple studies to inform the ongoing discussion about the value of distributed solar energy.


