Downloaded 179 times
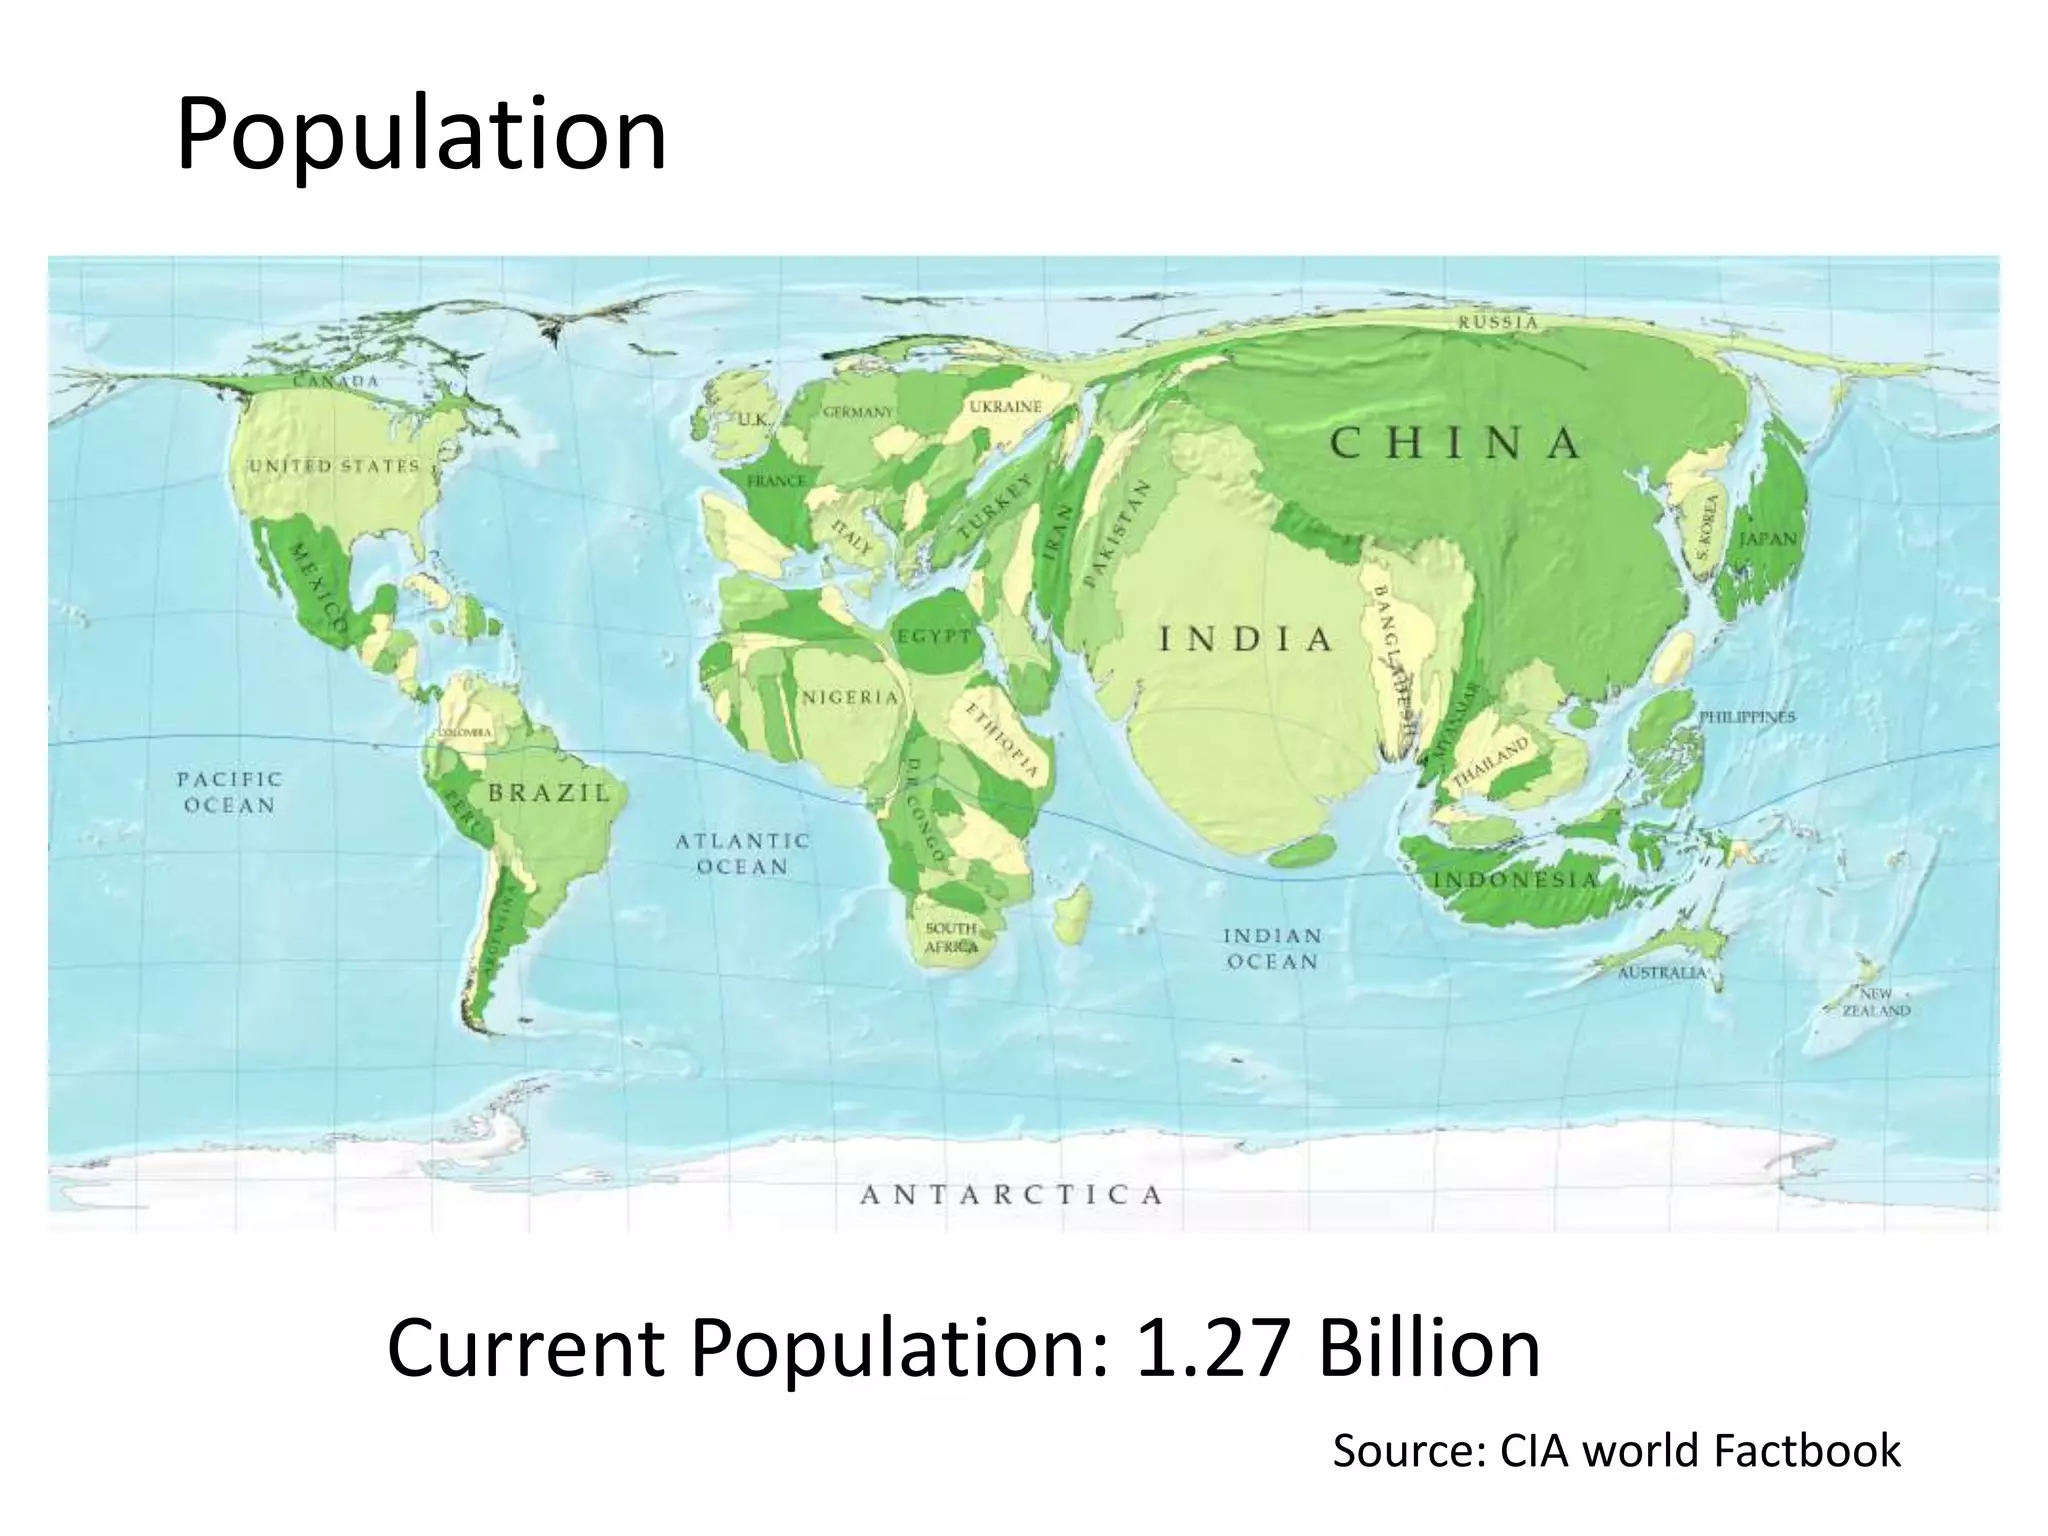
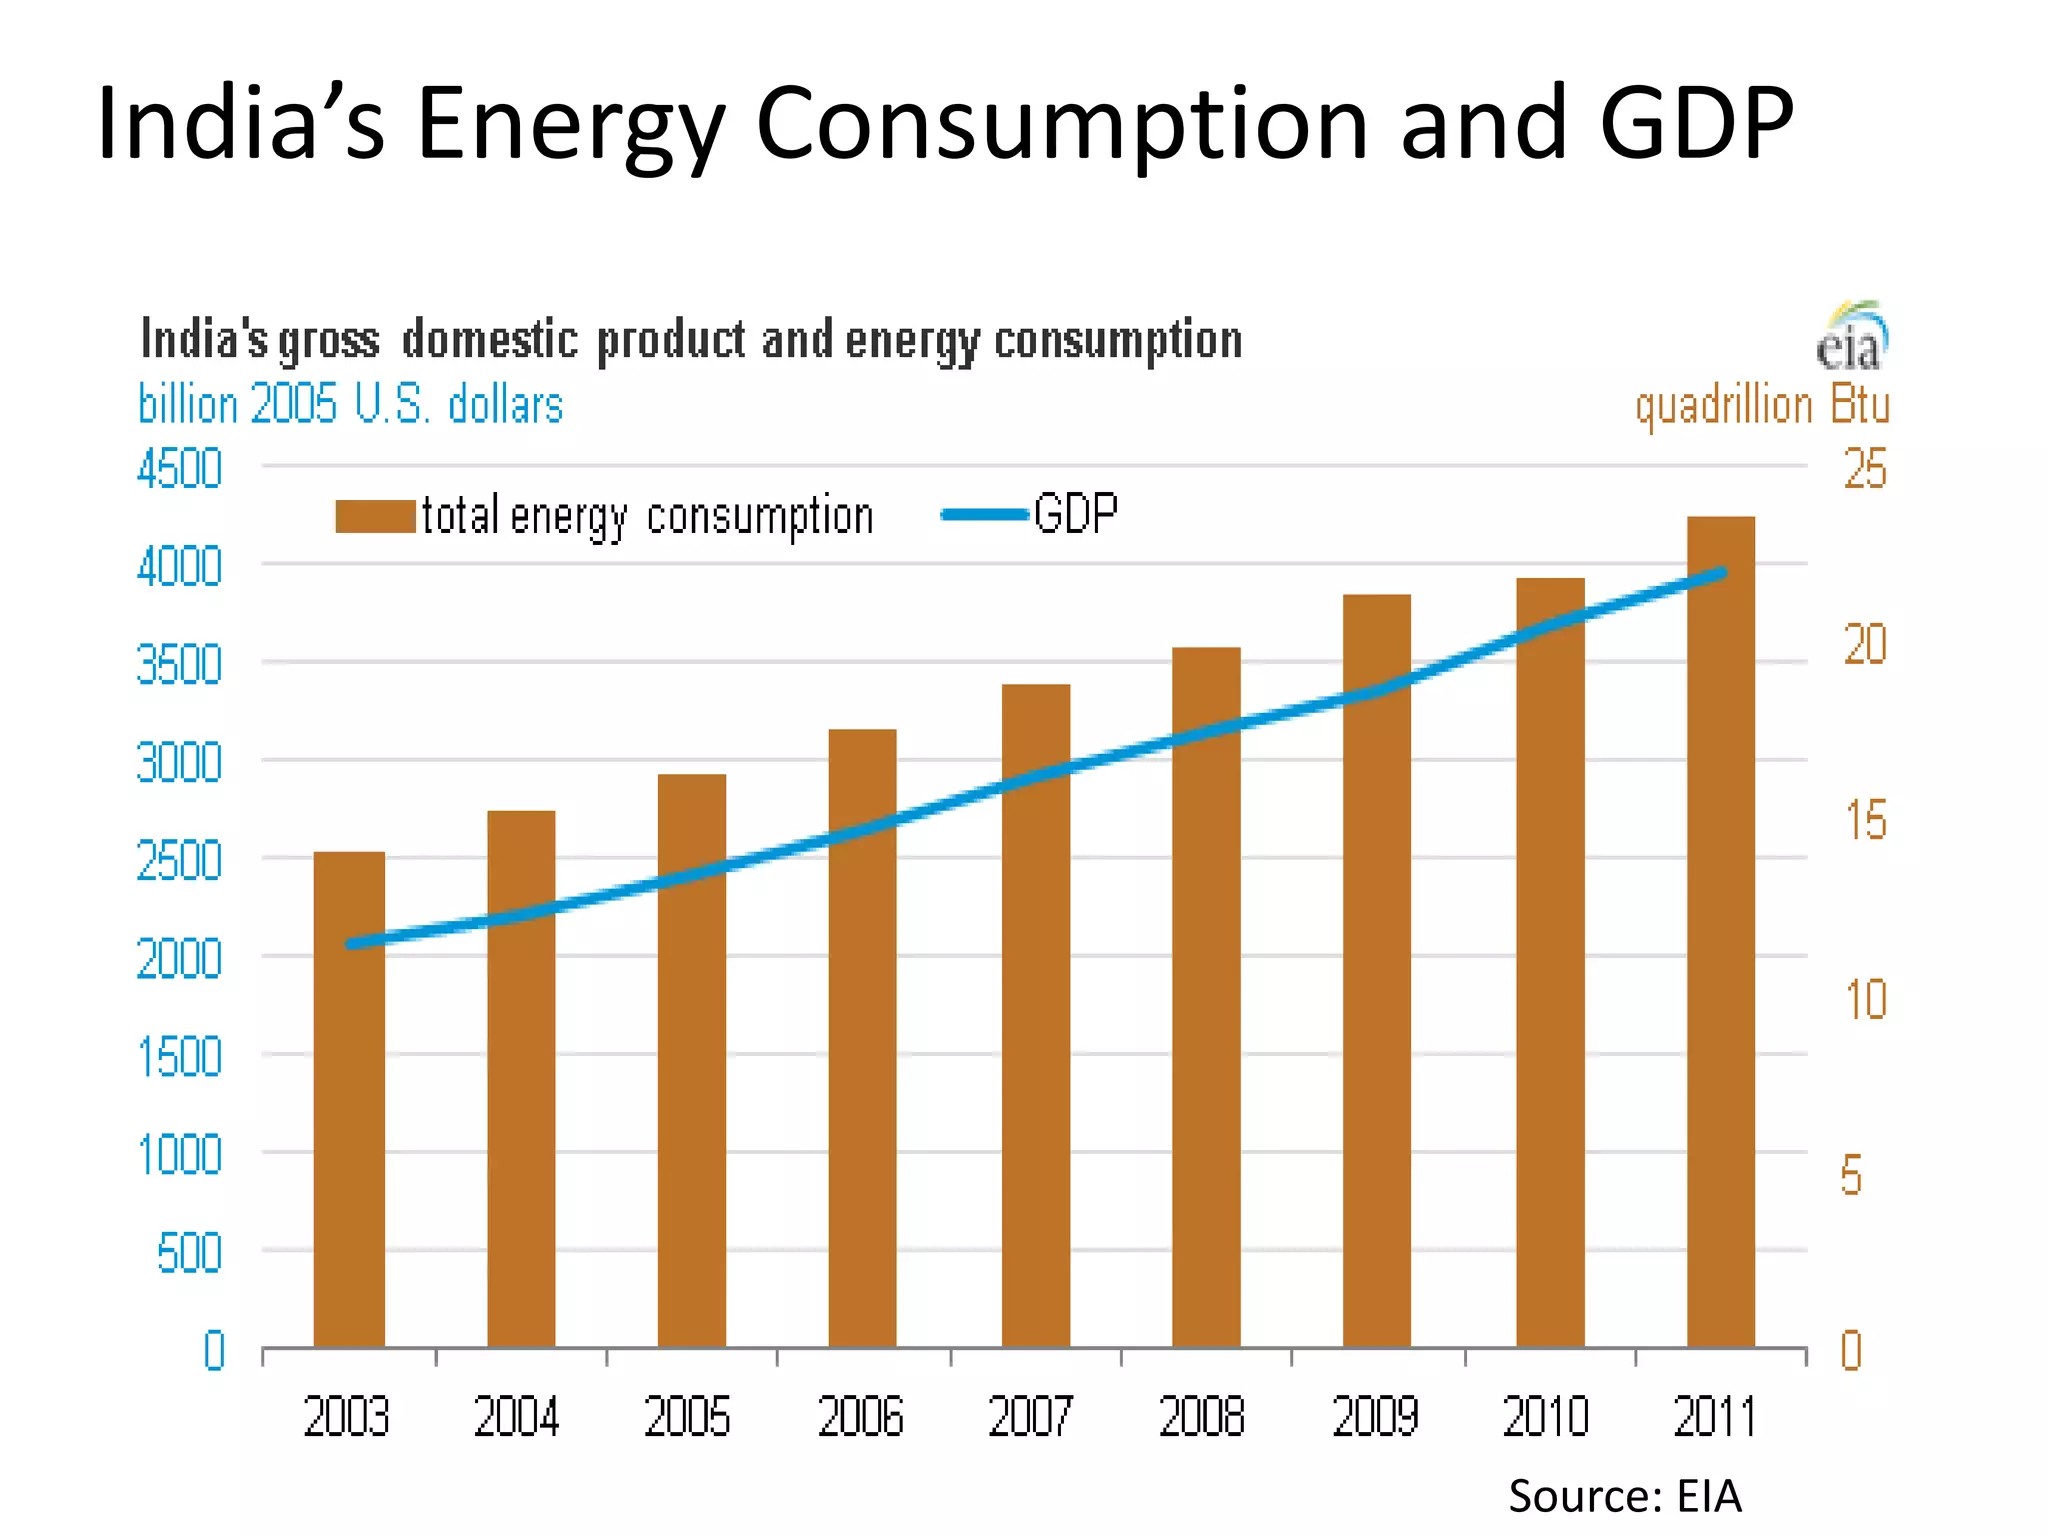
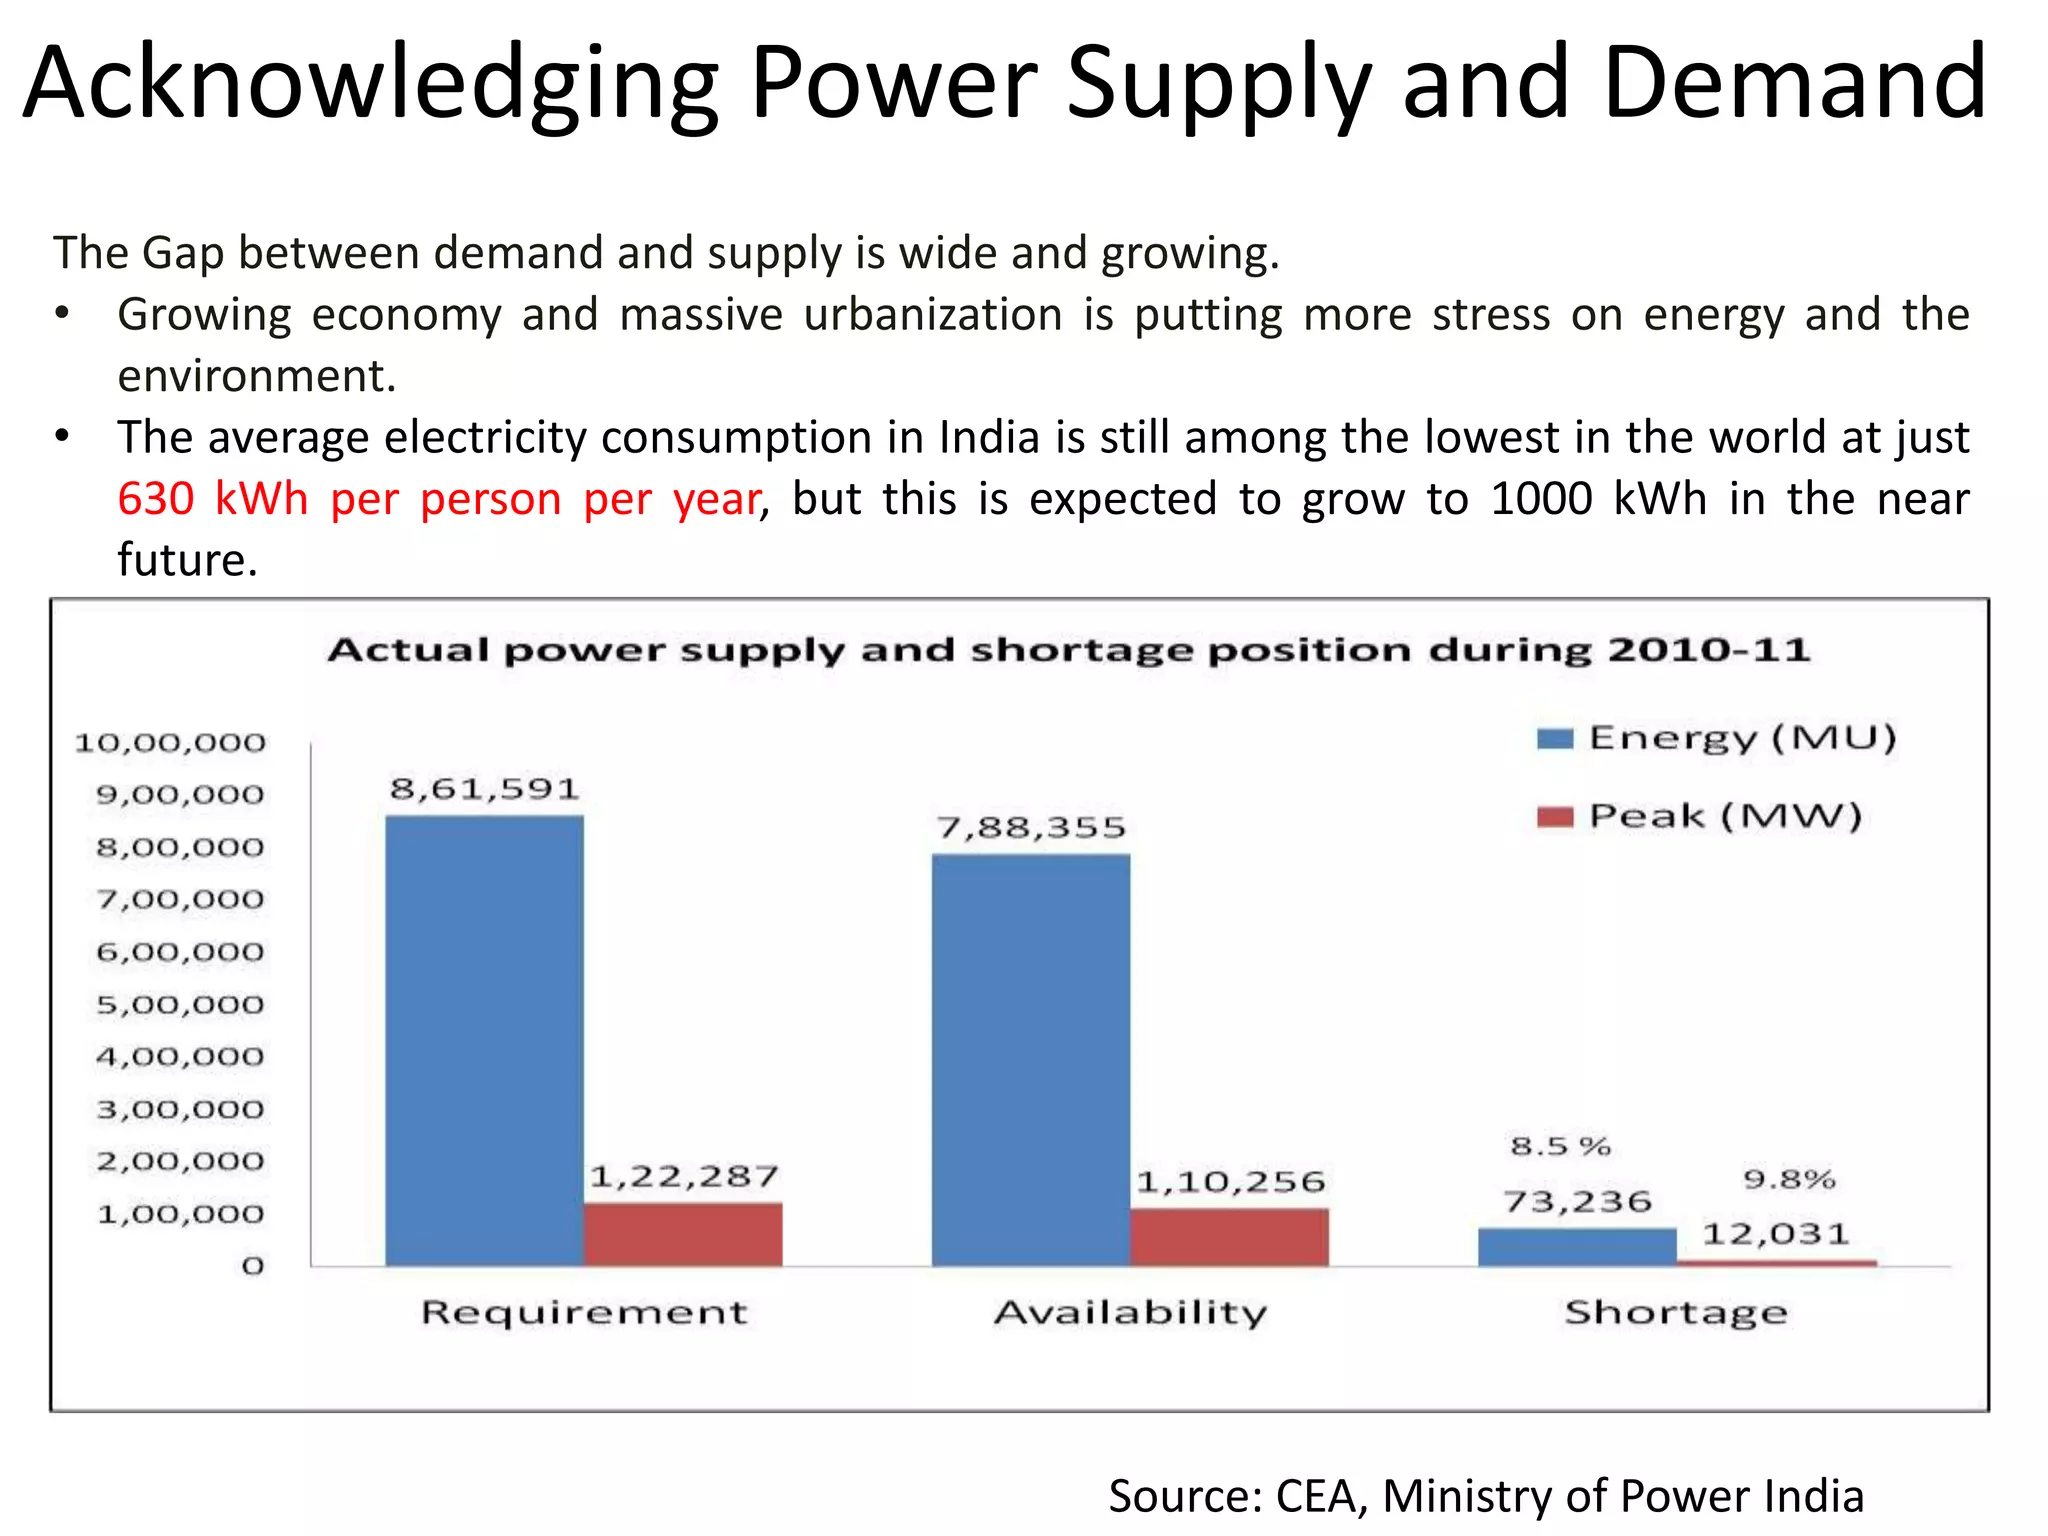
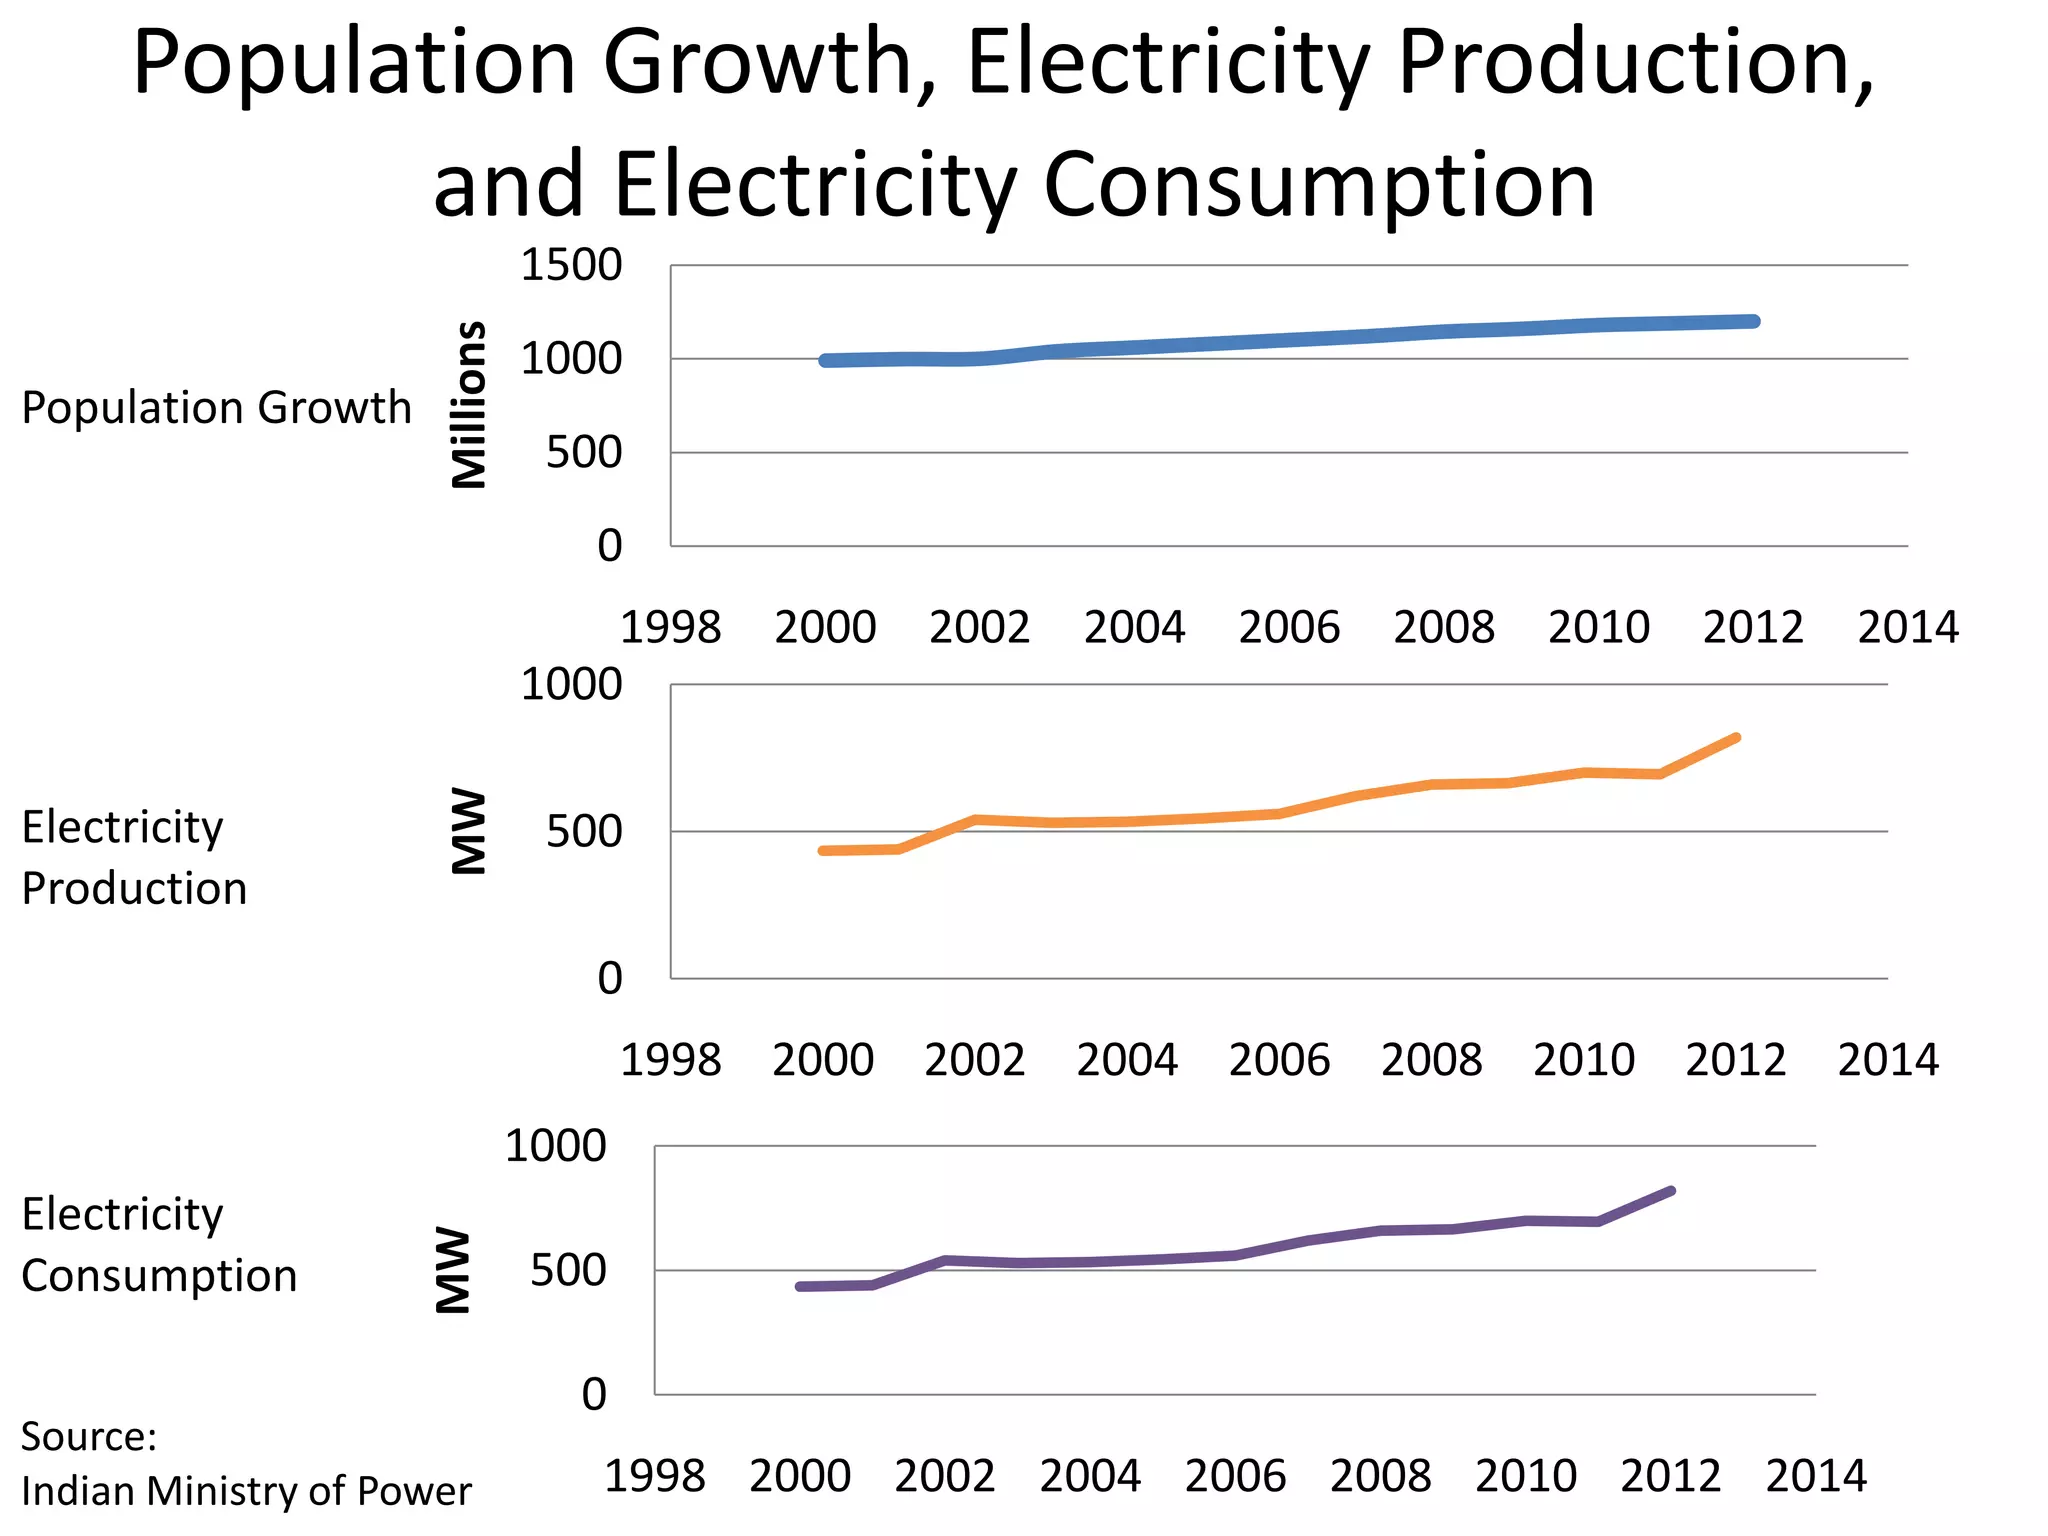
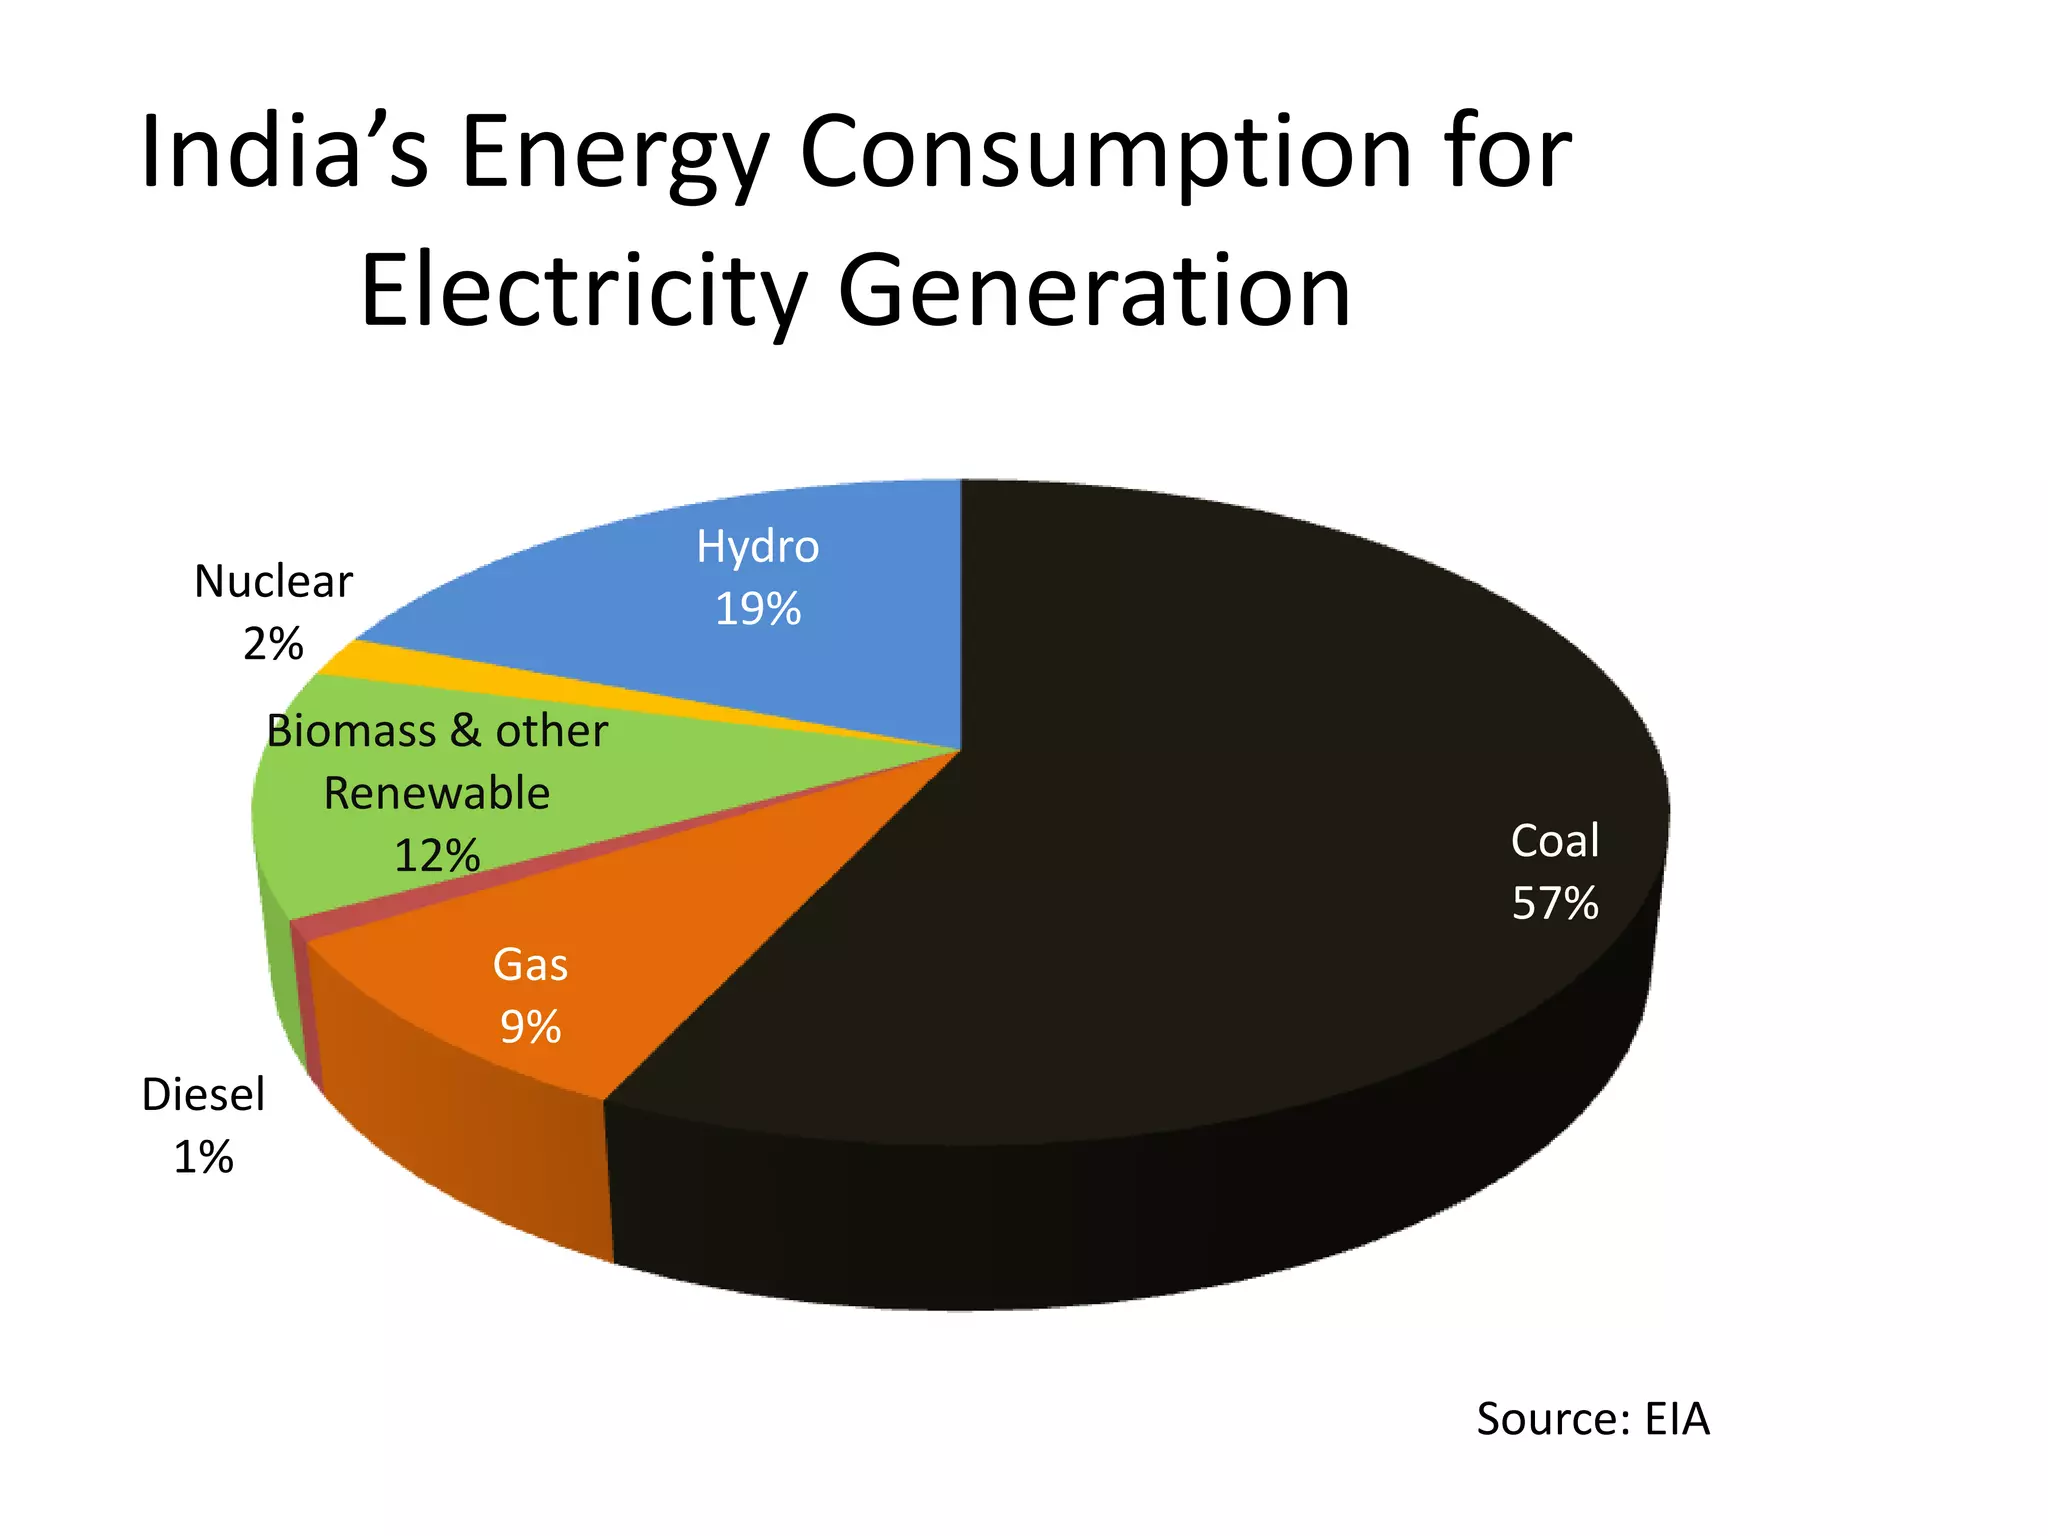
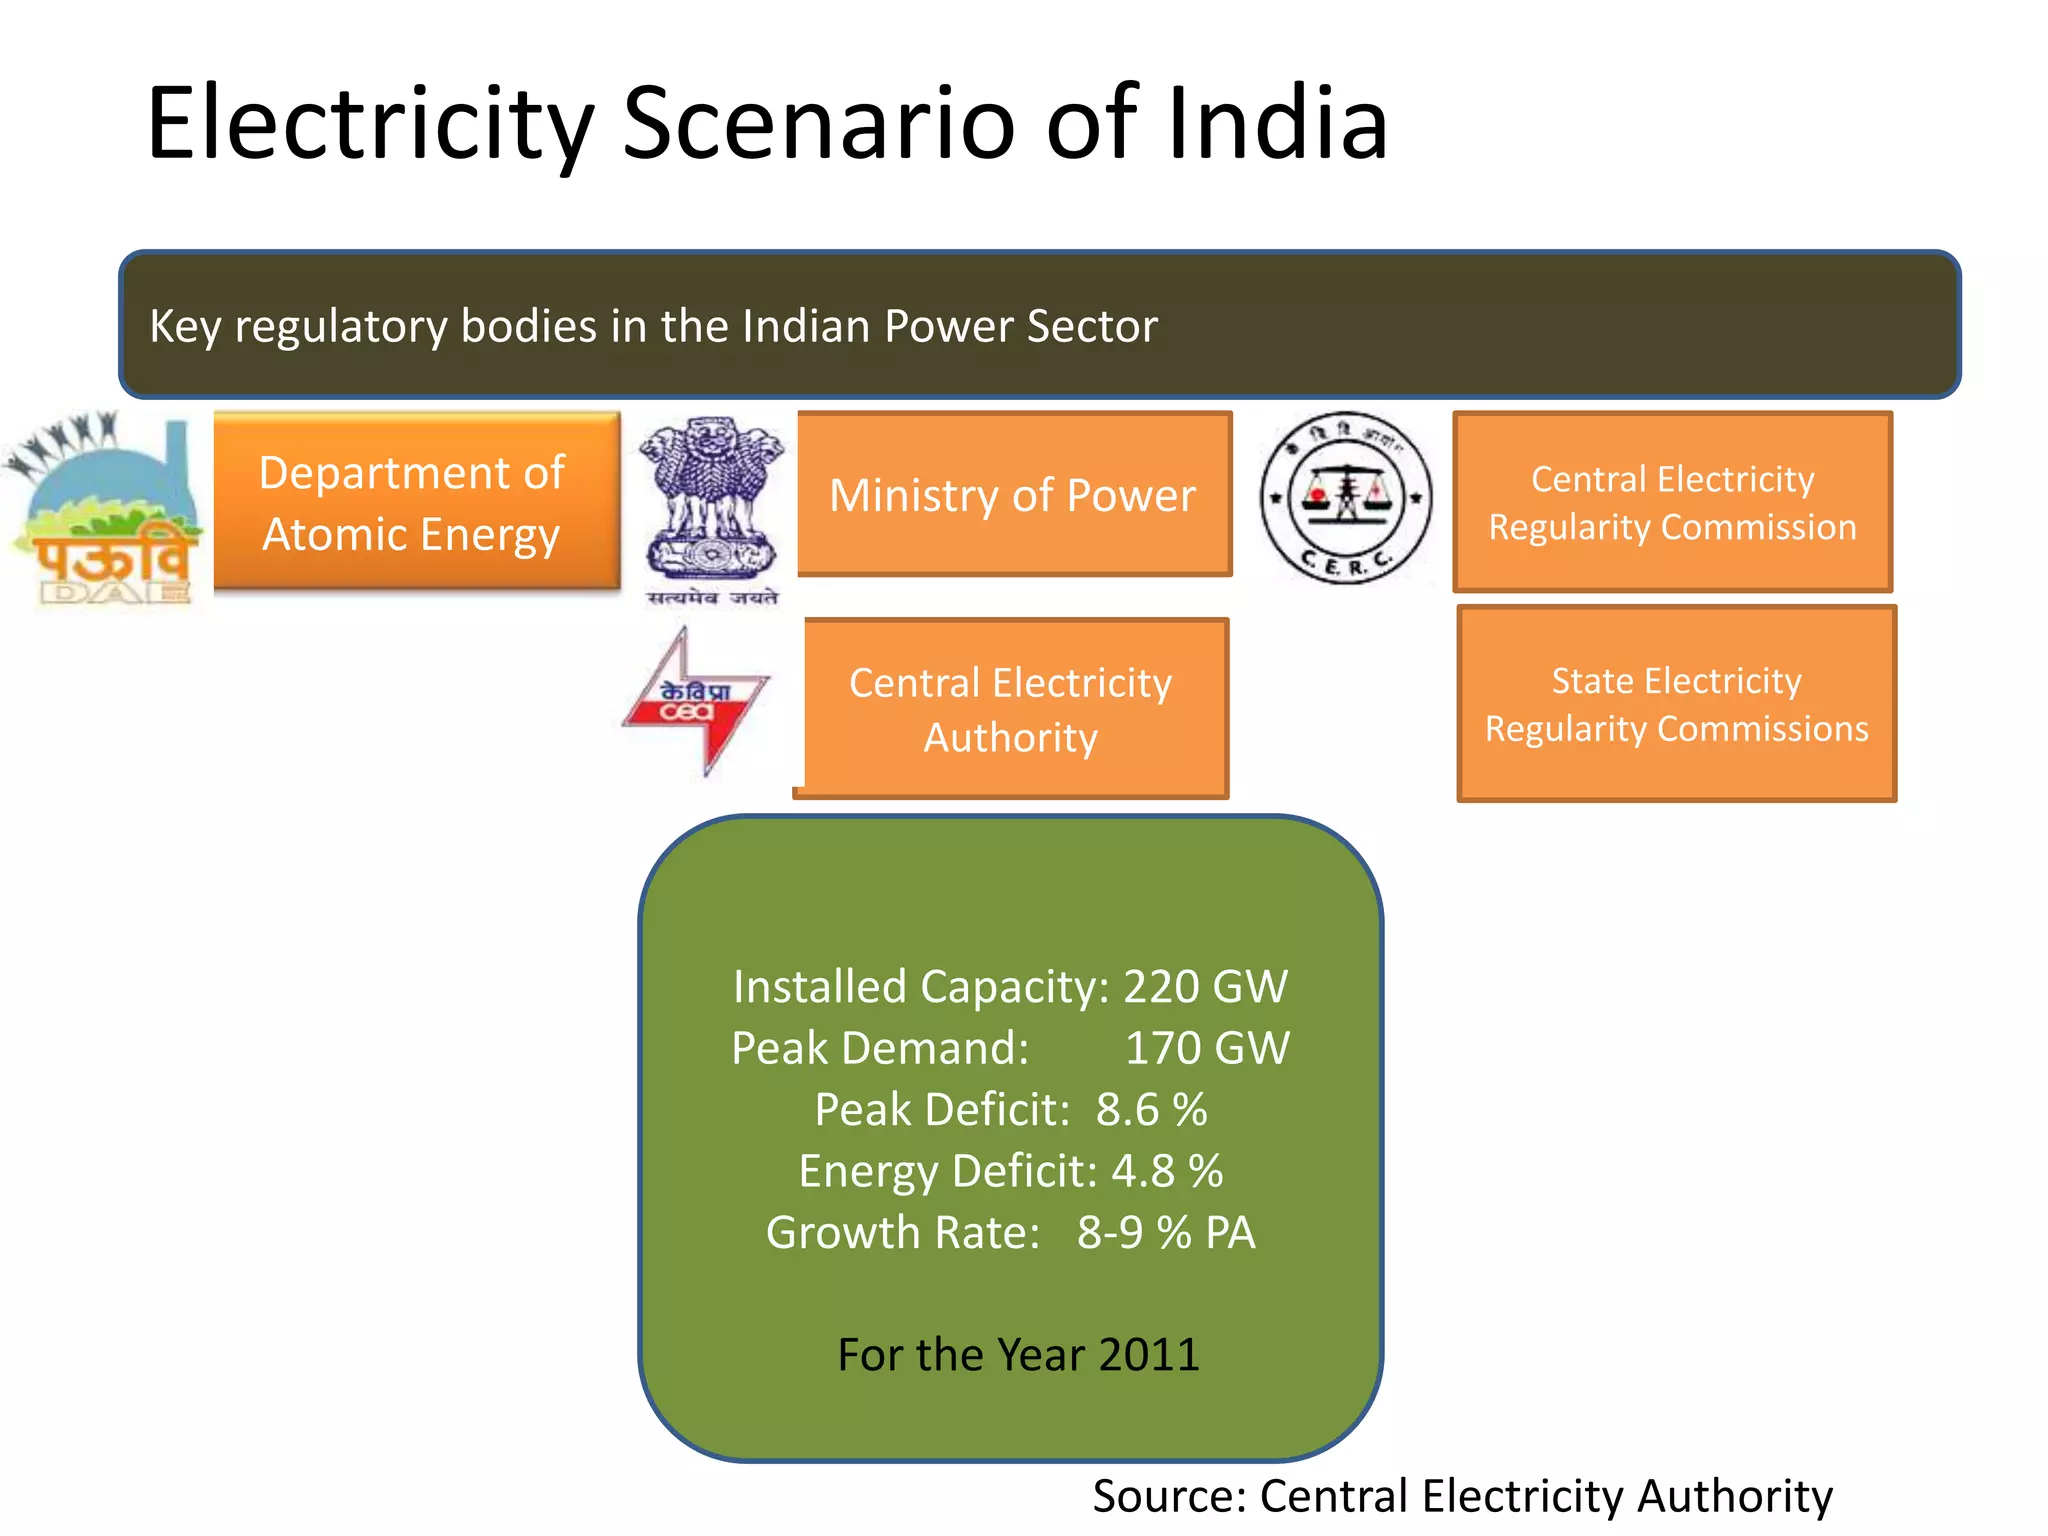
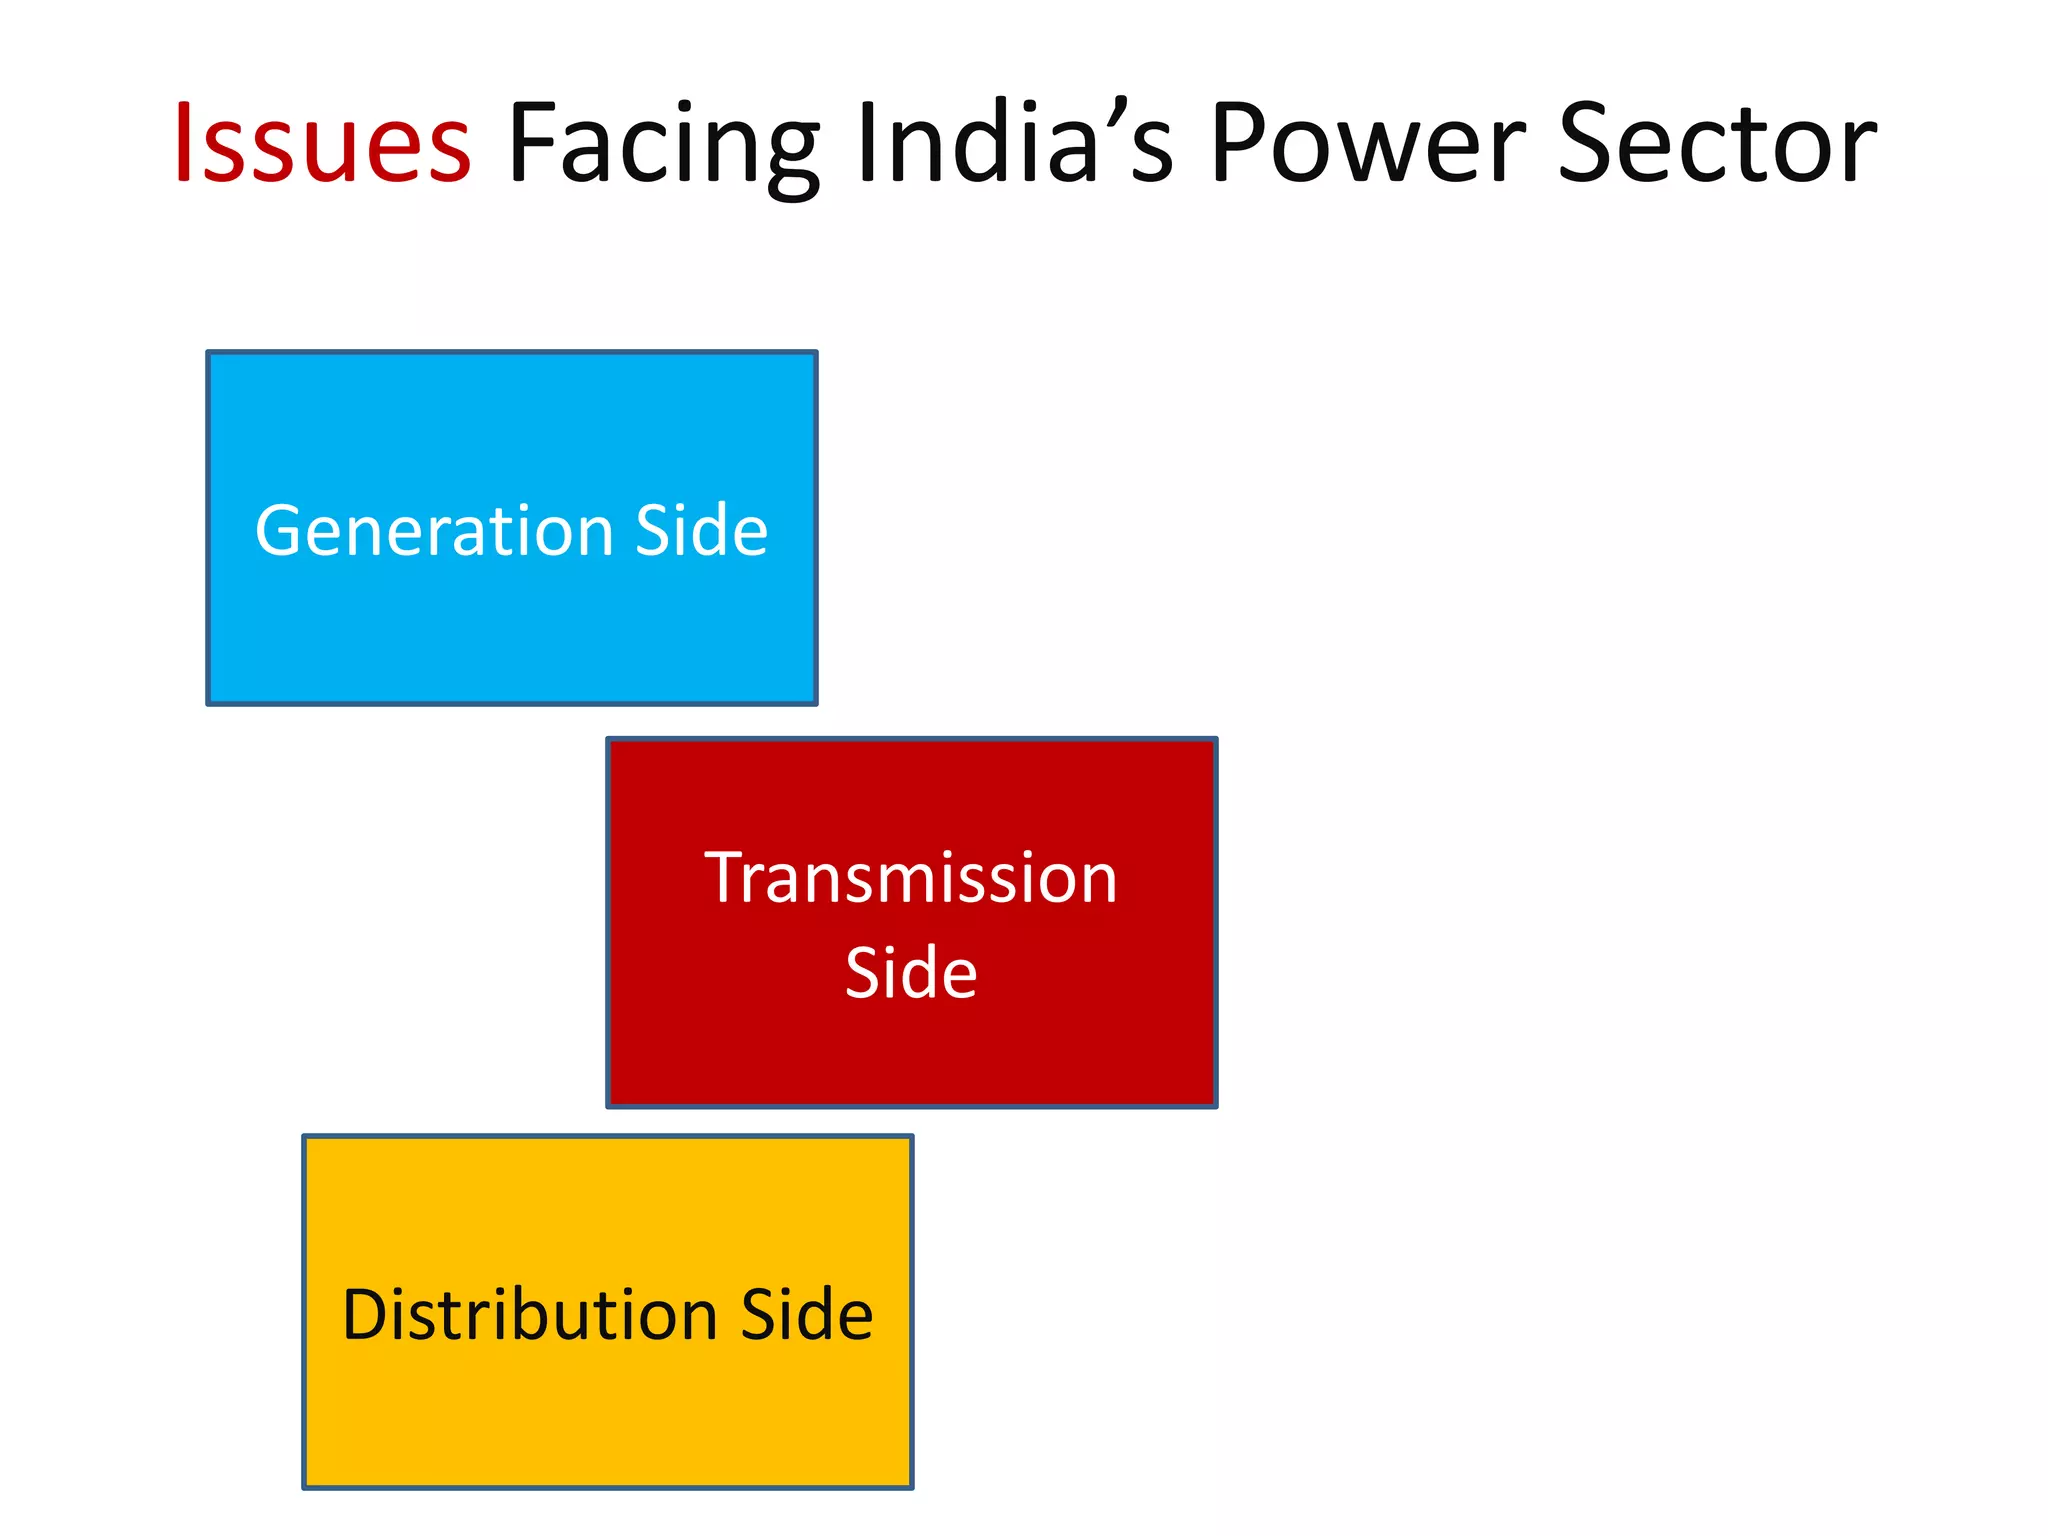
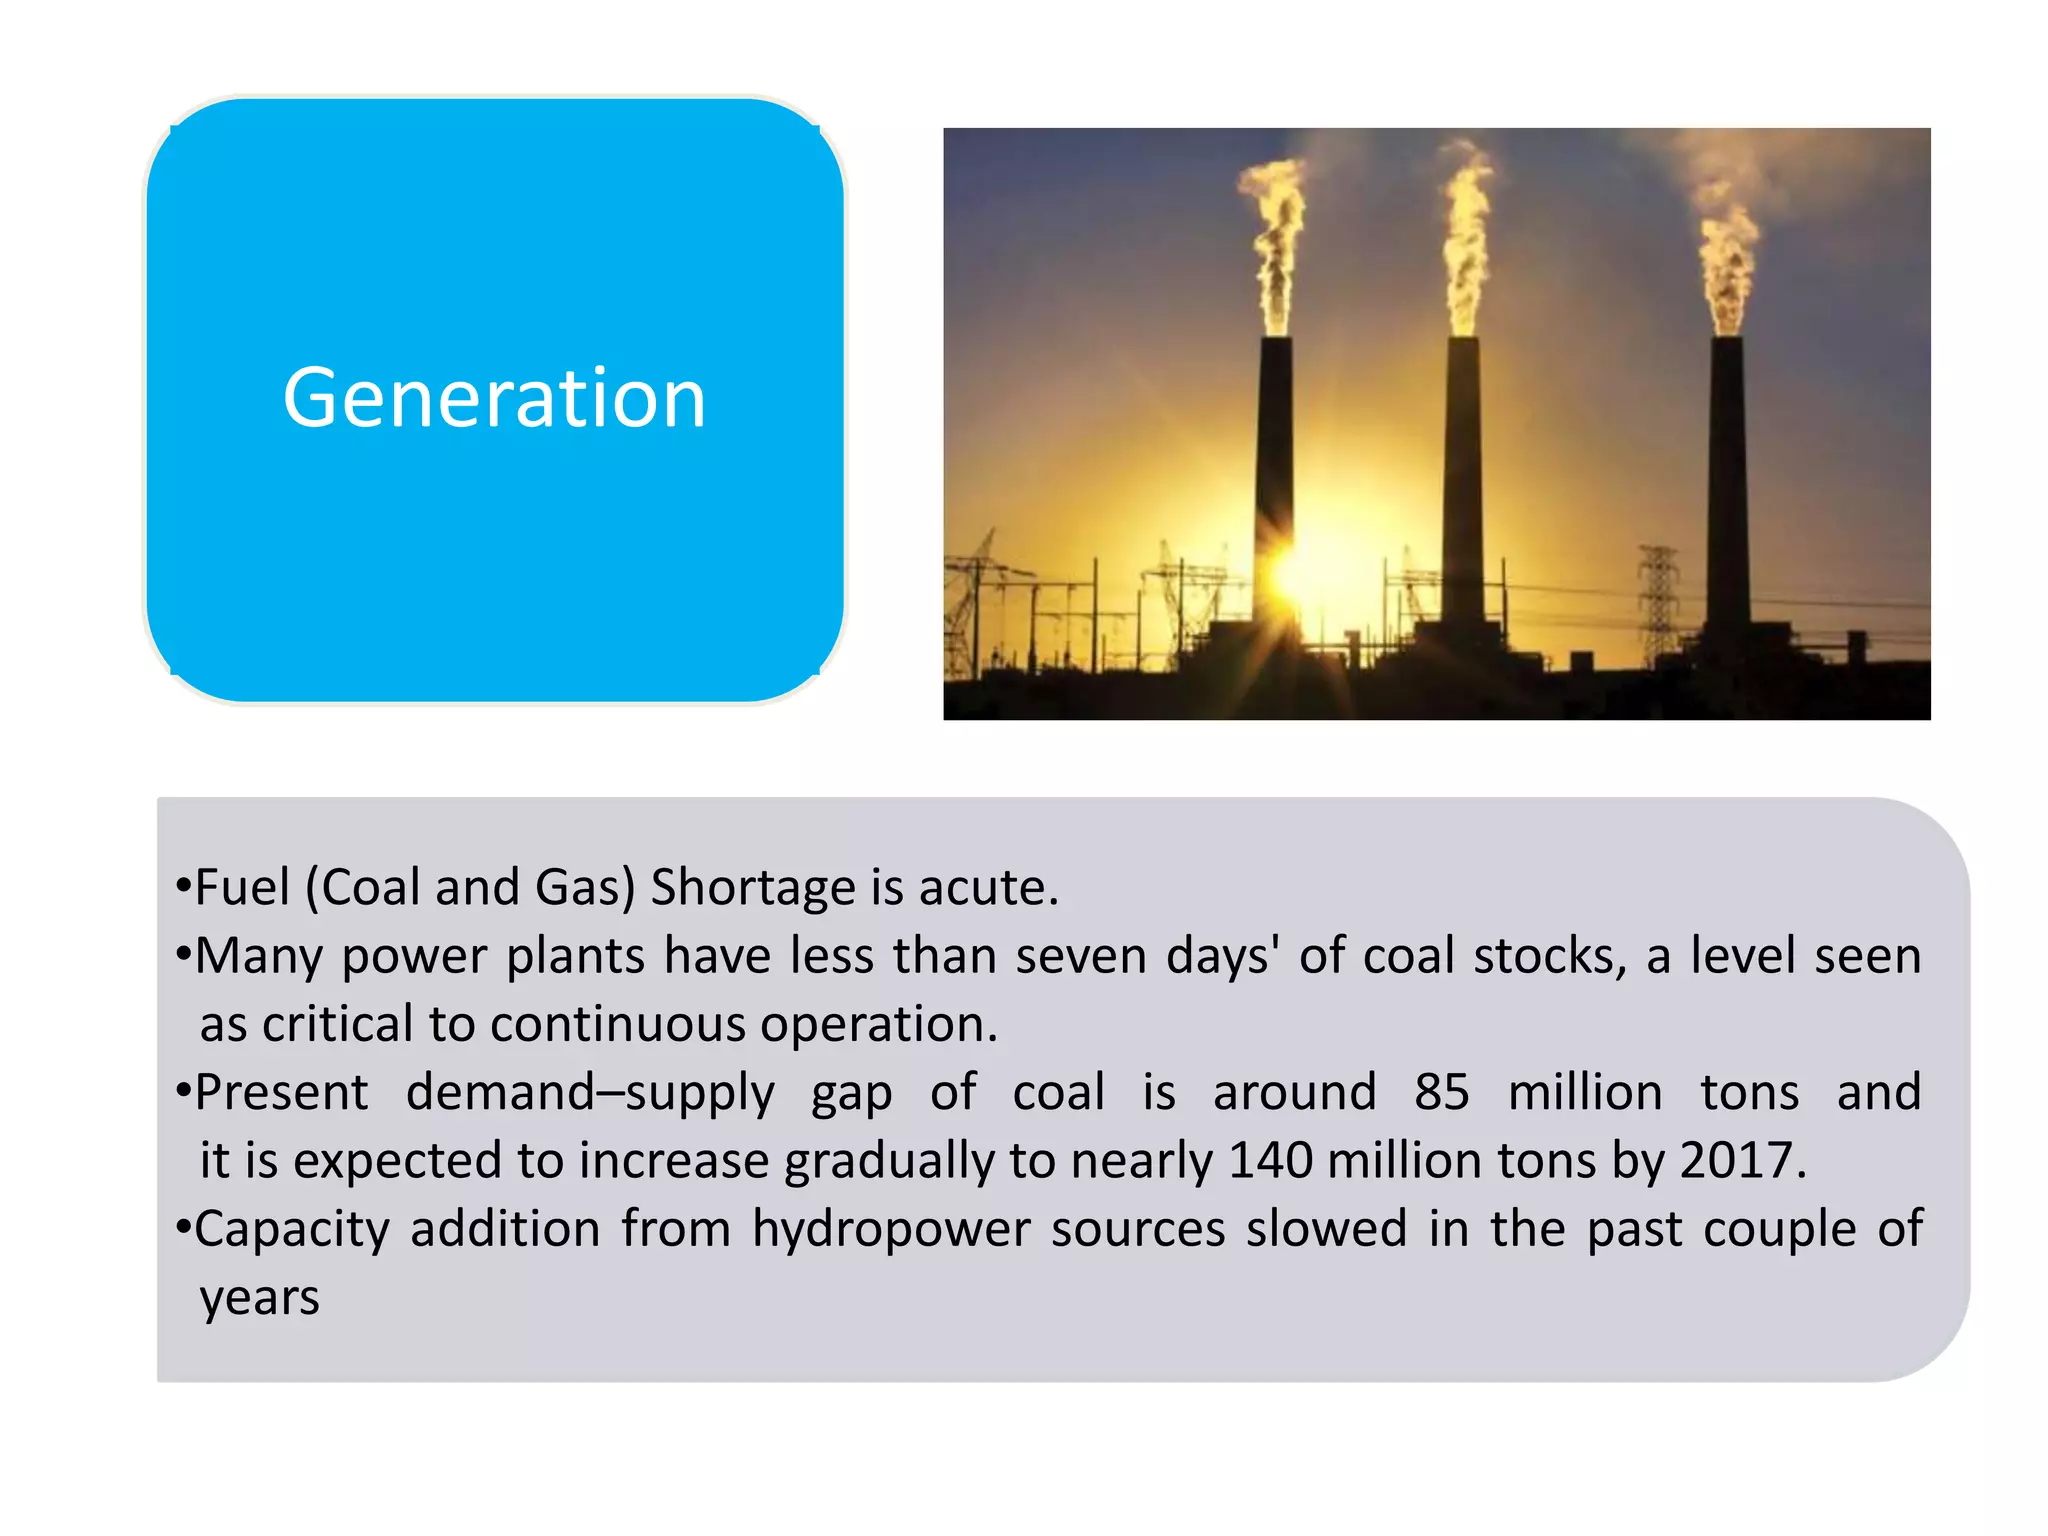
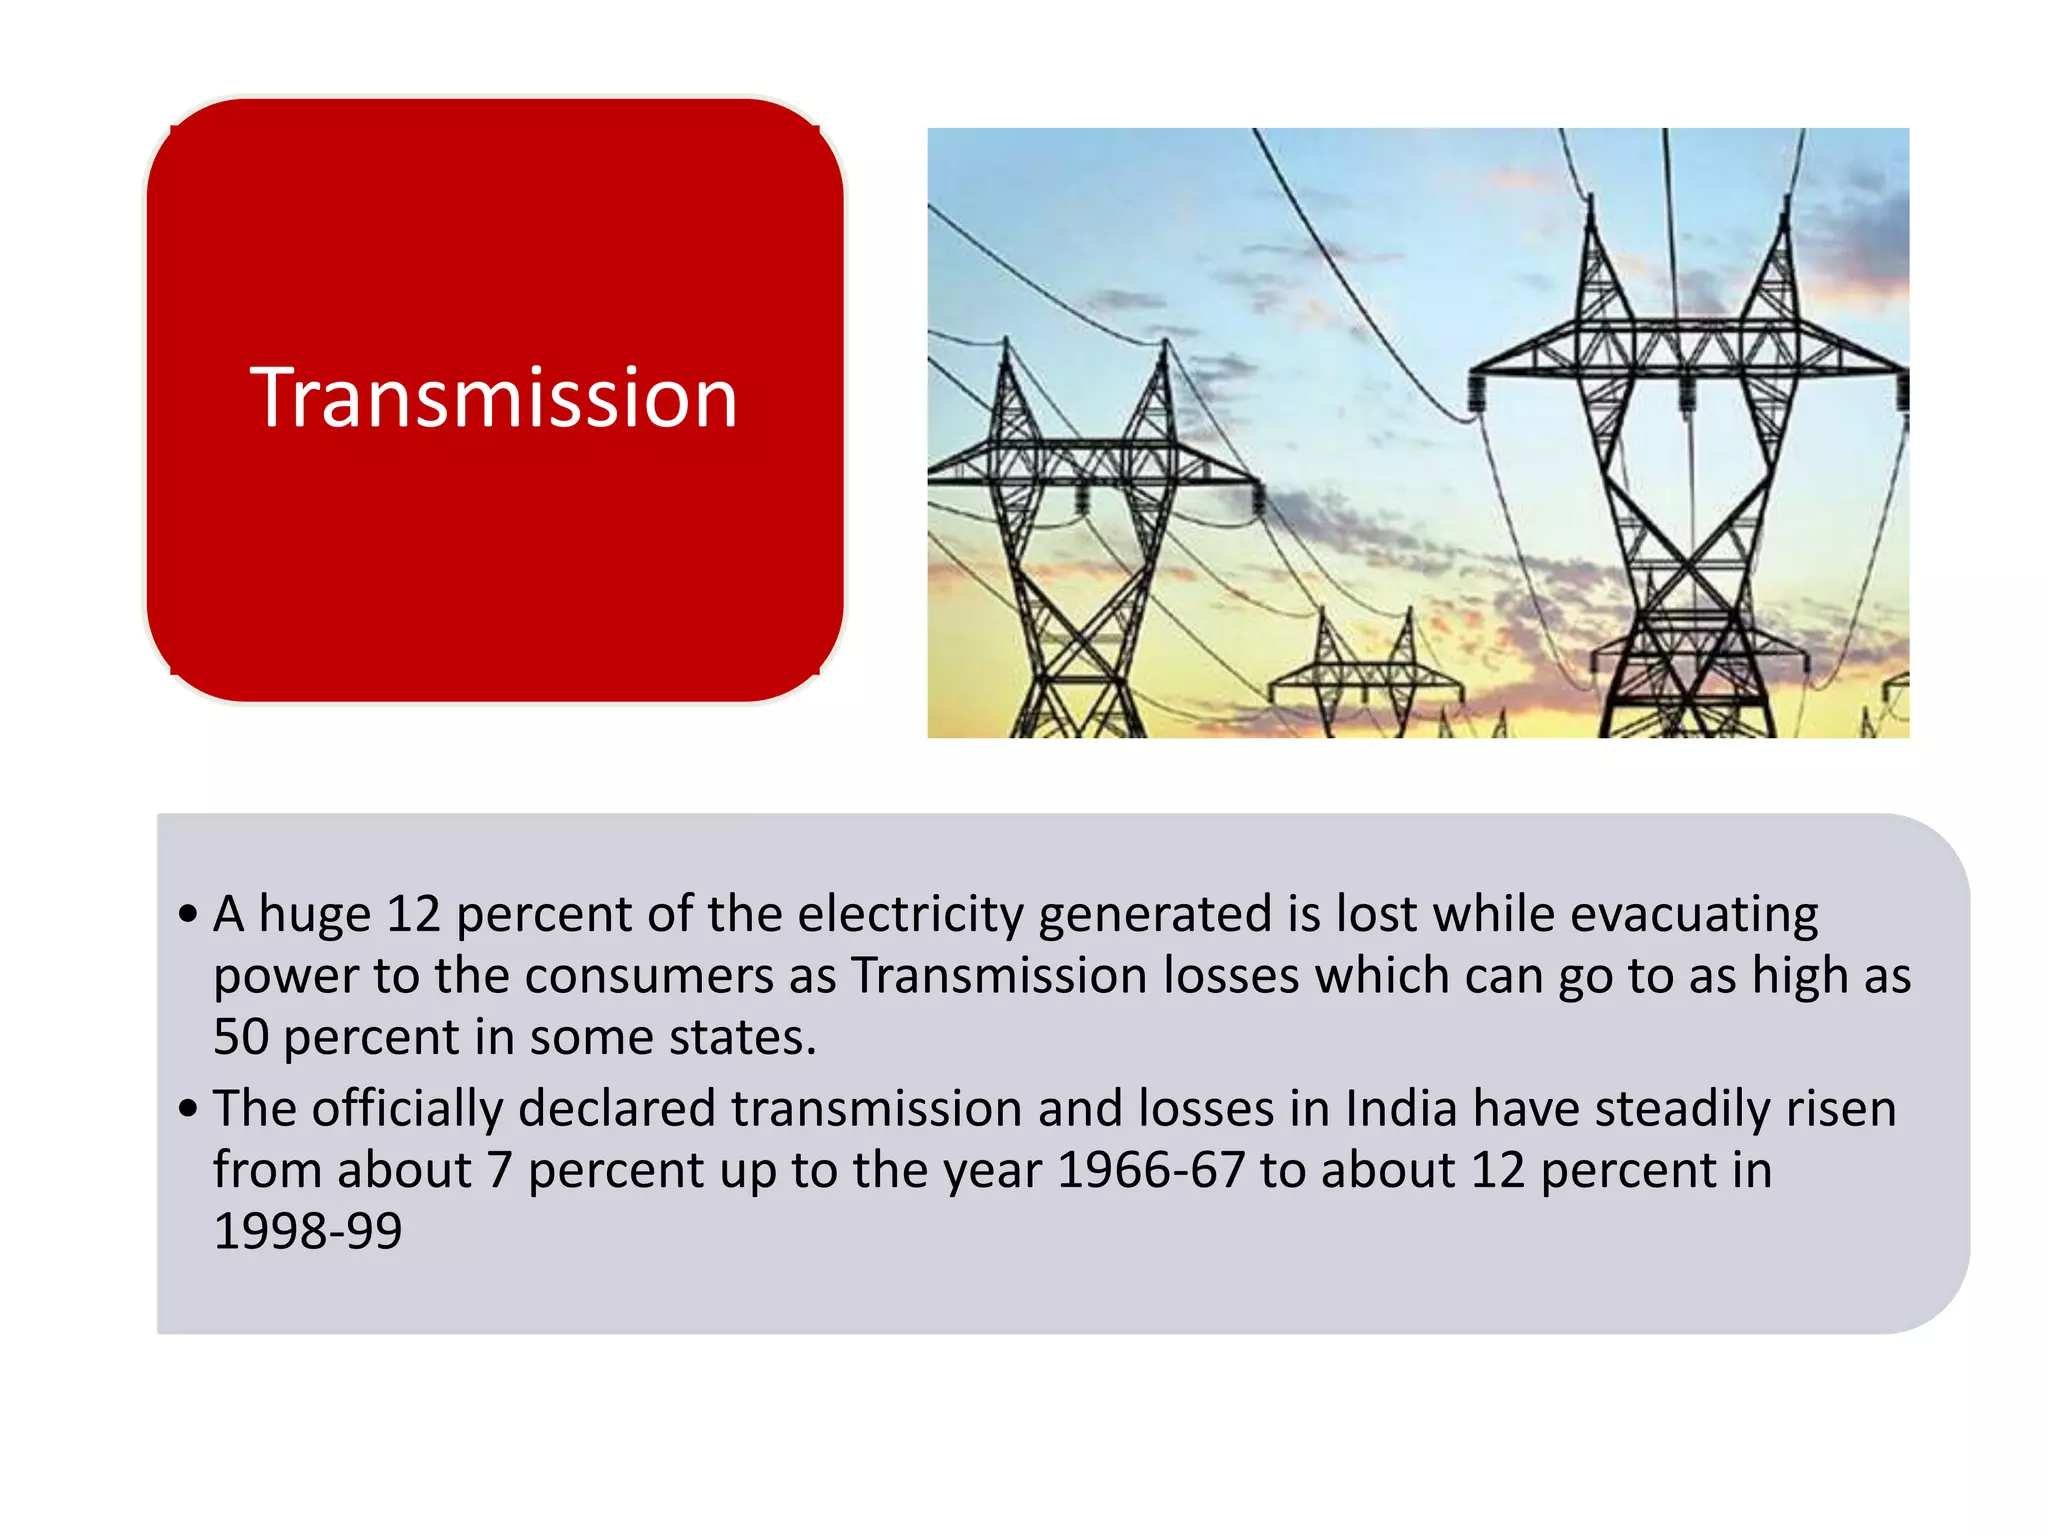
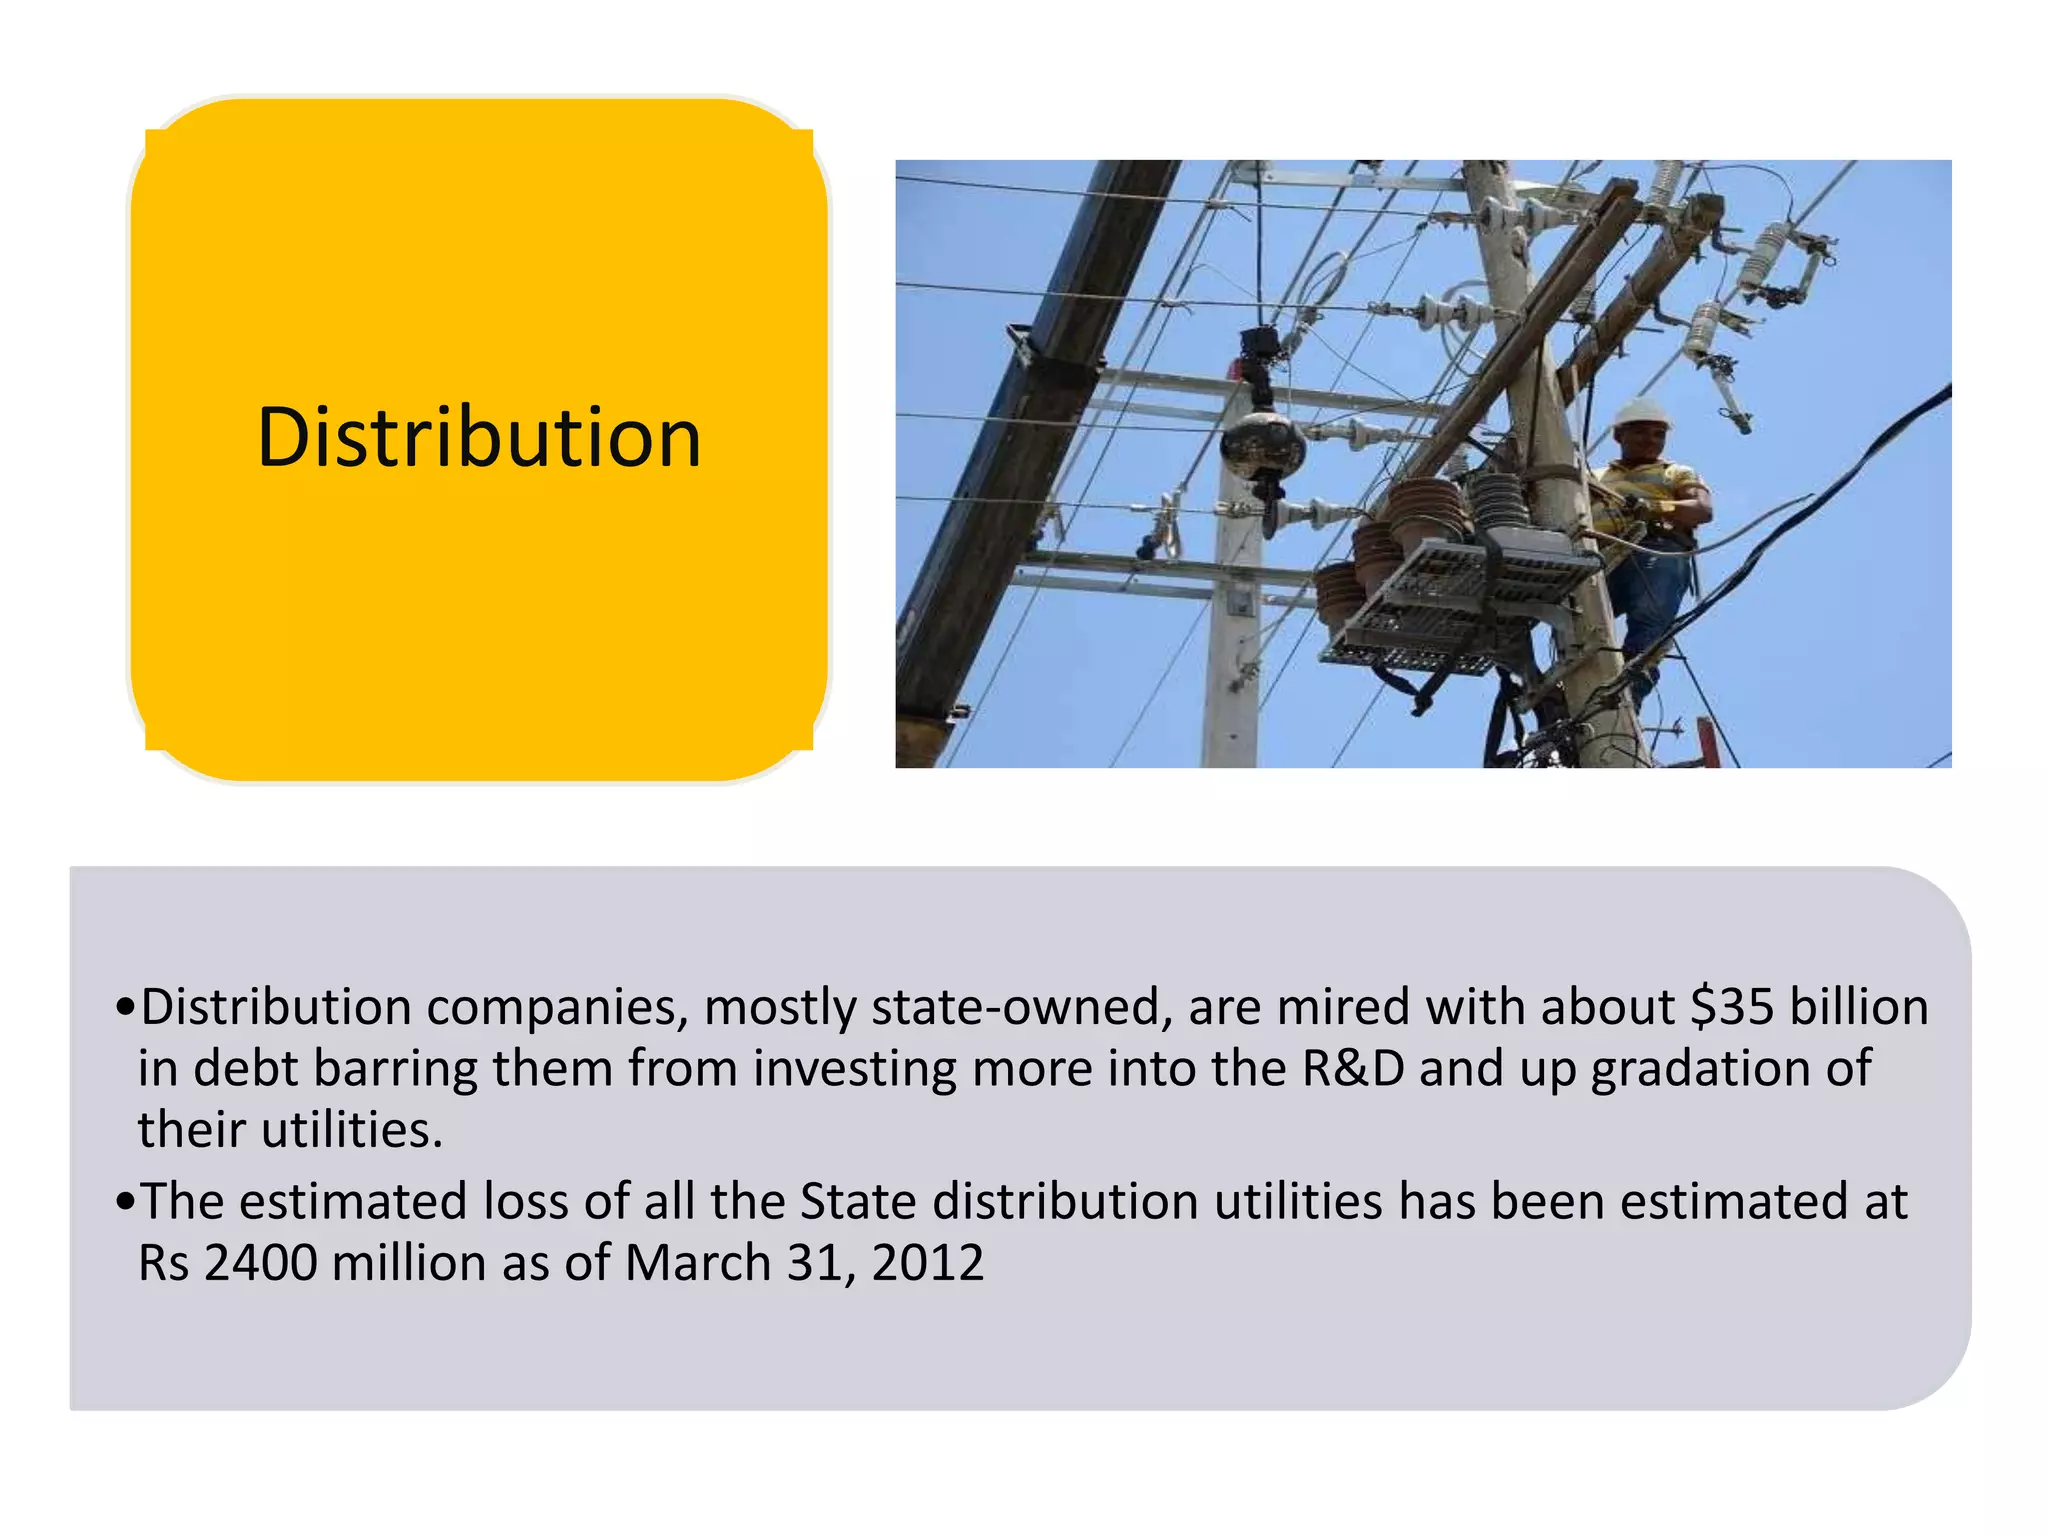
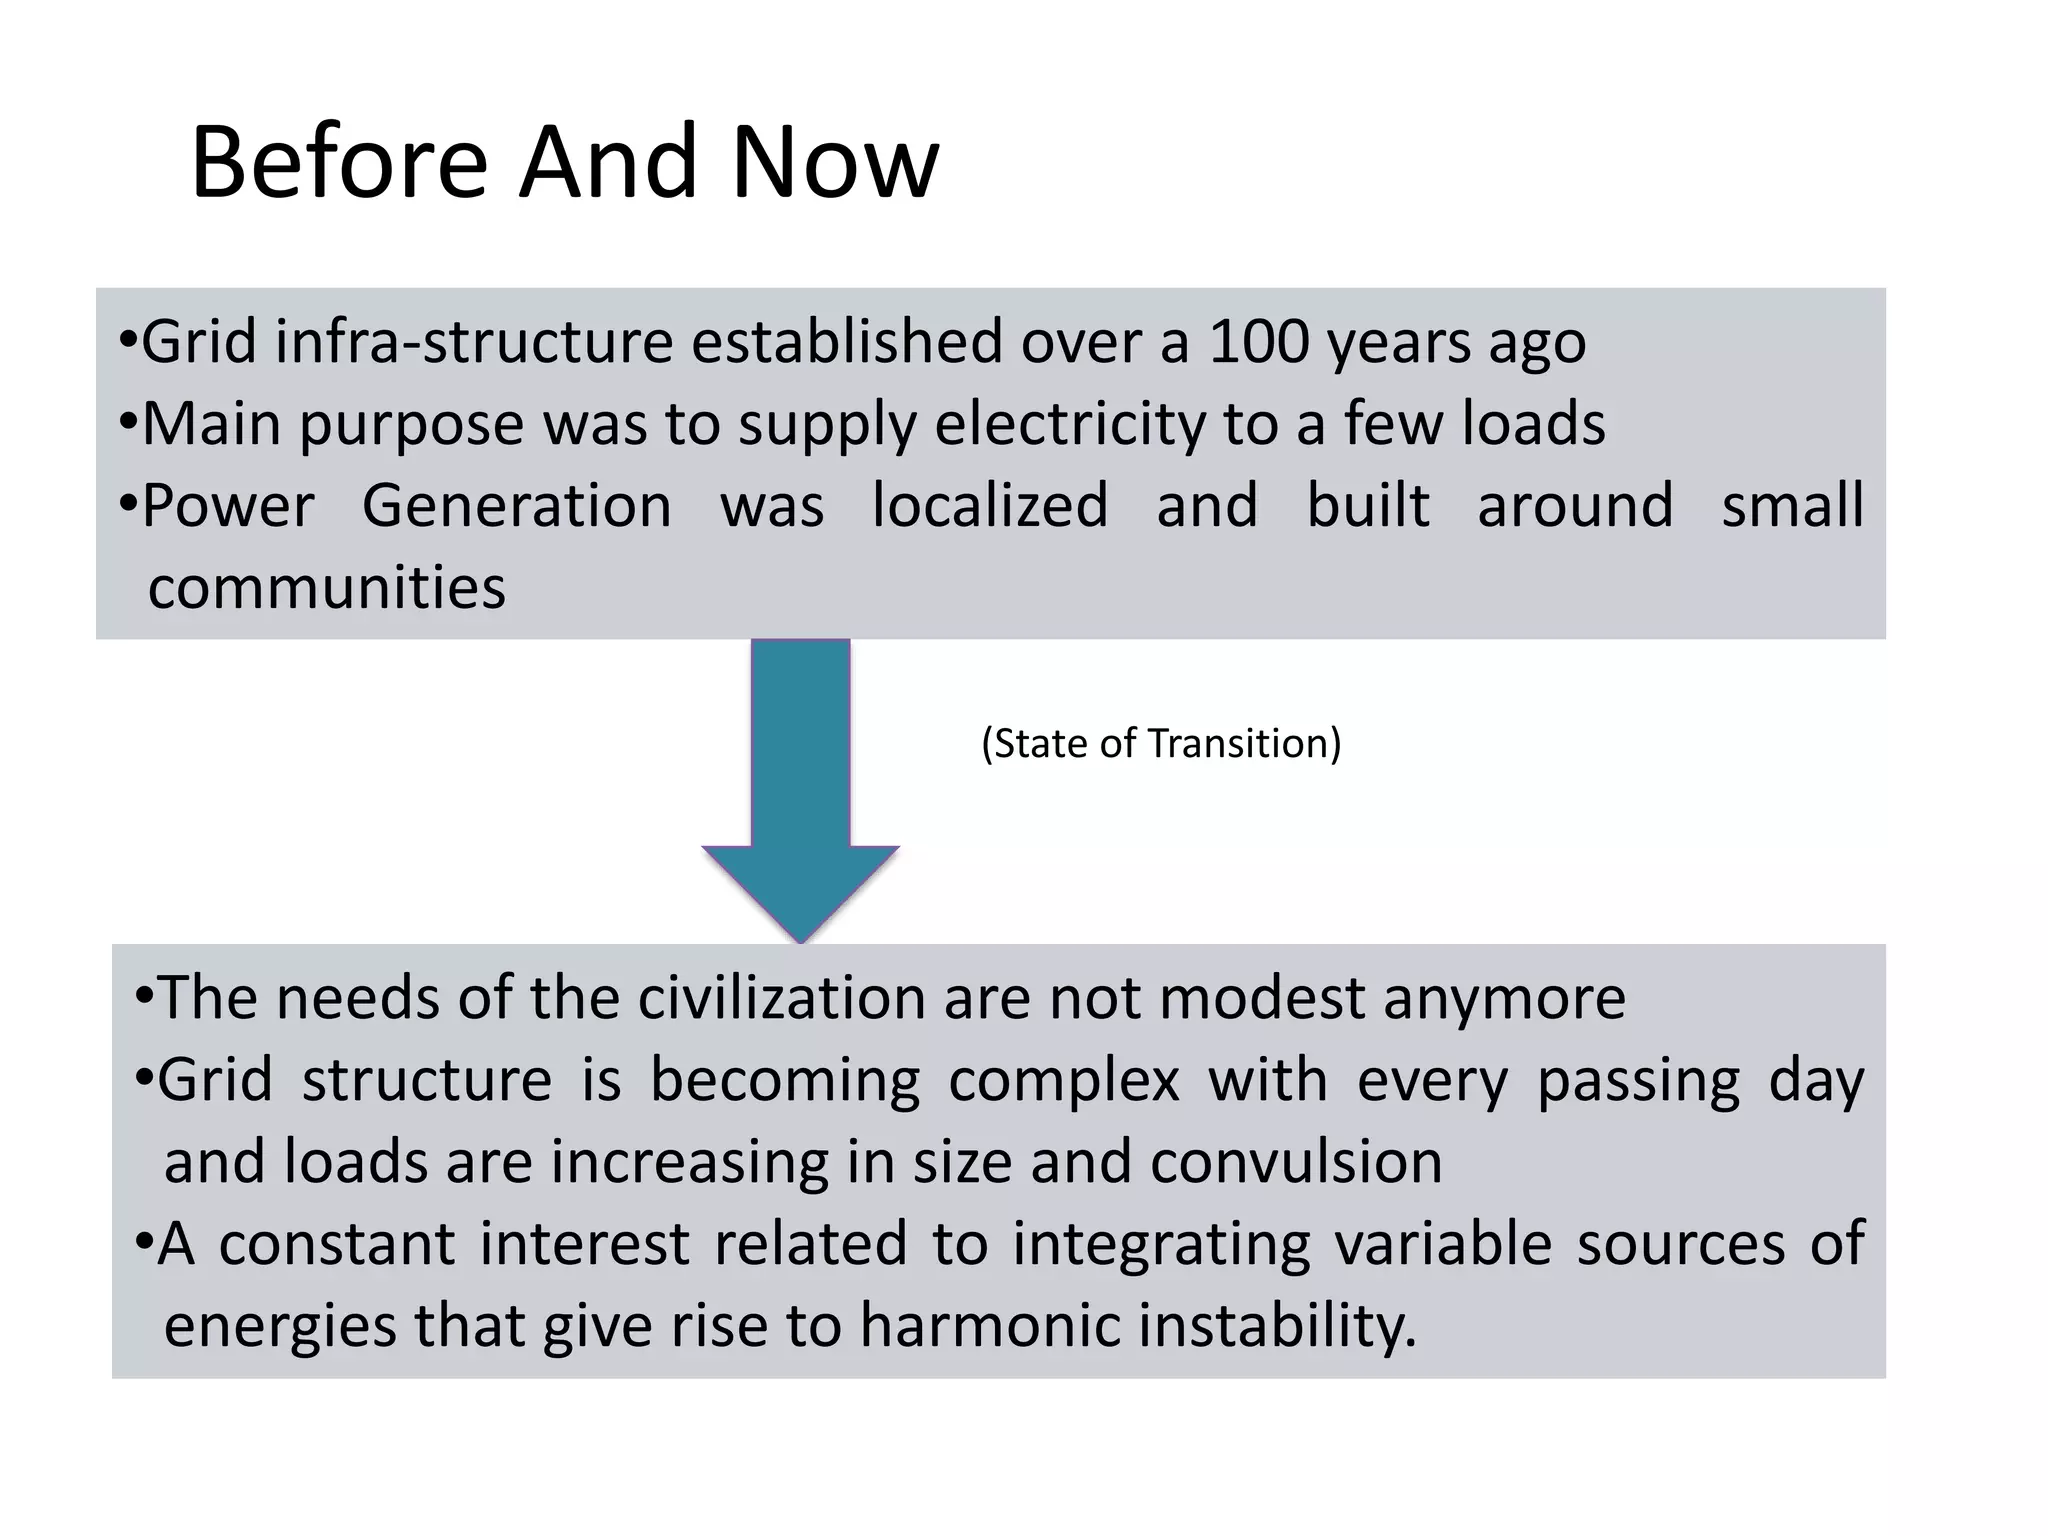
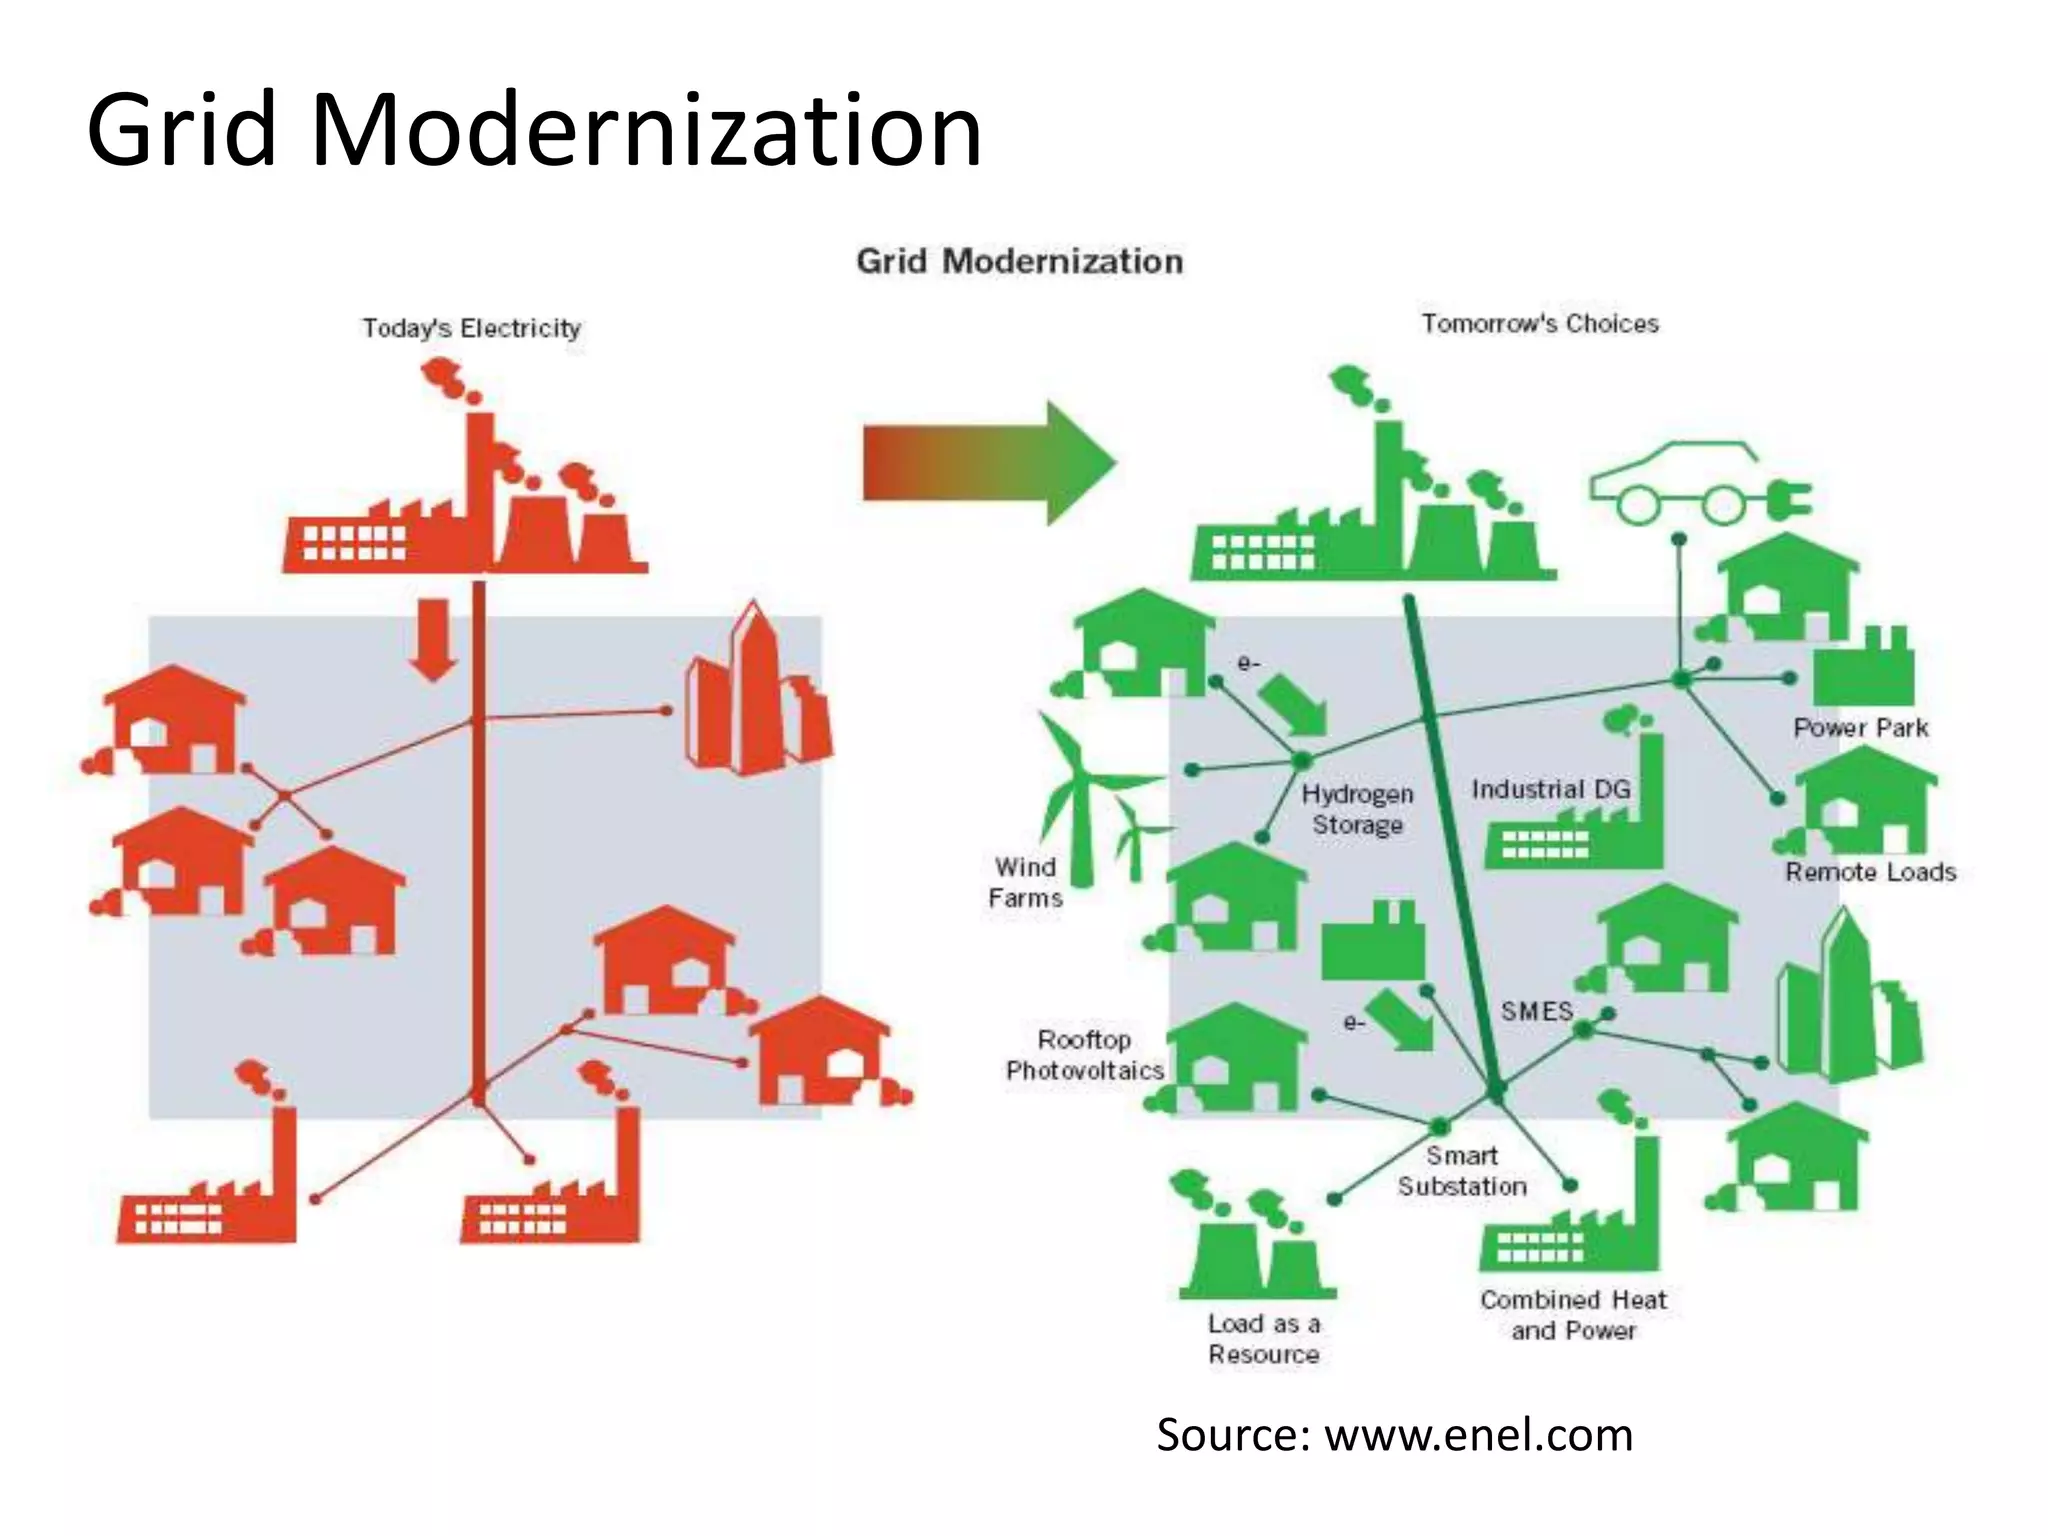
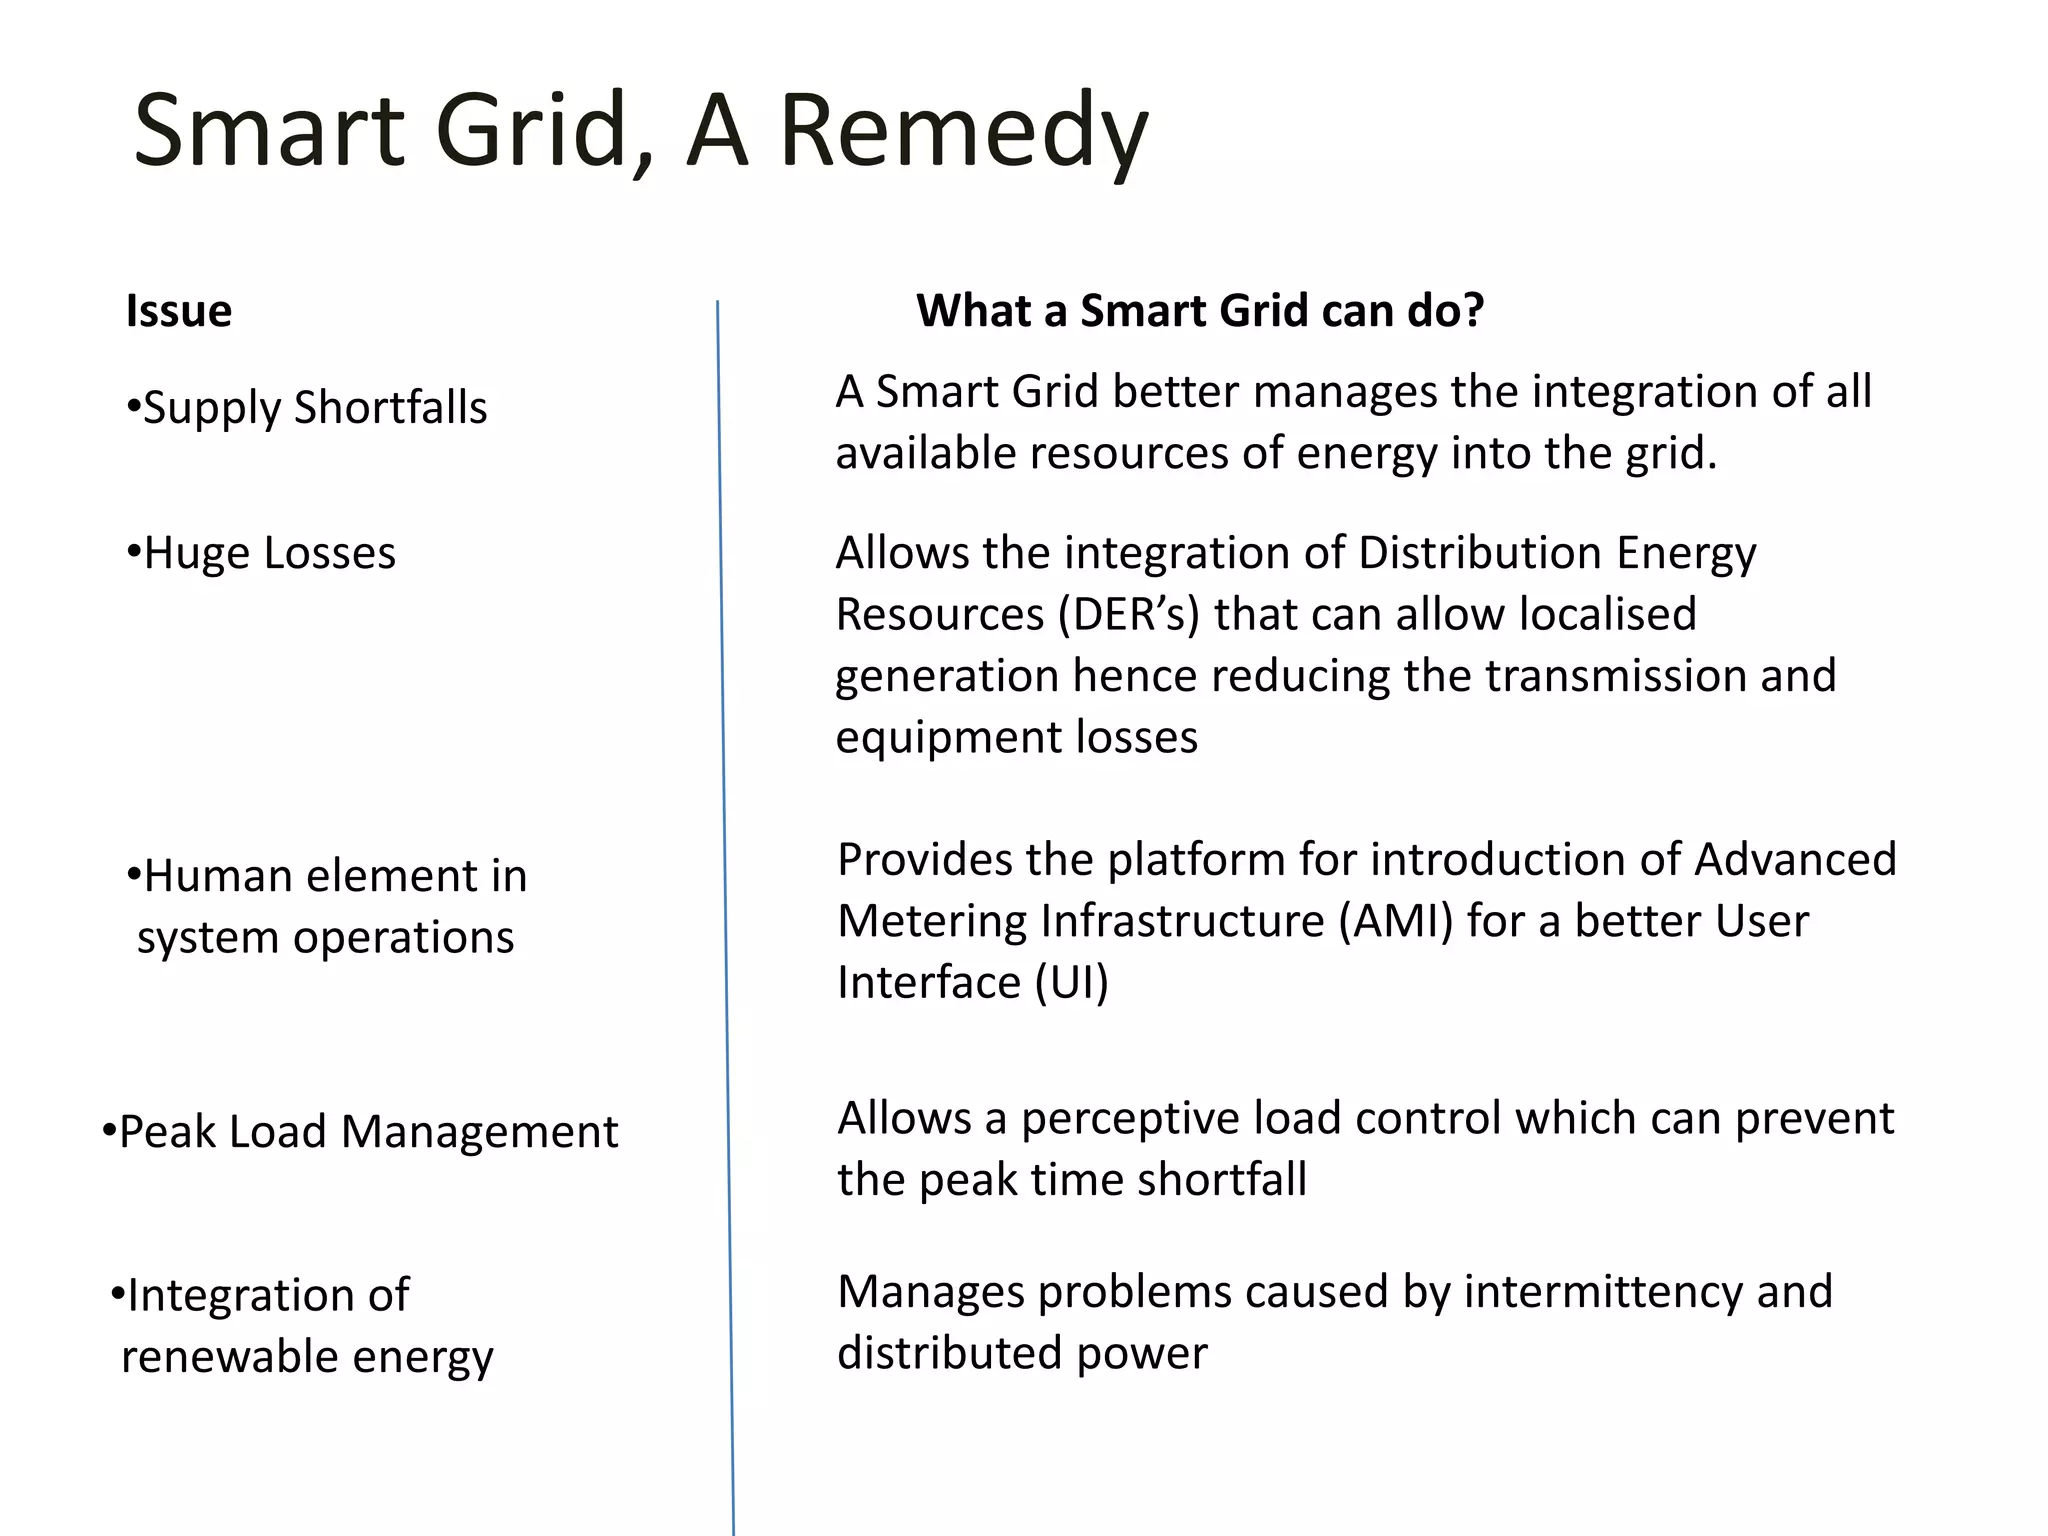
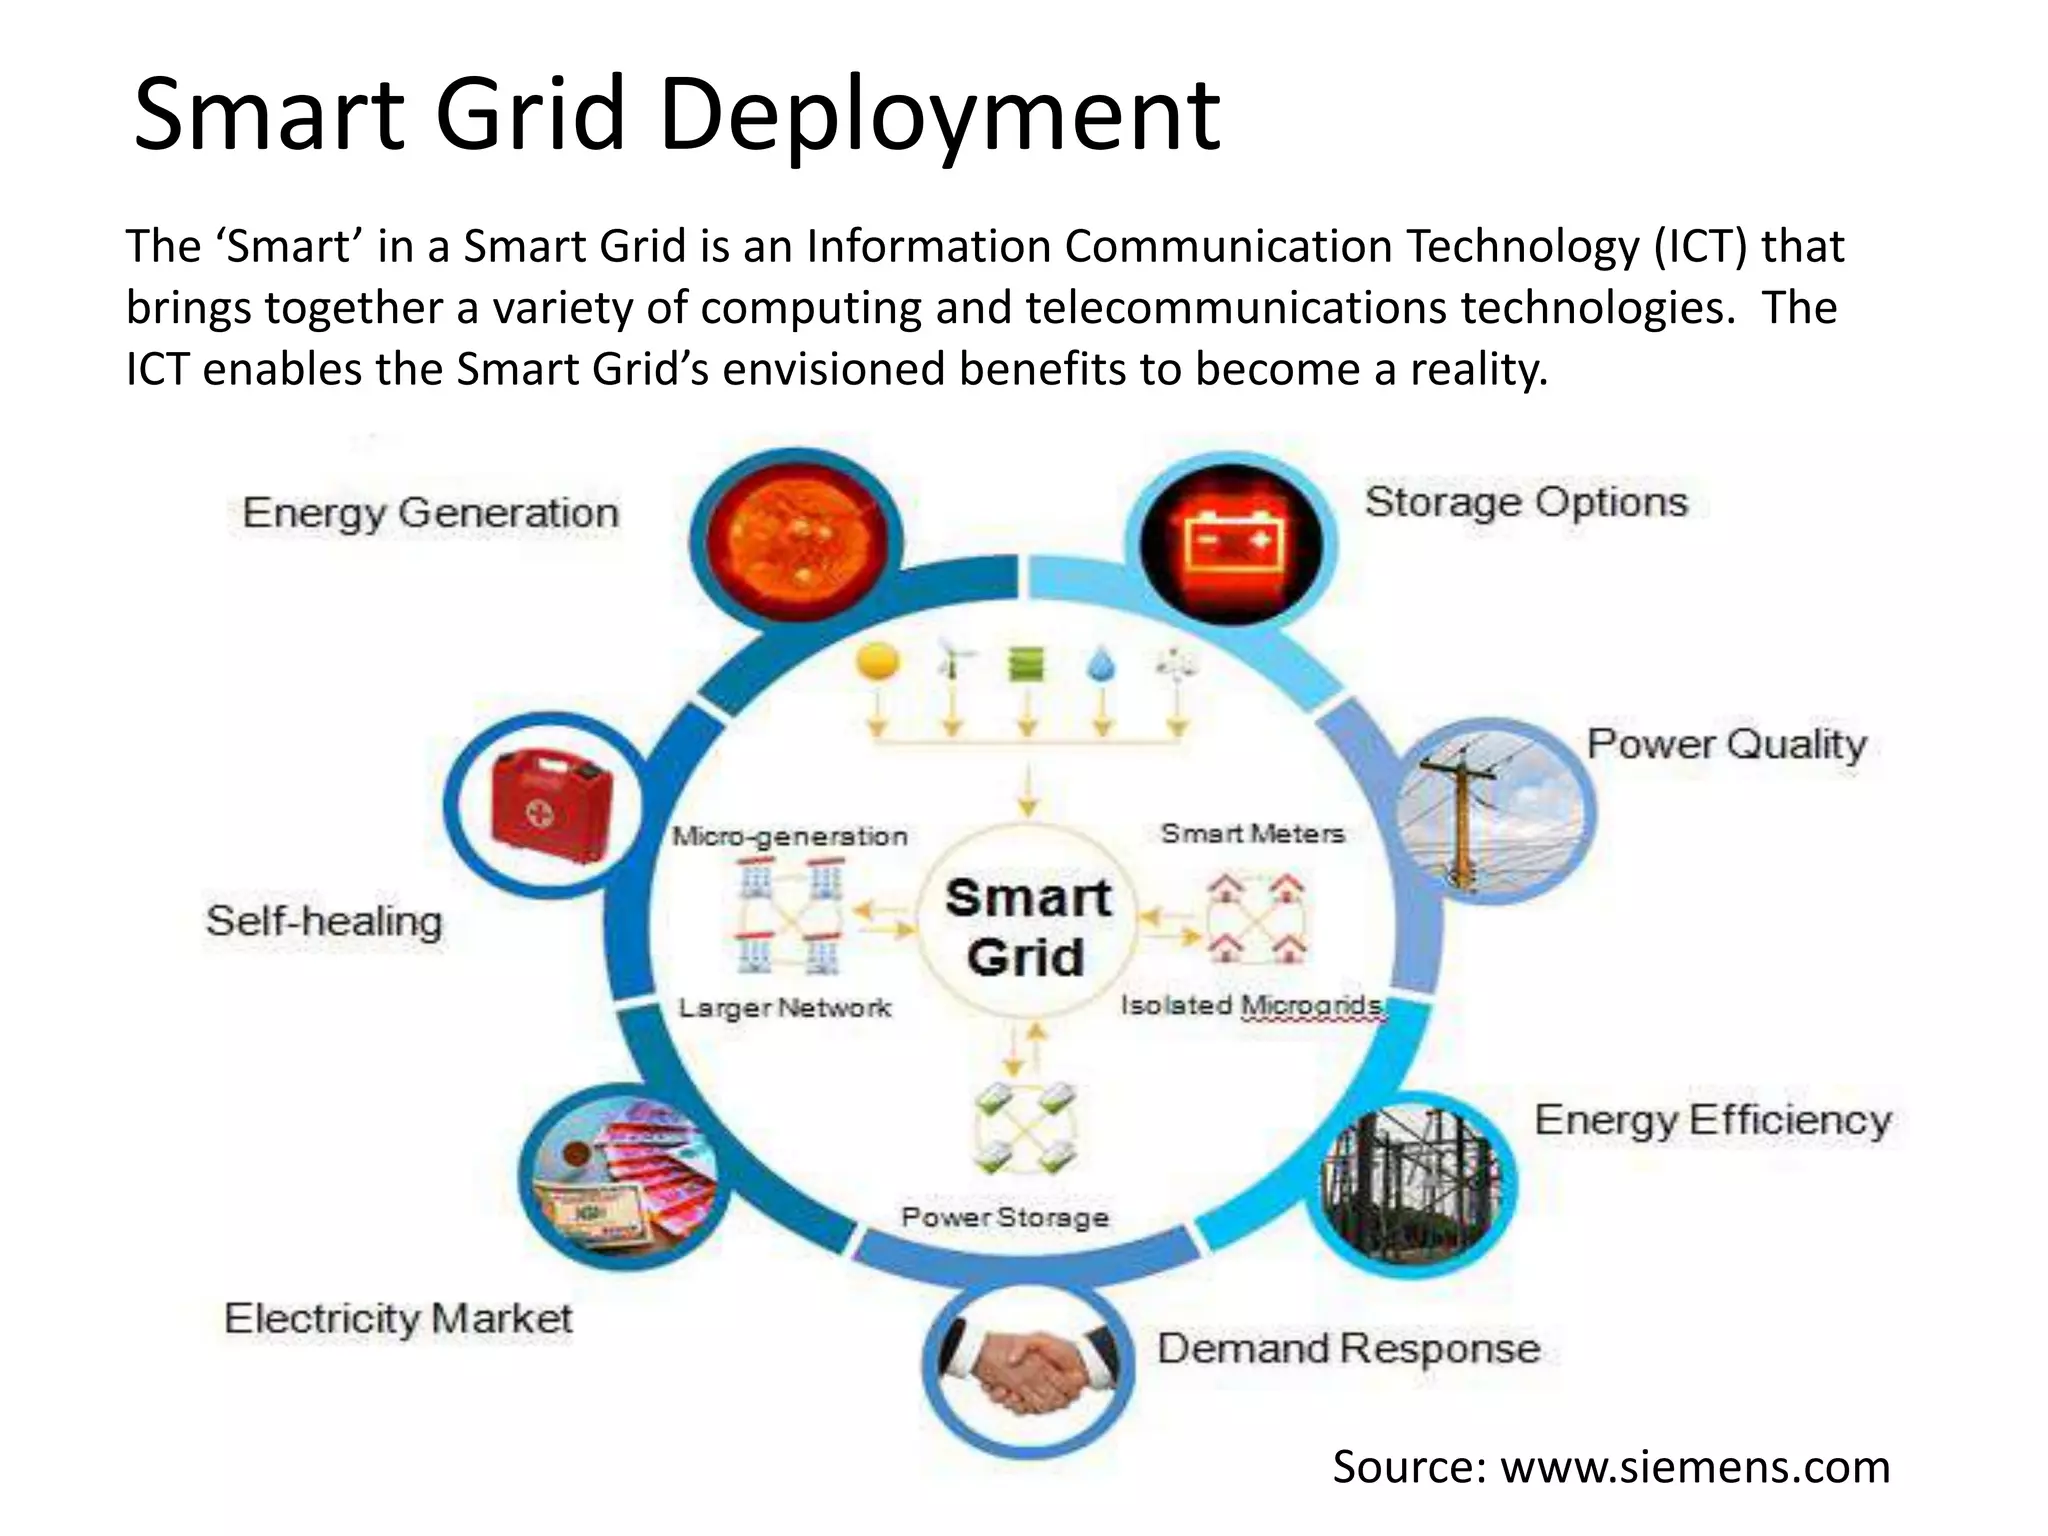
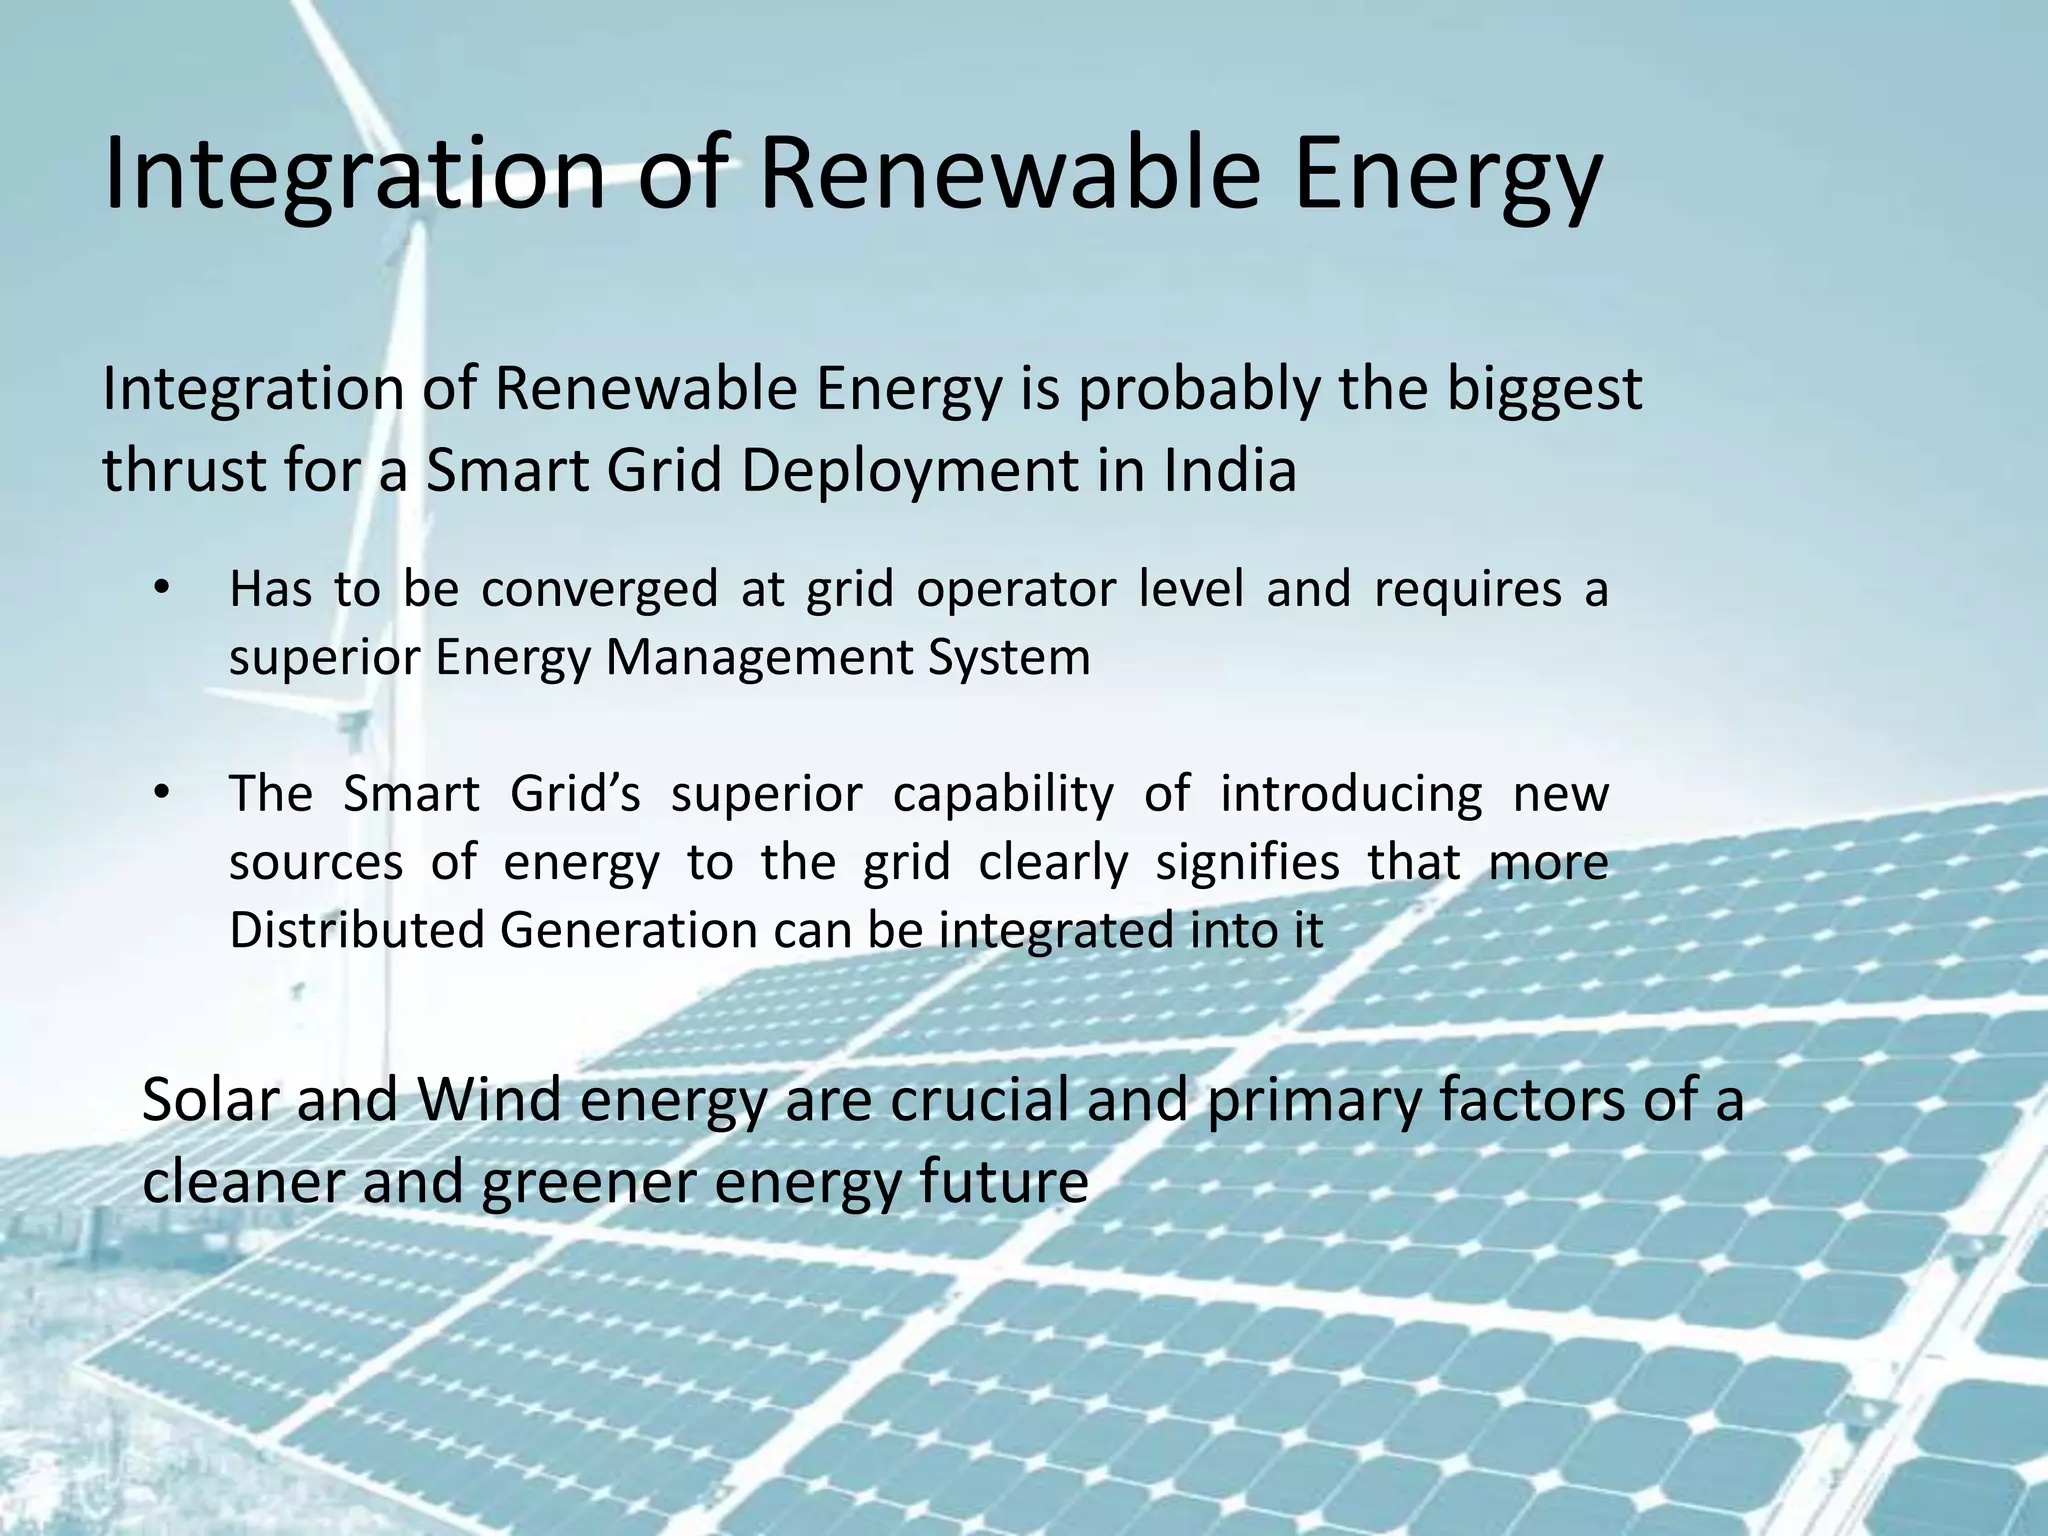
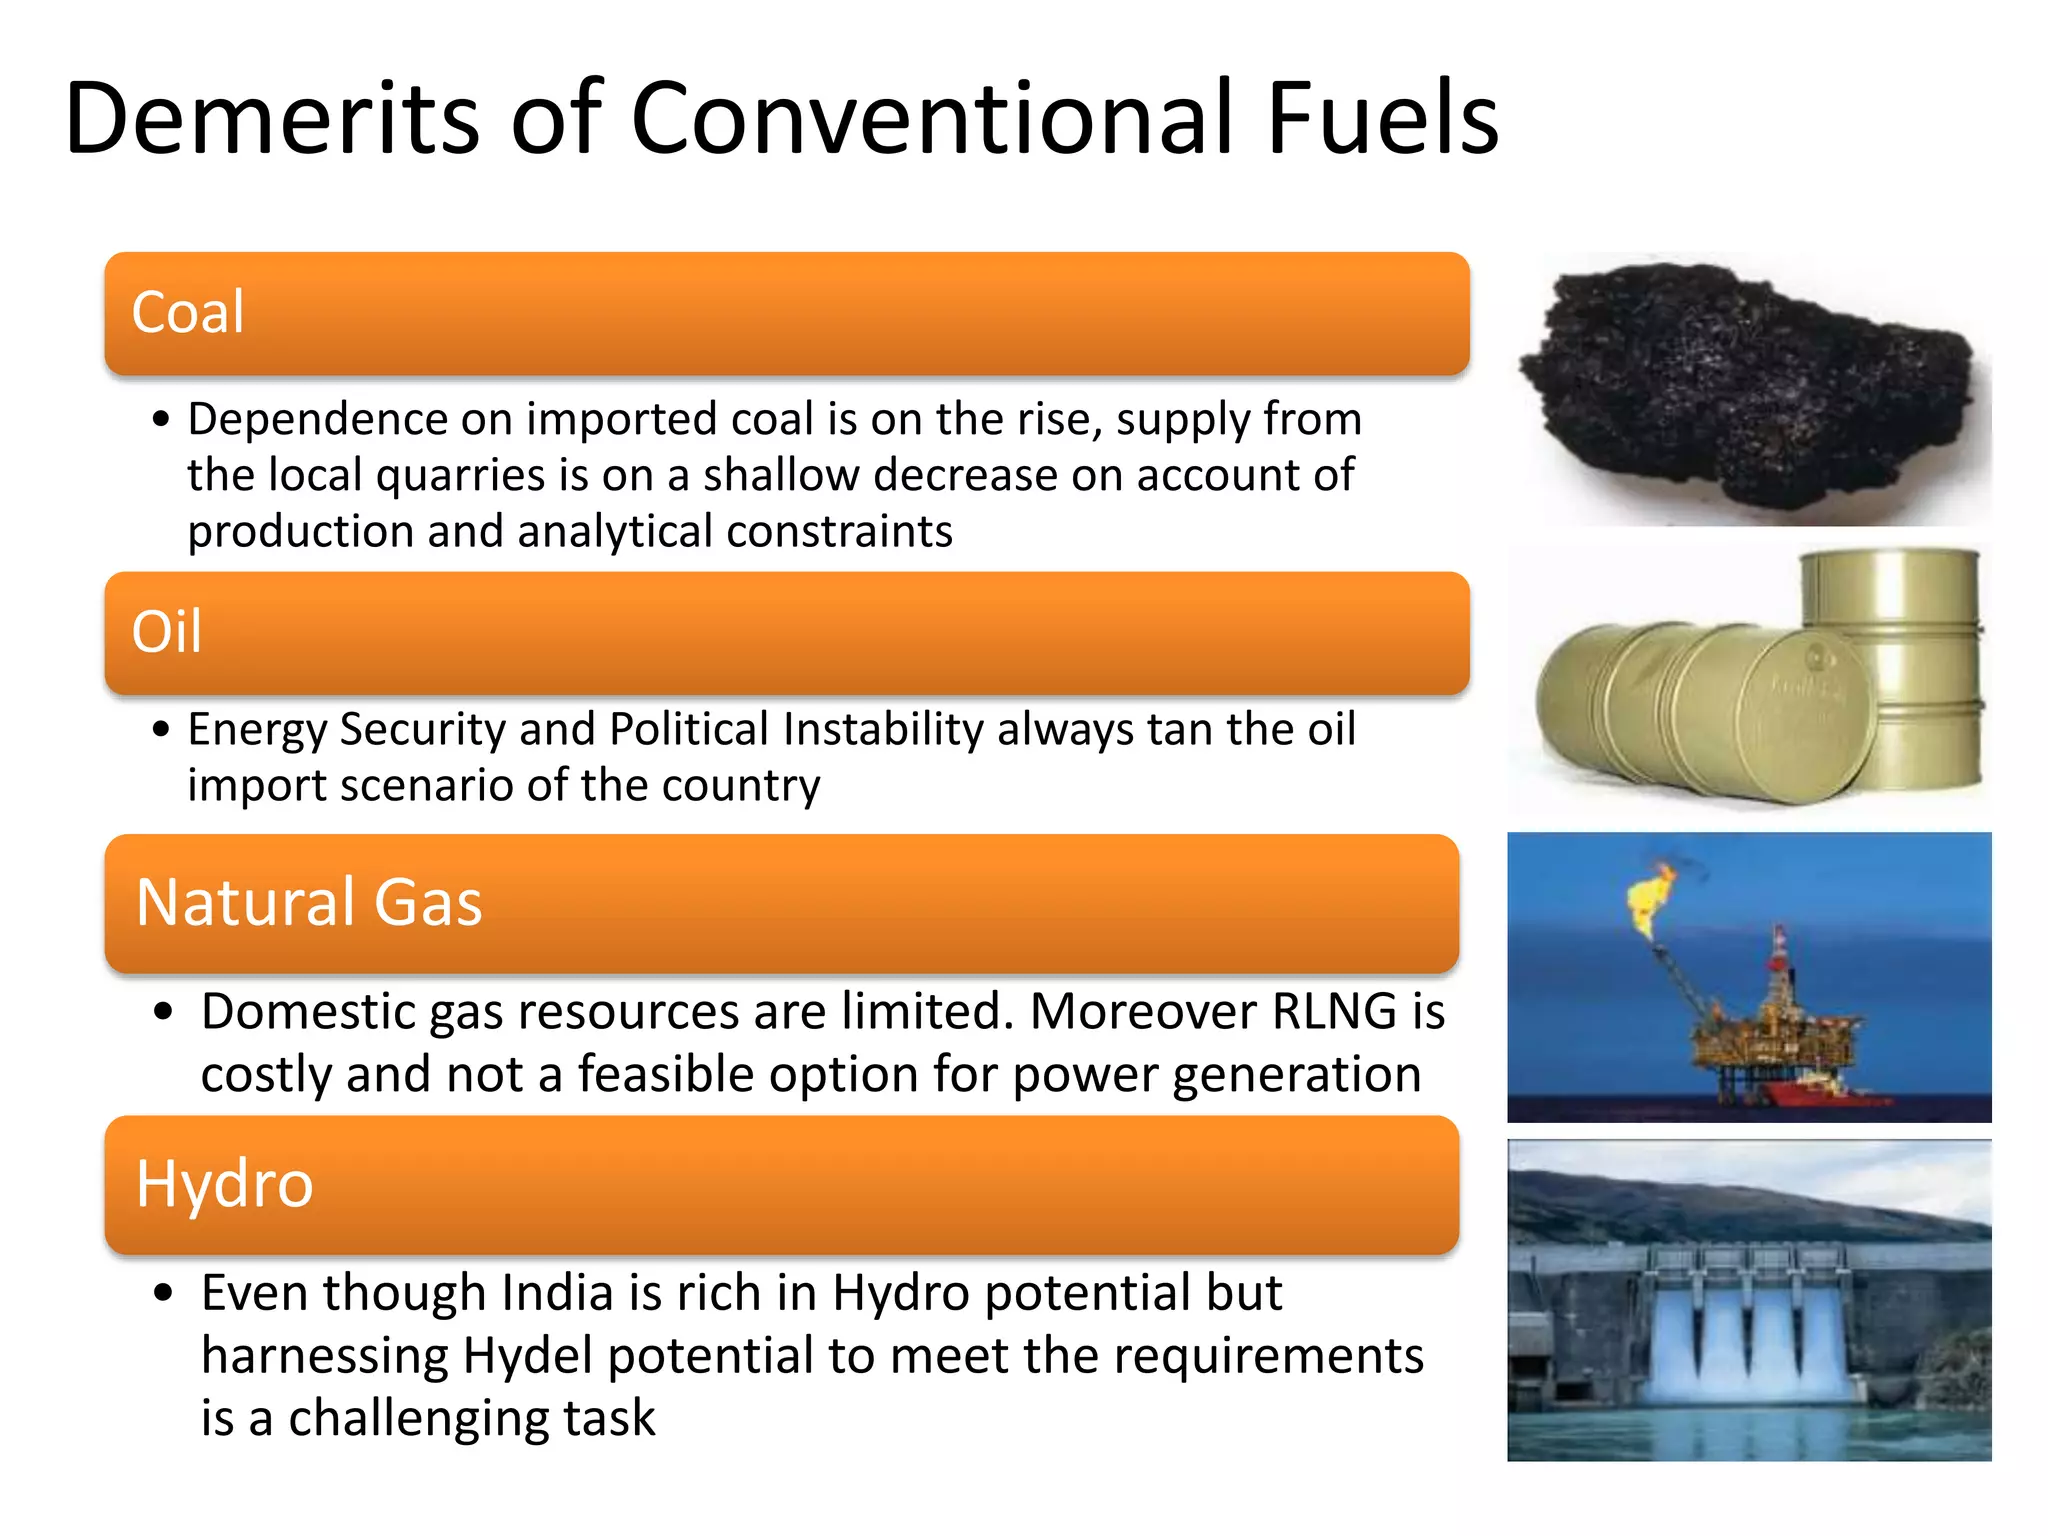
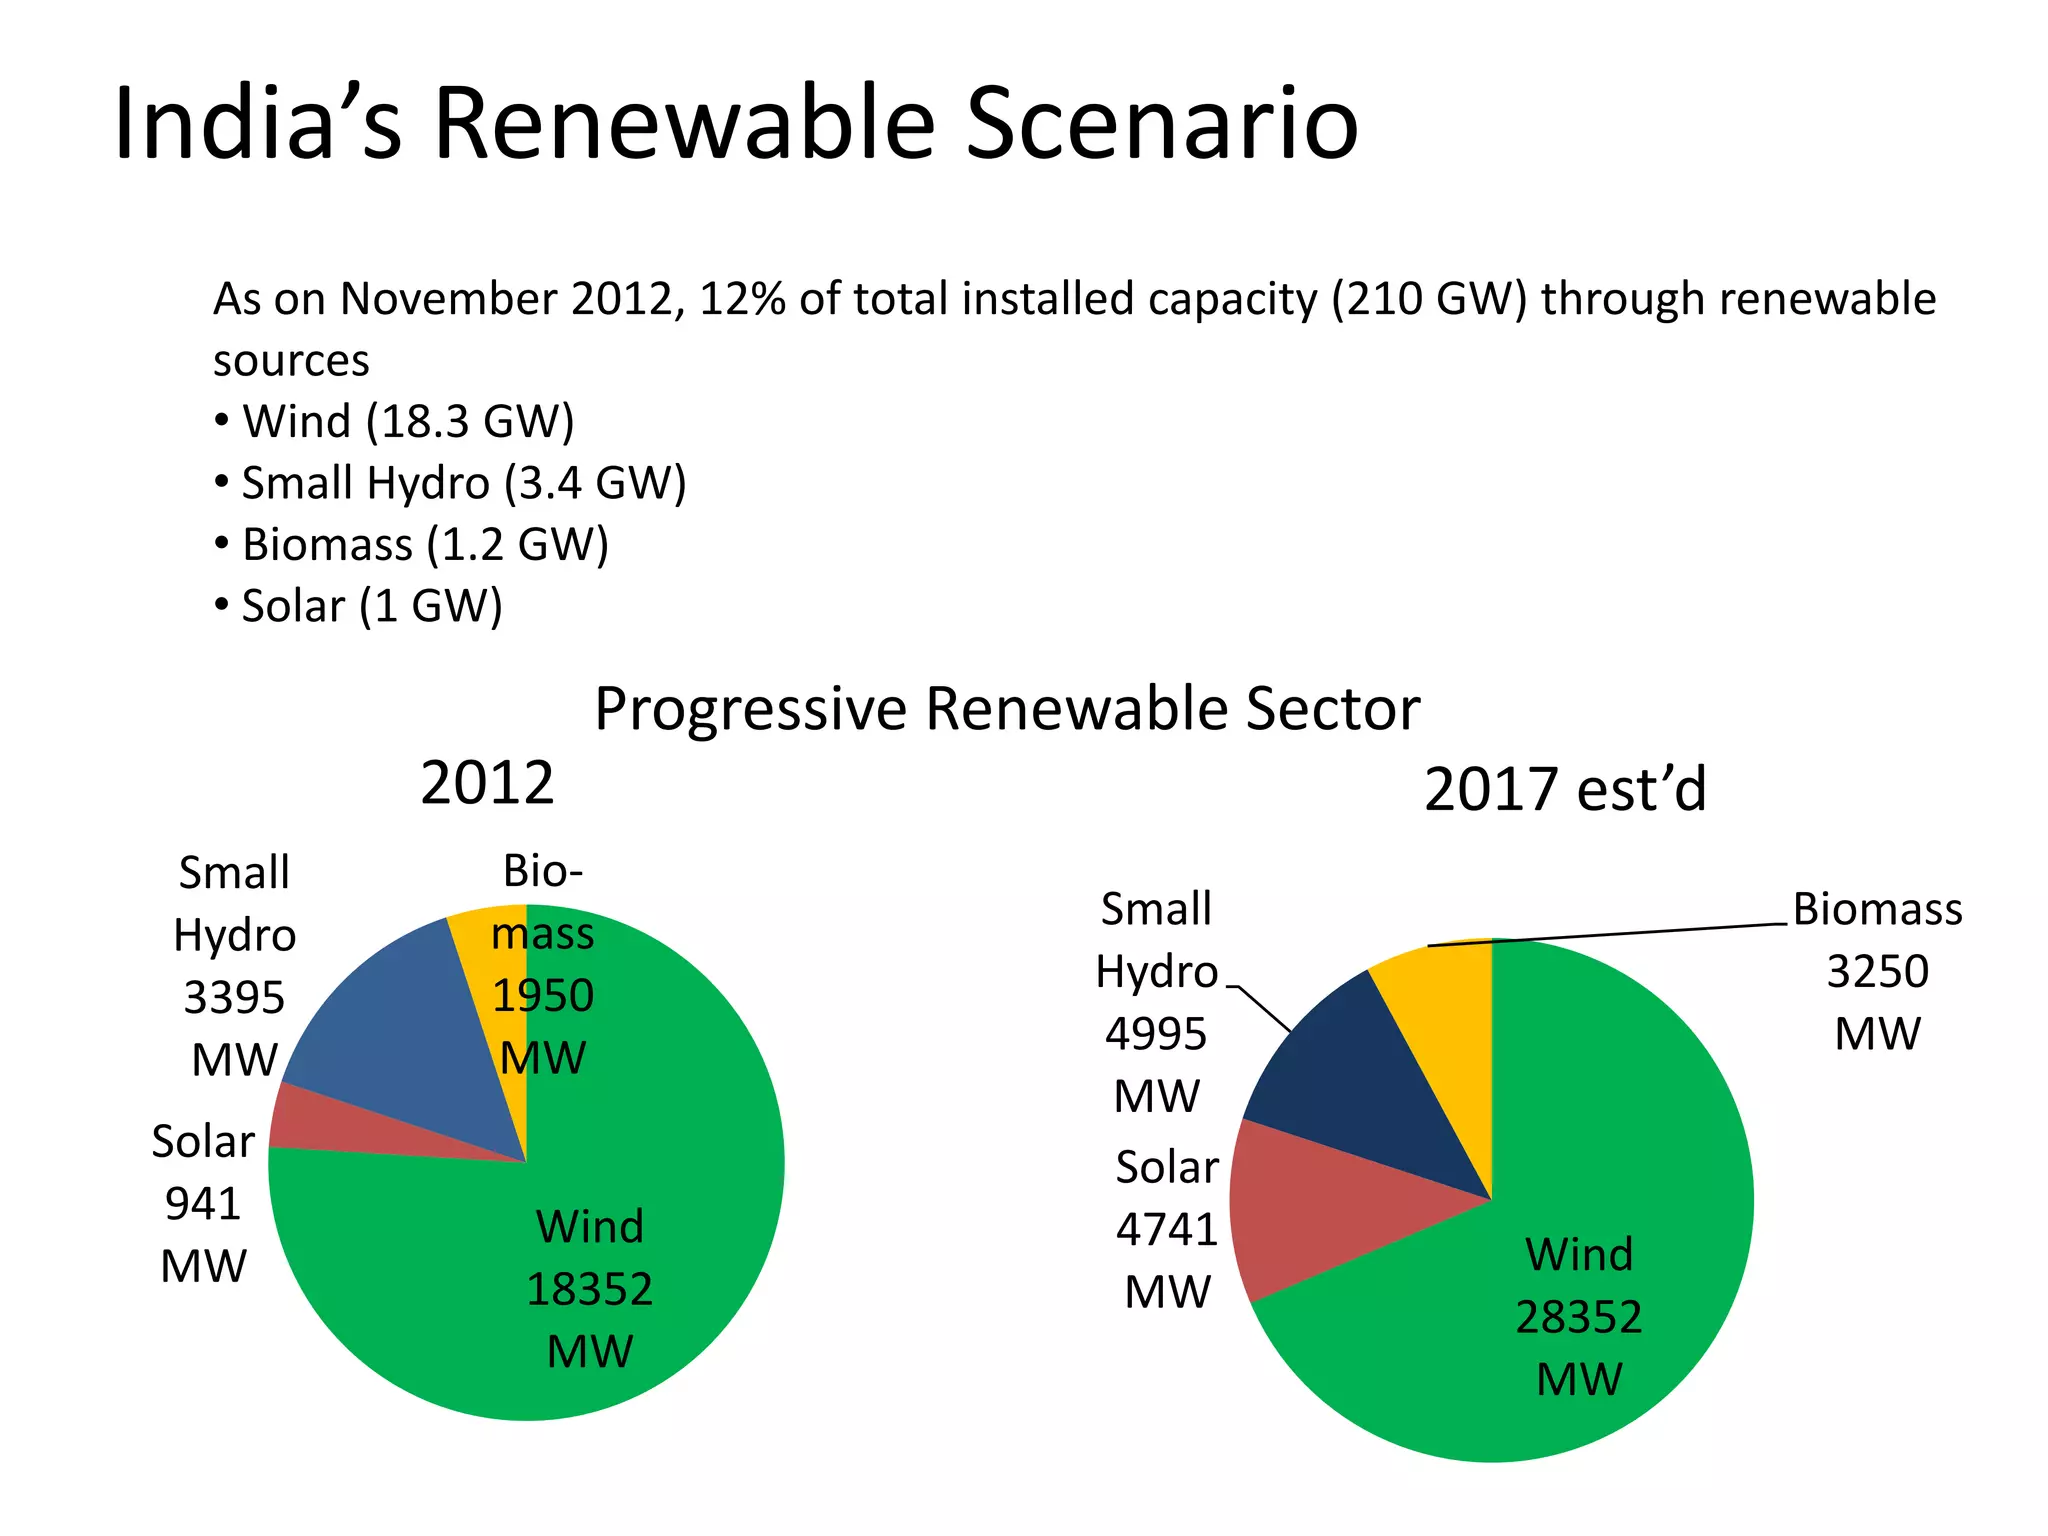
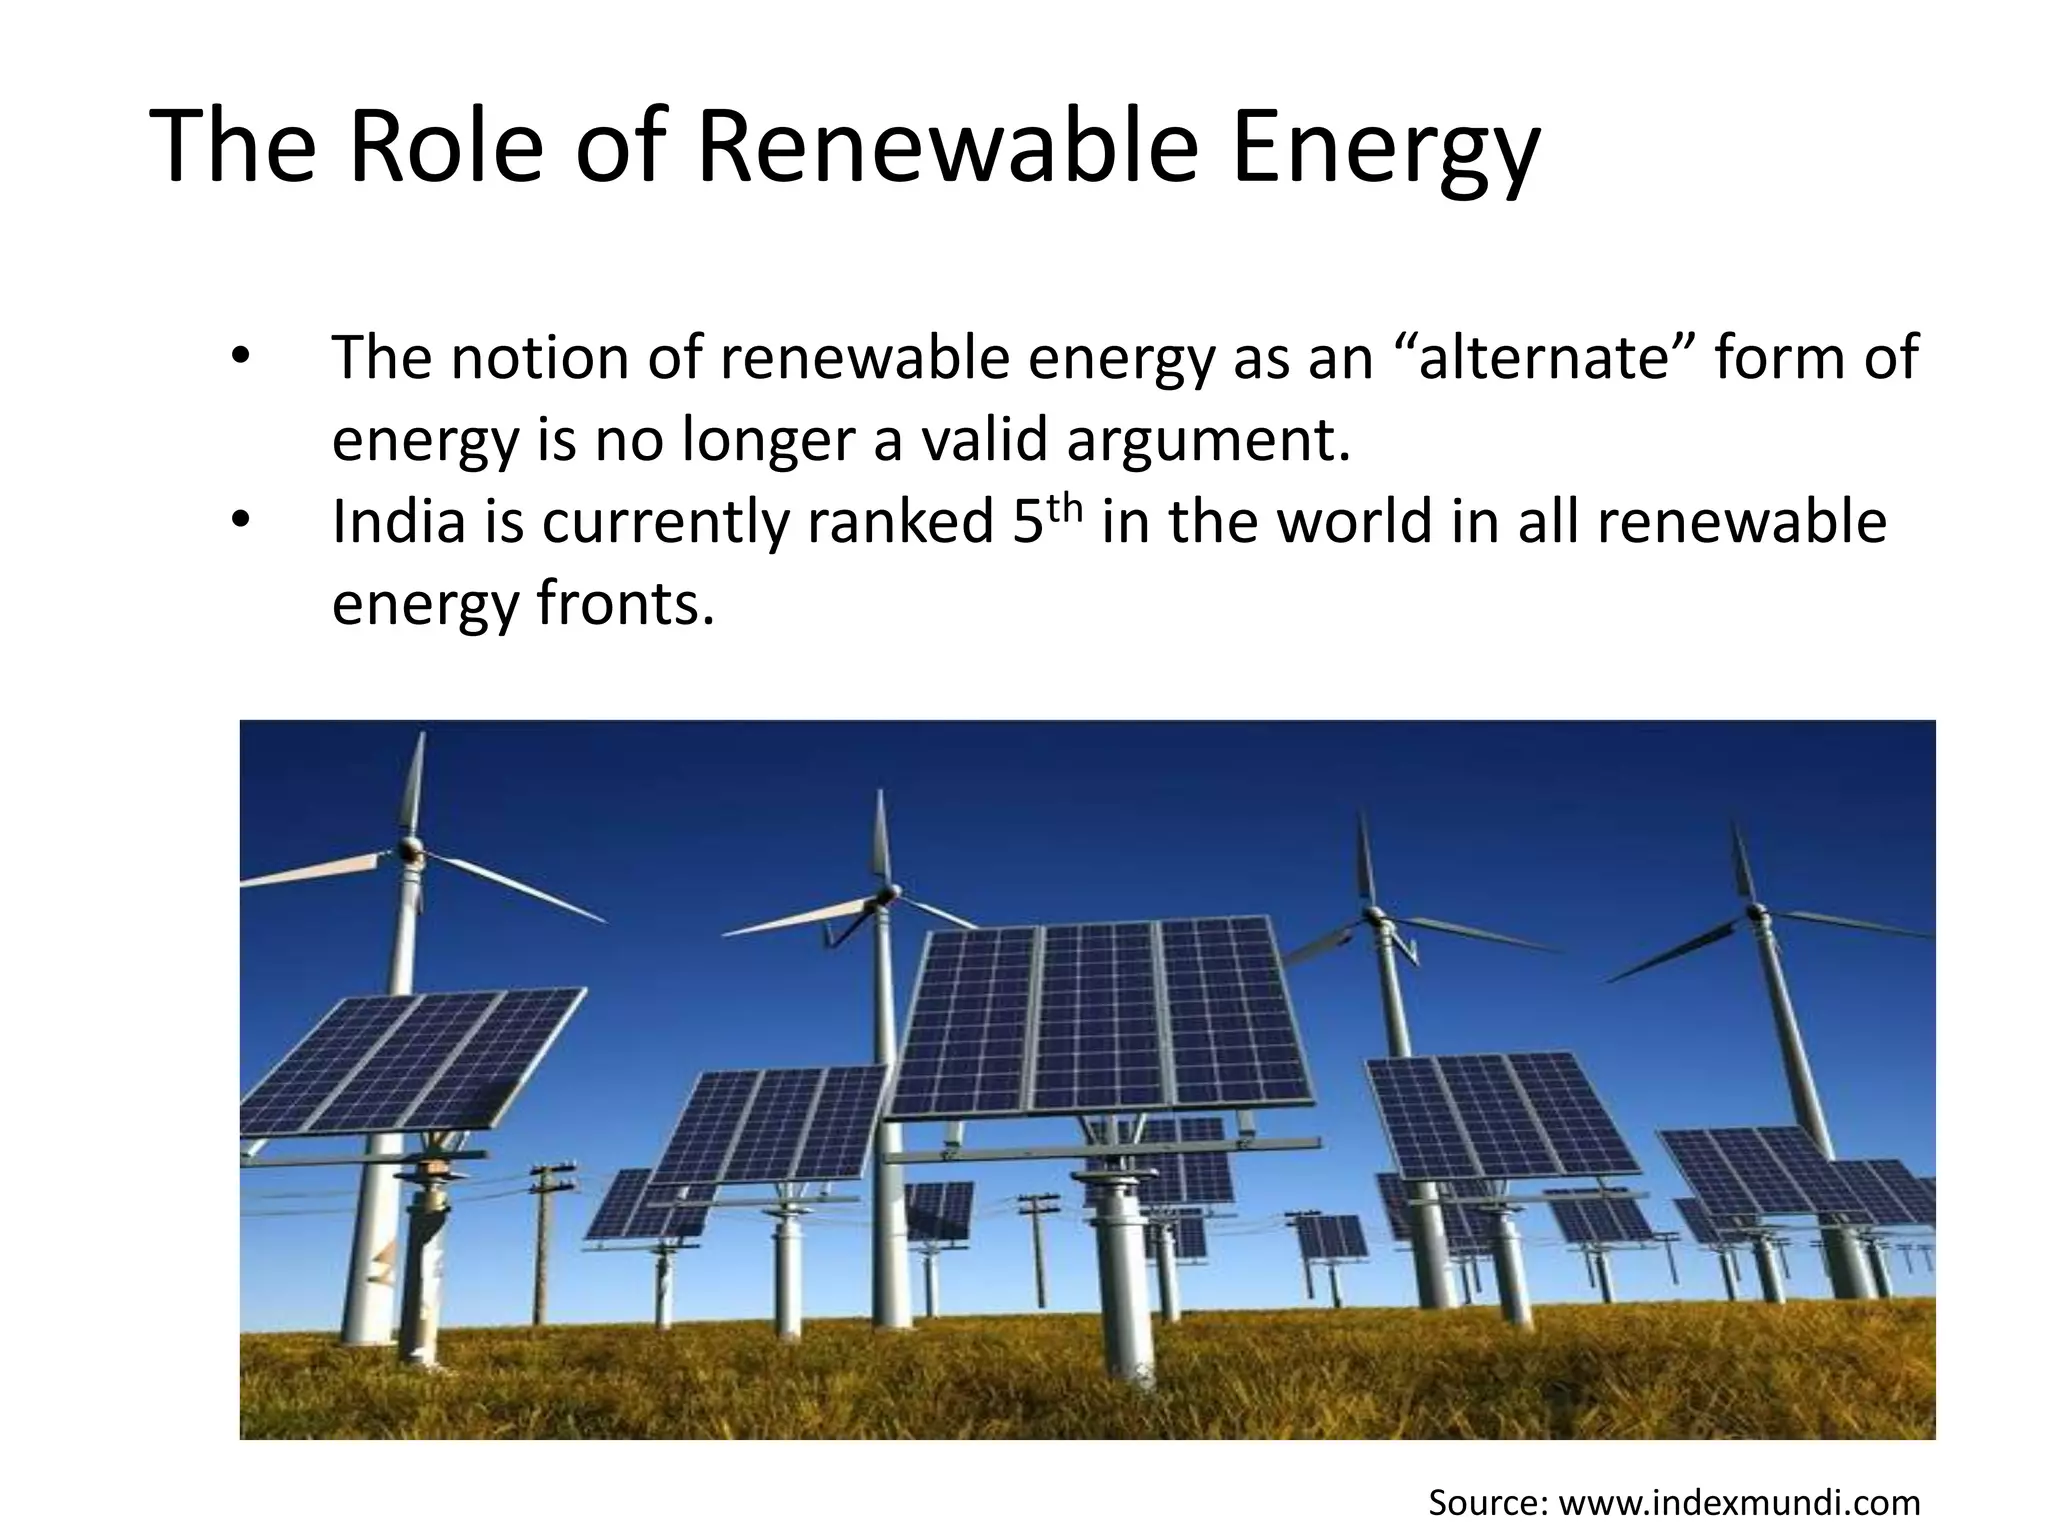
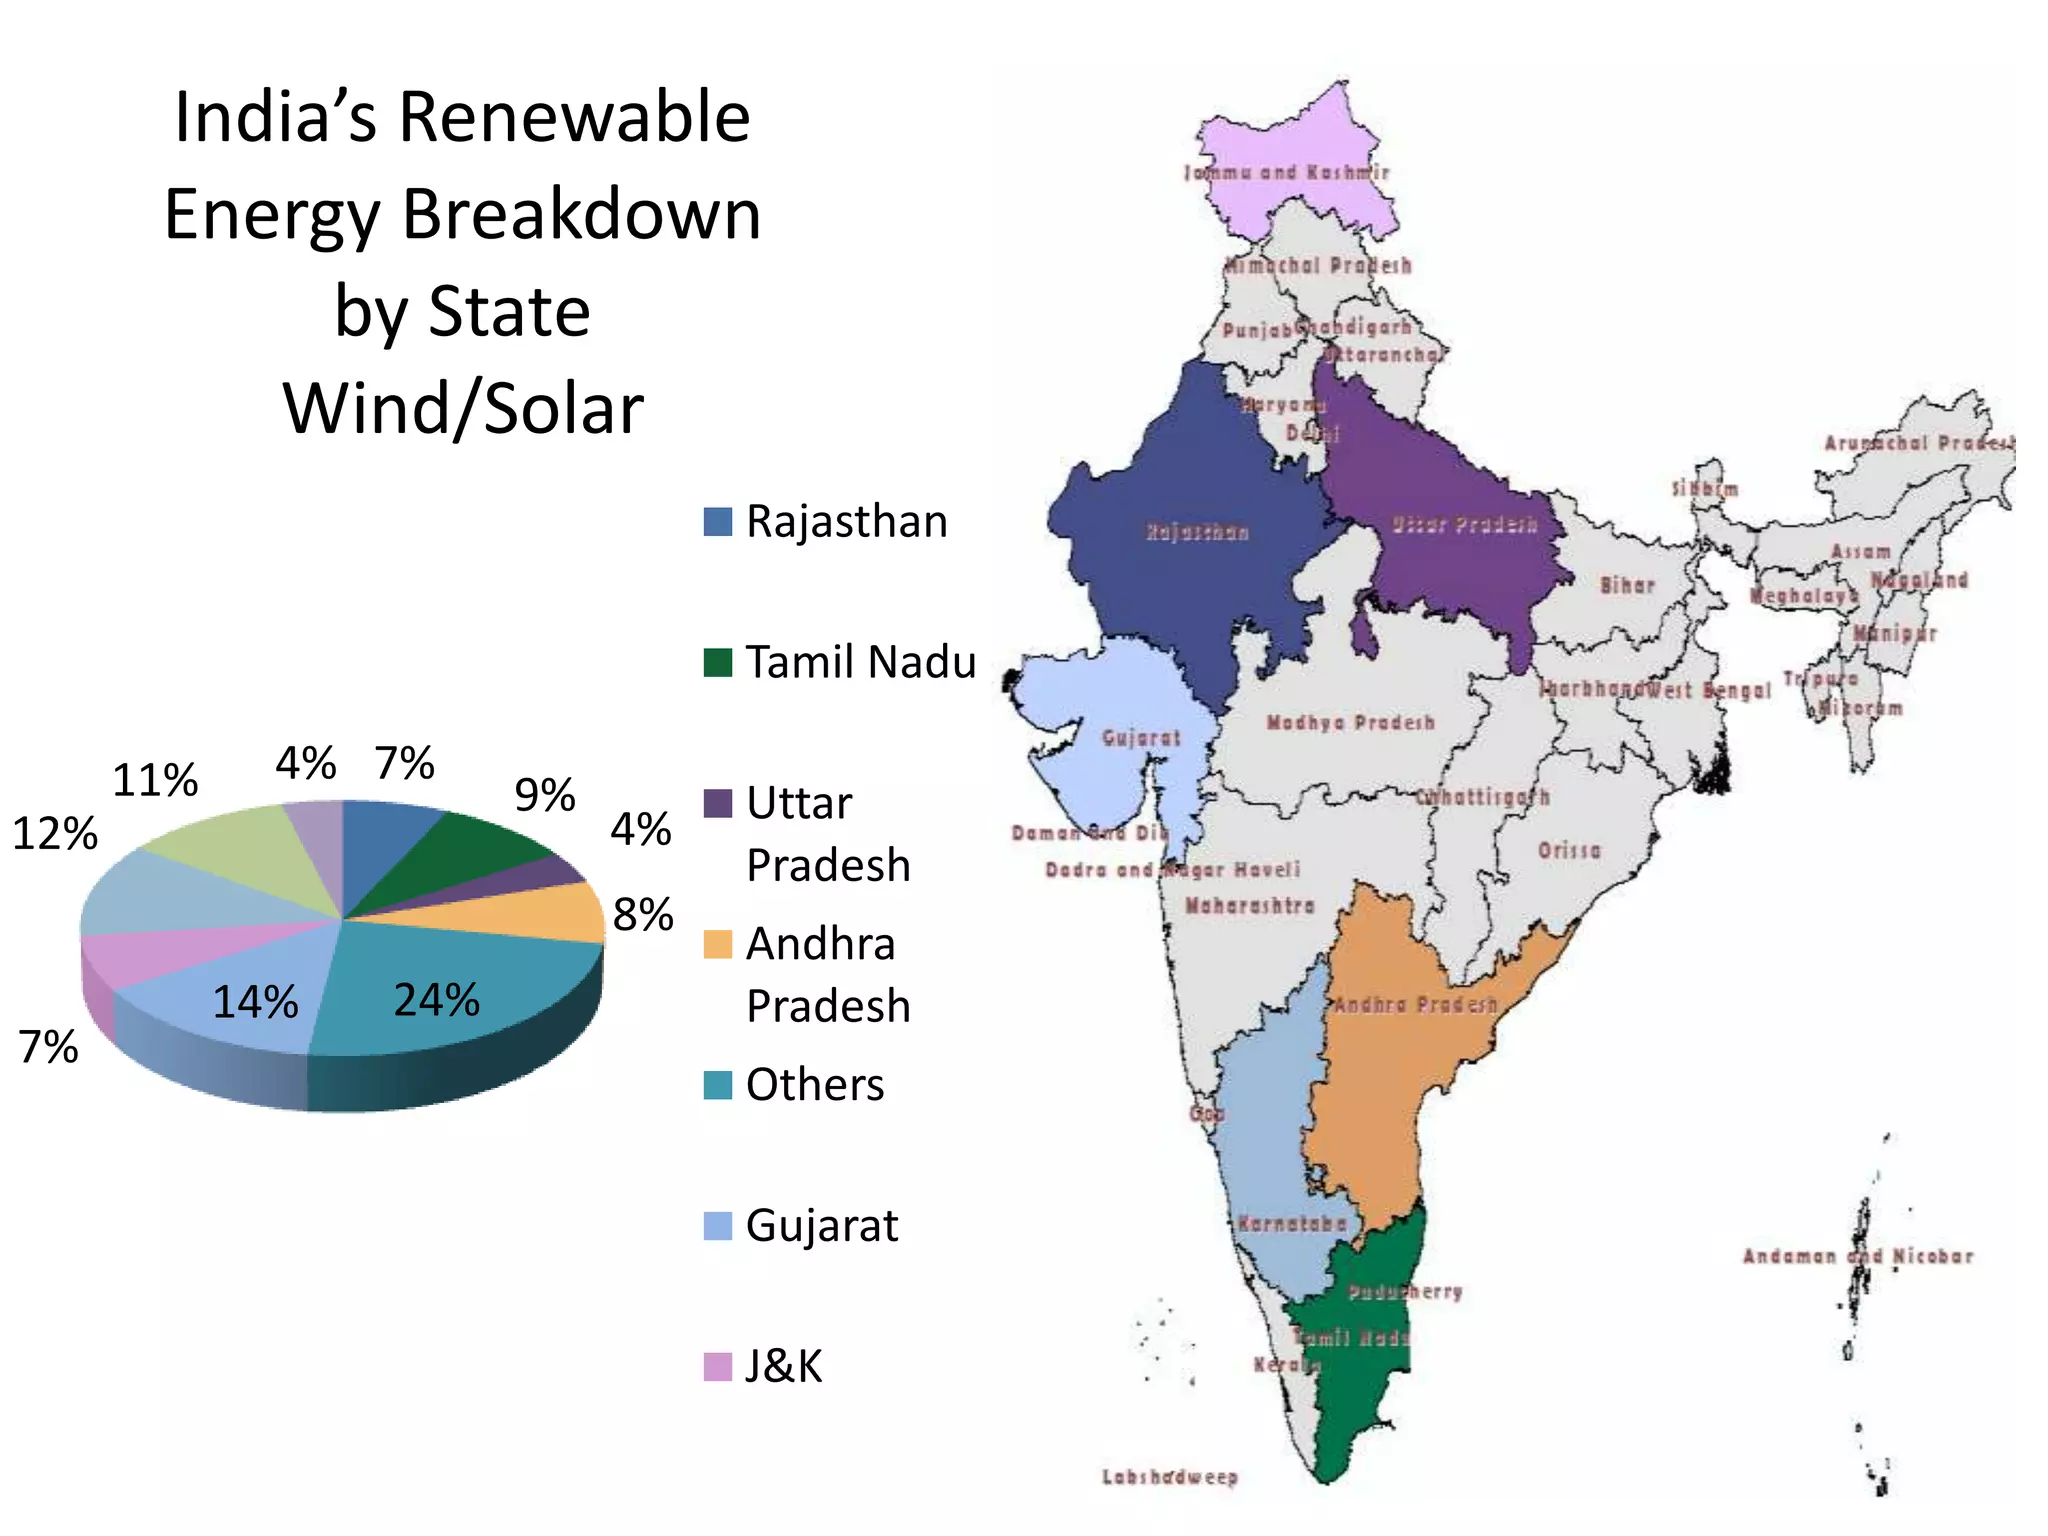
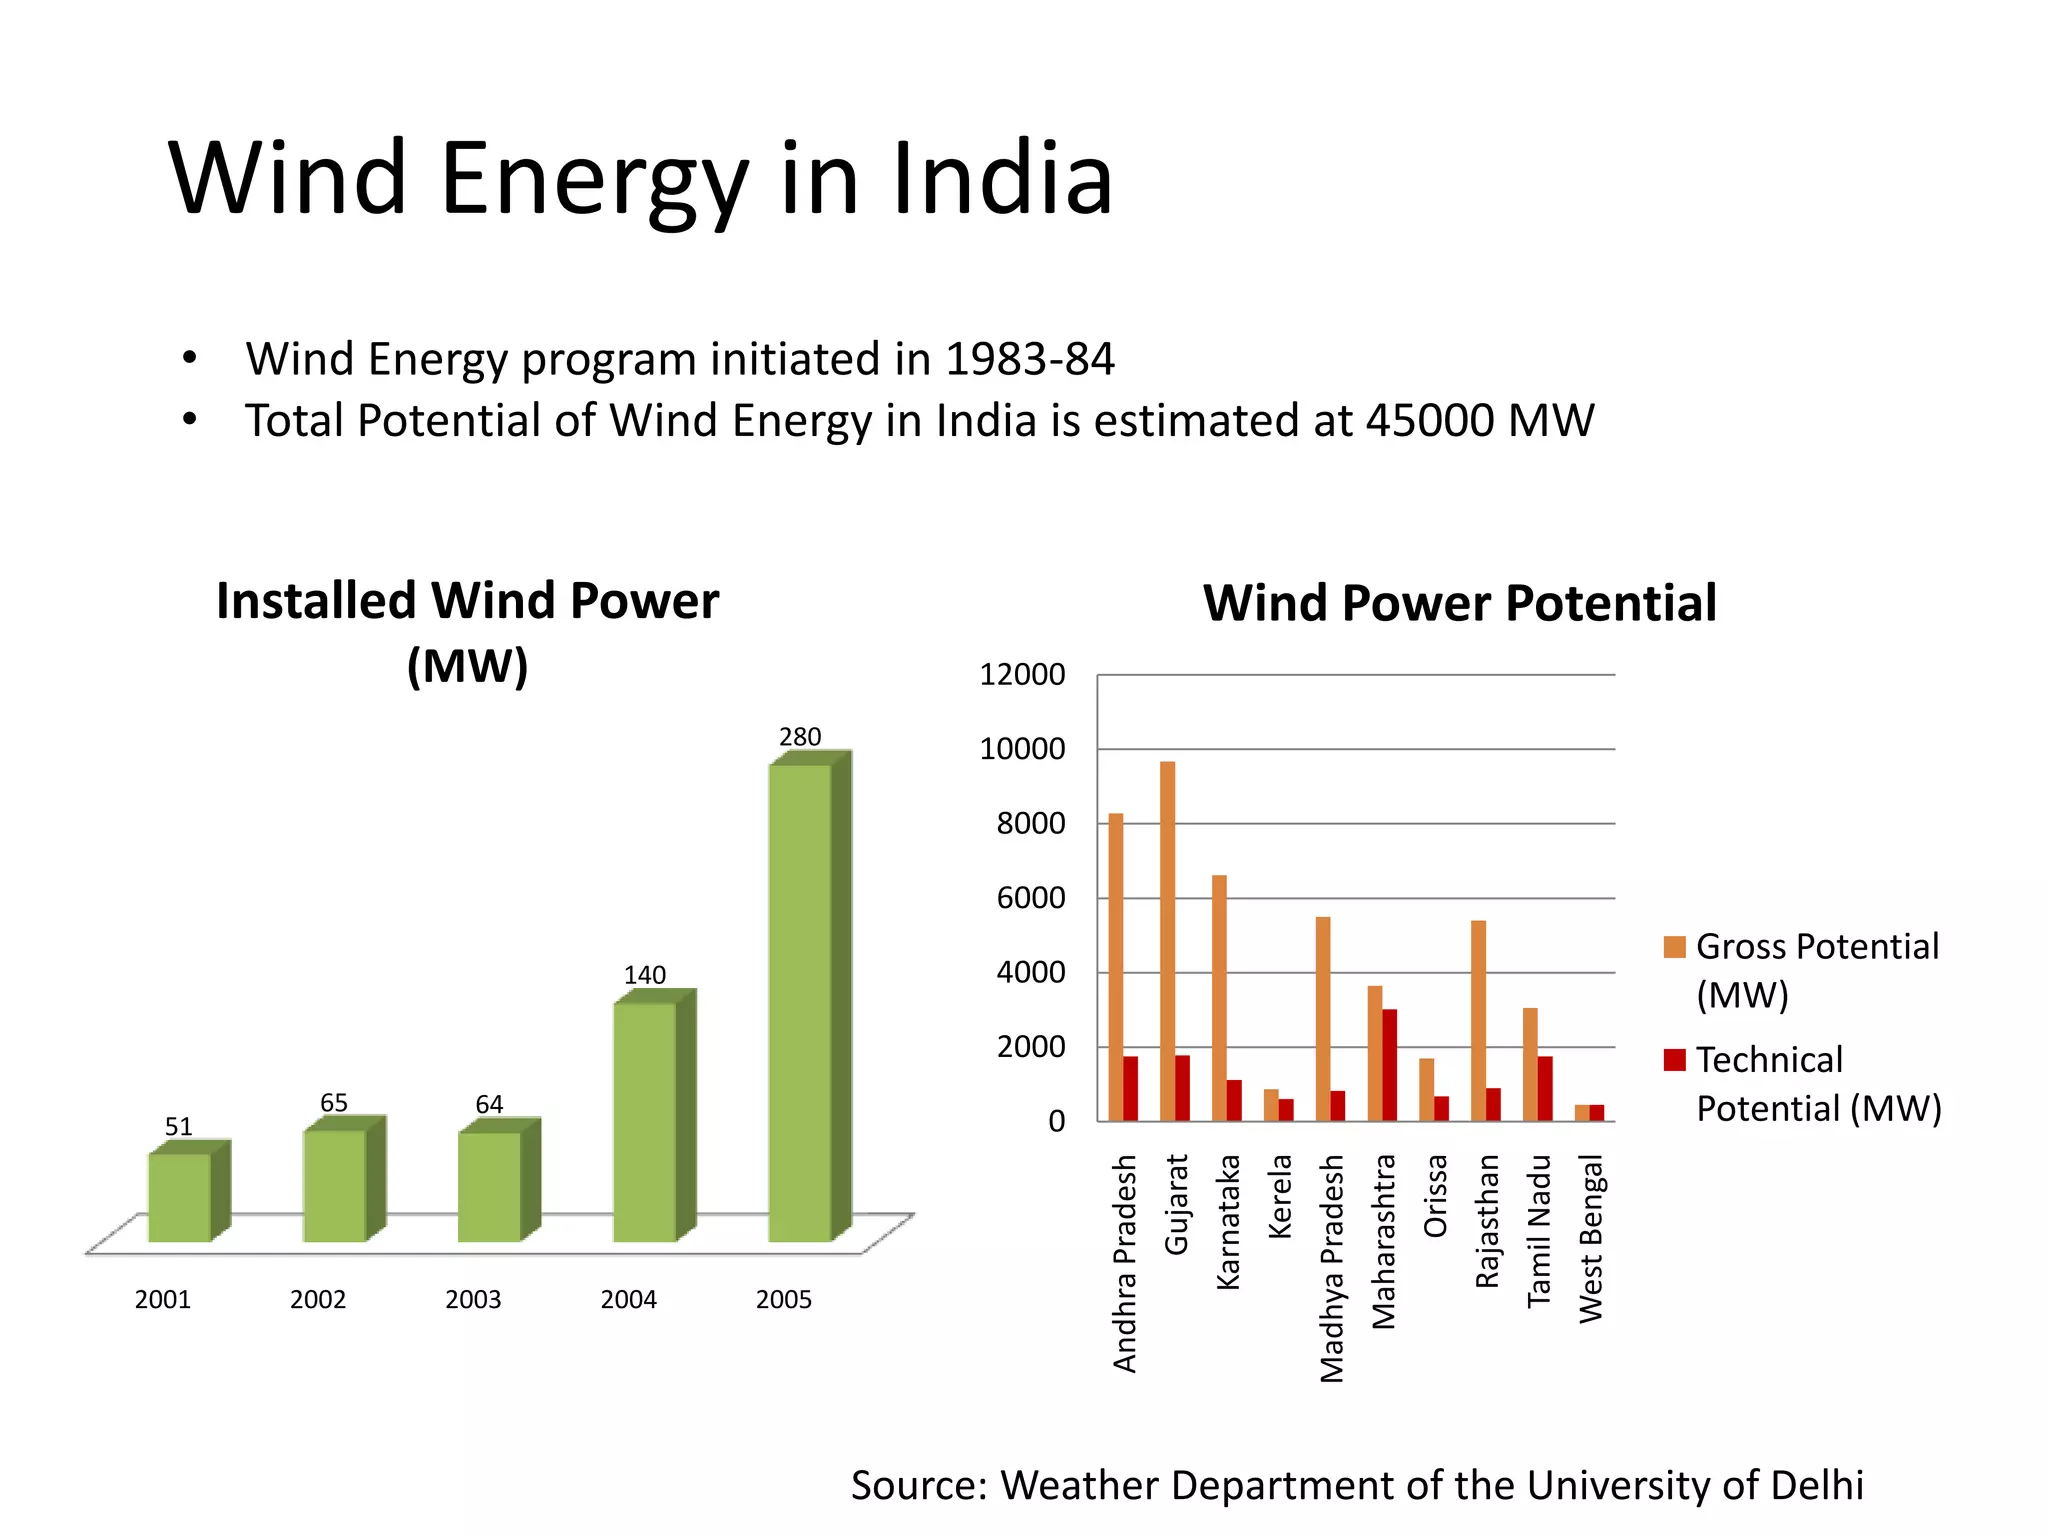
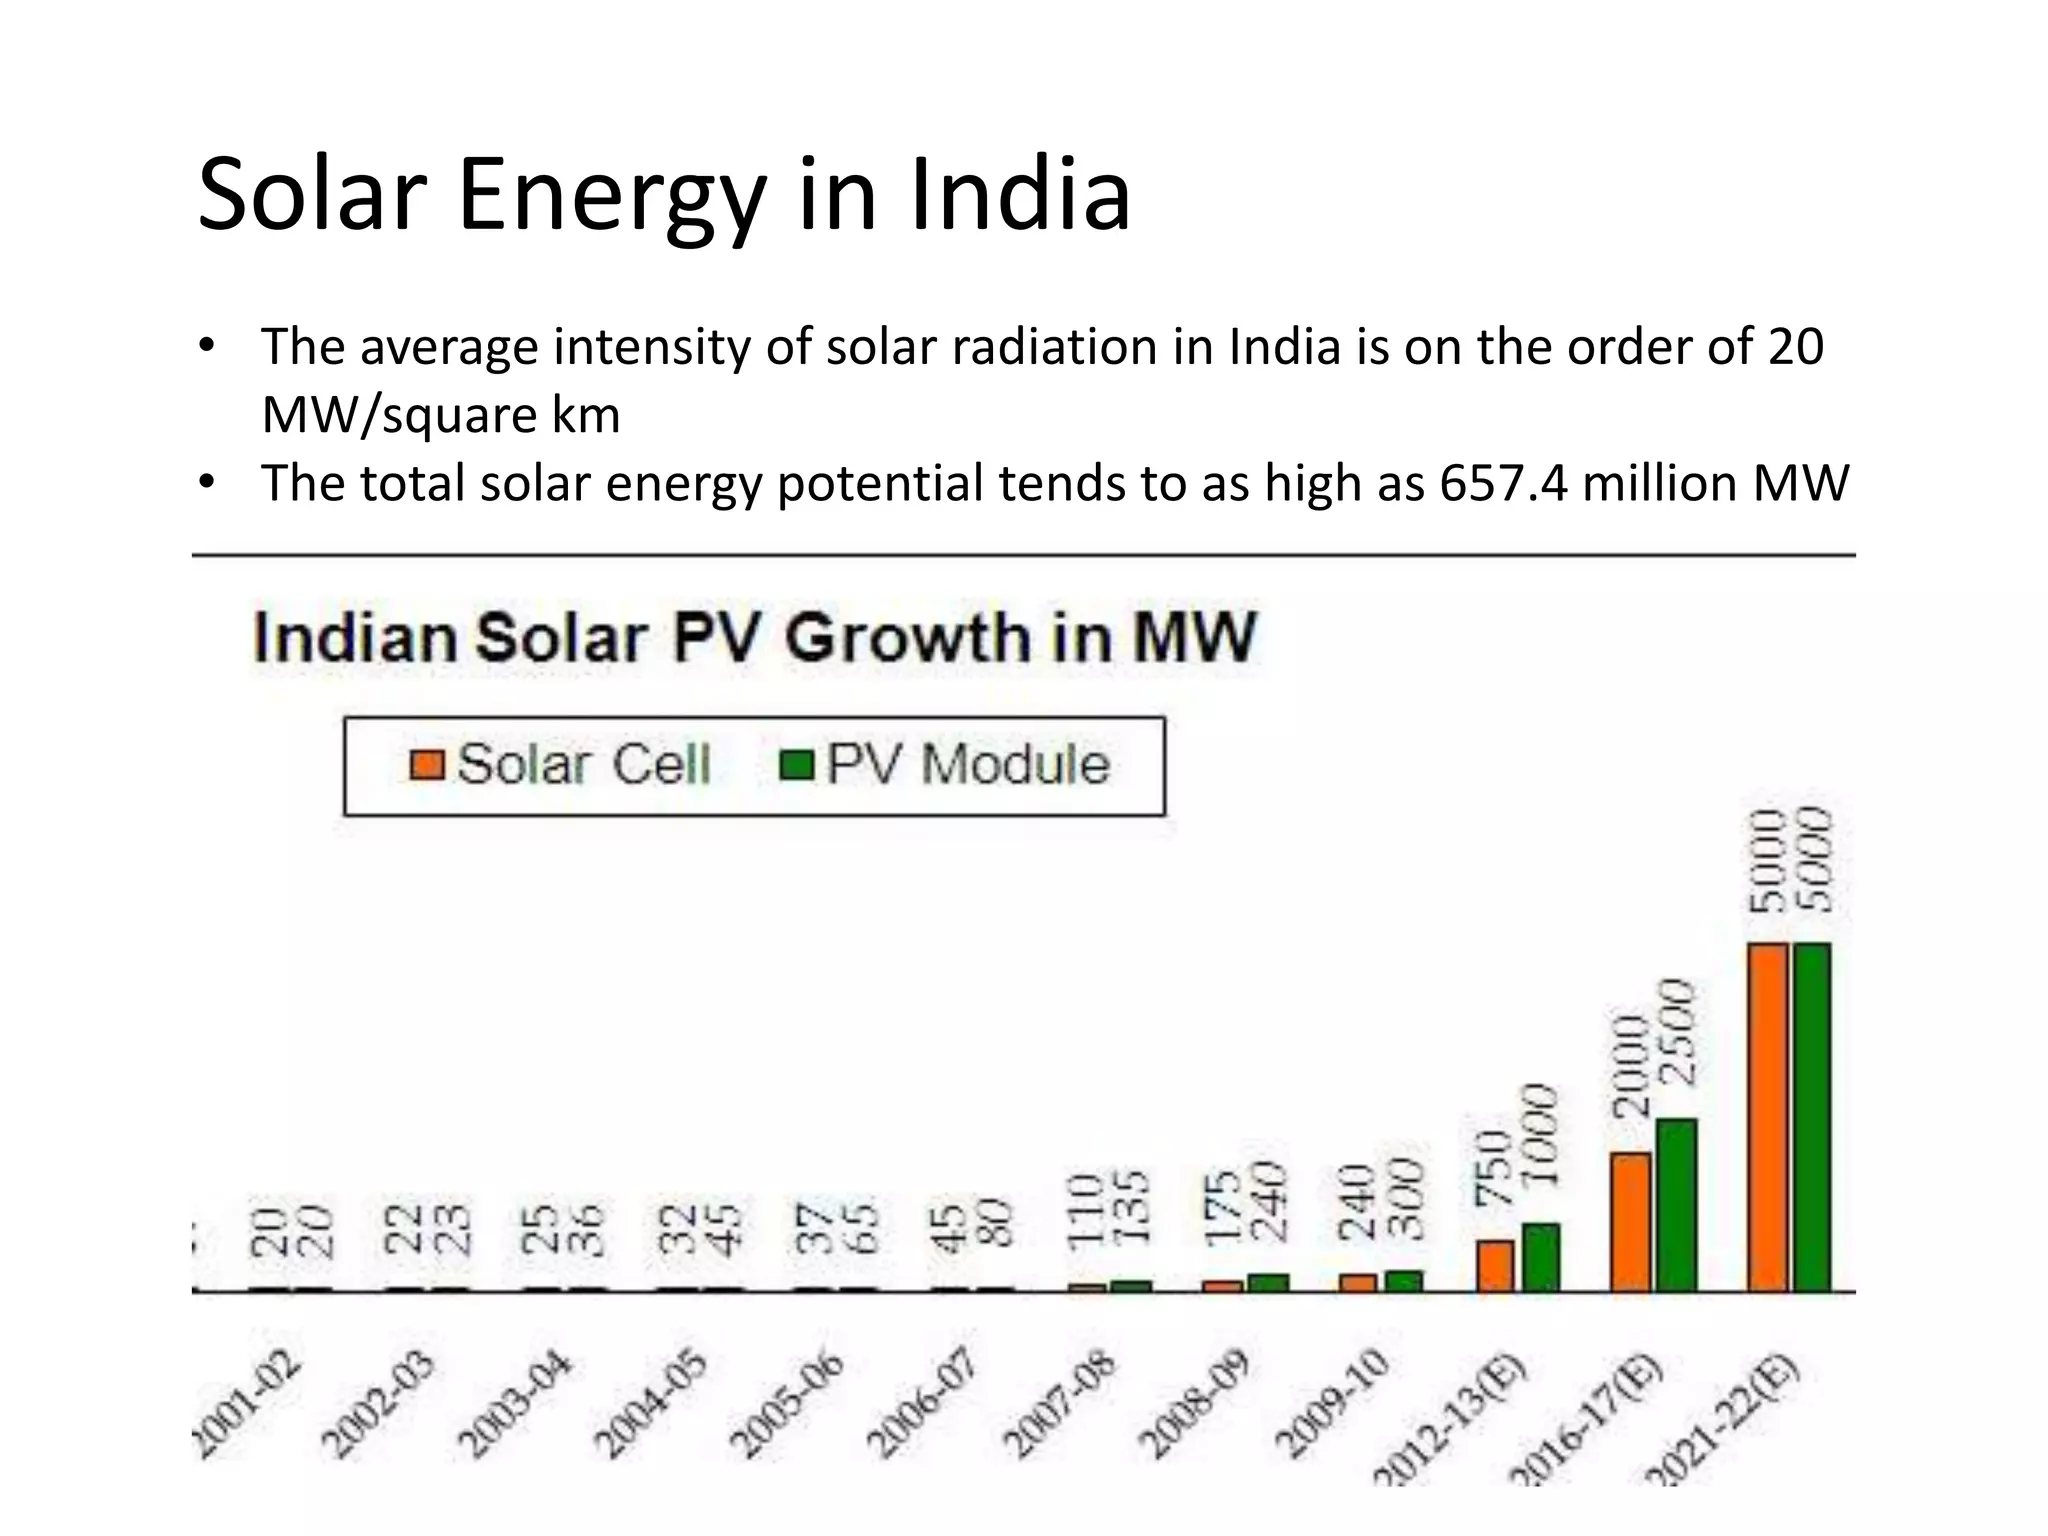
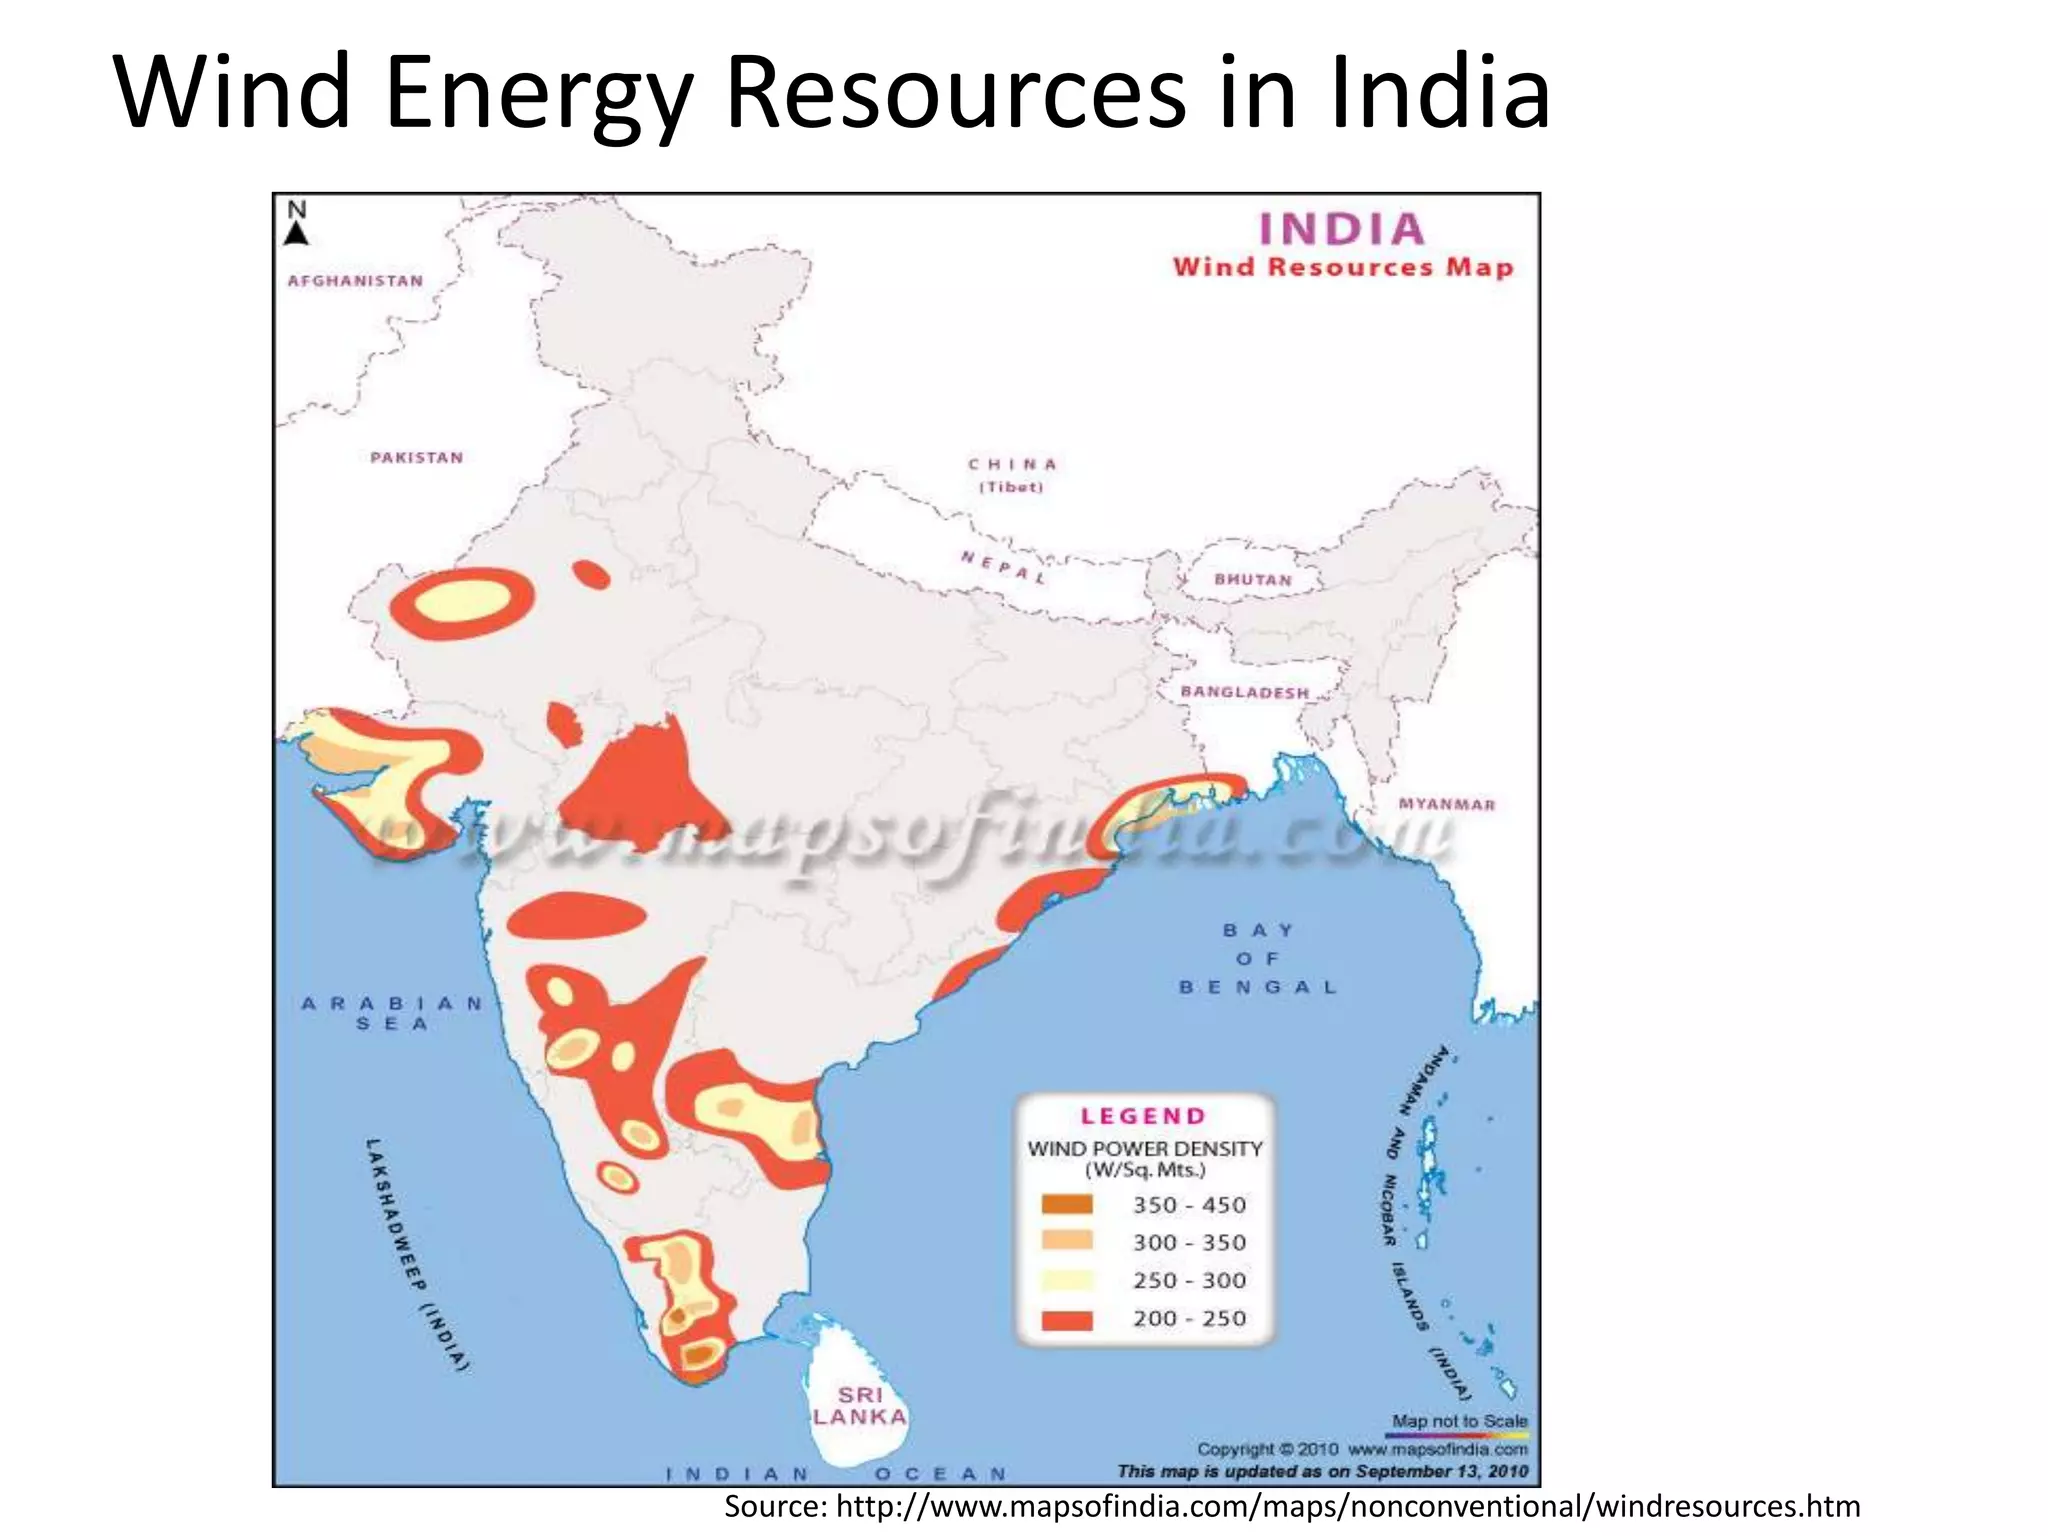
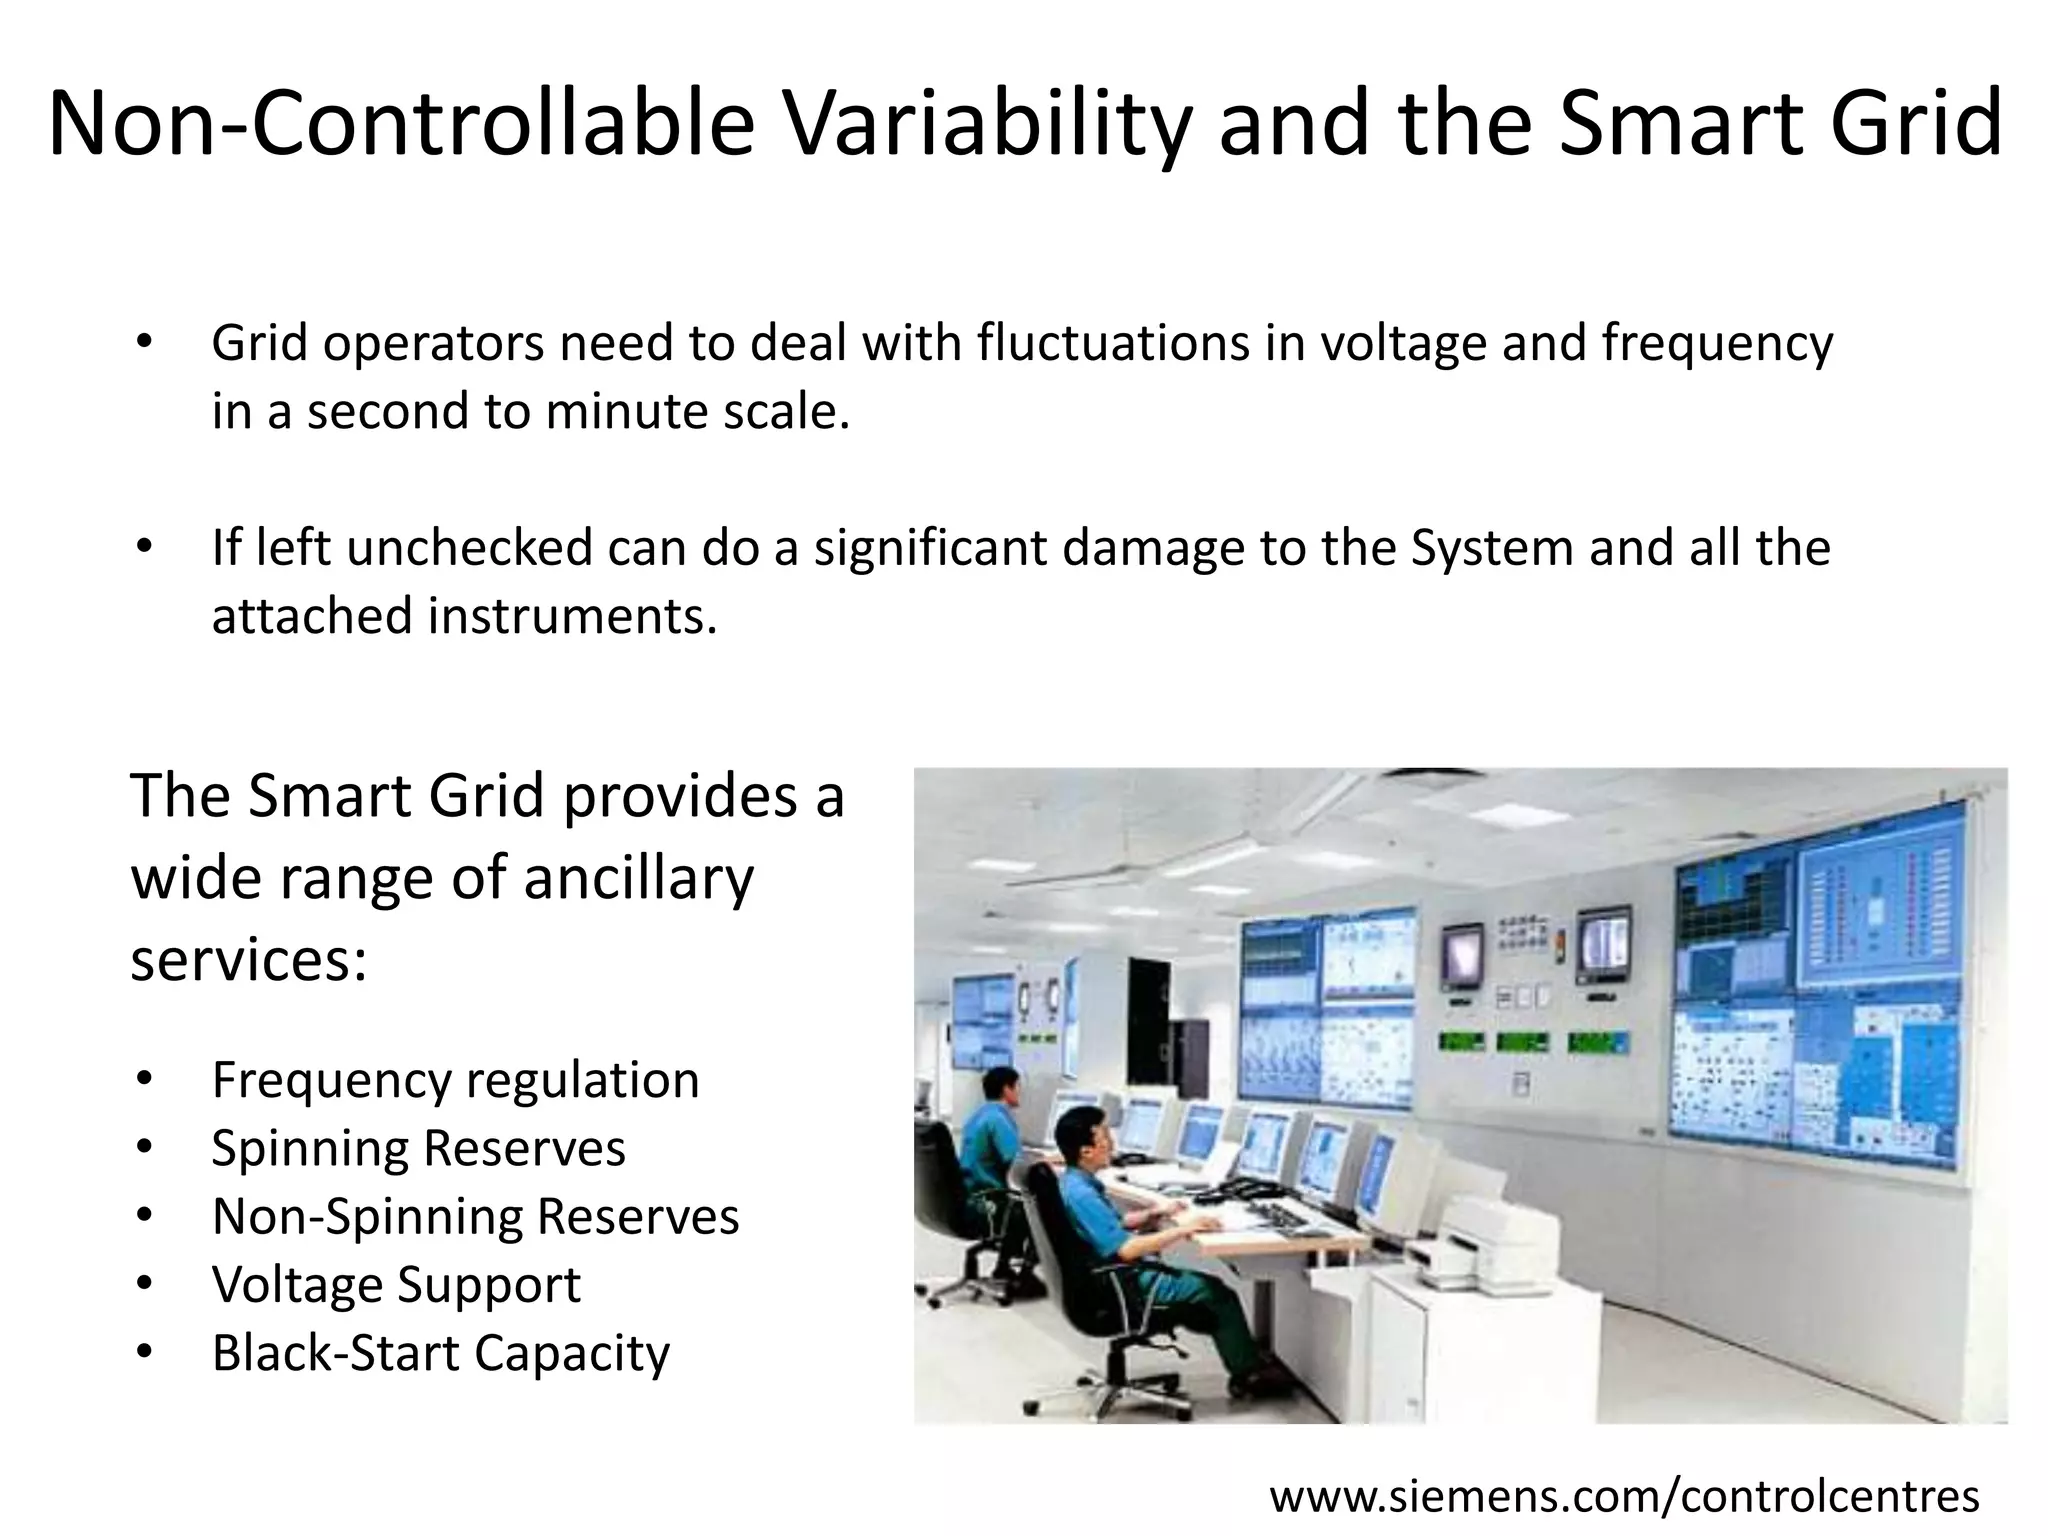


This document discusses India's growing energy needs and the potential for integrating renewable energy sources like wind and solar through a smart grid platform. India's population and economy are rising rapidly, increasing energy demand, but the current power infrastructure relies heavily on fossil fuels and faces issues like shortages, losses, and an inability to accommodate variable renewable sources. A smart grid could help manage this transition by better integrating all available energy resources, reducing losses, enabling demand response, and addressing problems with intermittent renewables. The document outlines India's progress so far in deploying smart grid technologies and renewable energy.


