Download as PDF, PPTX

![20
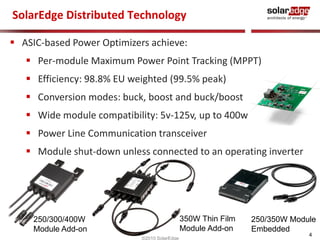
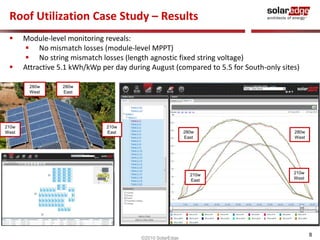
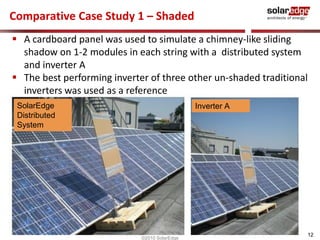
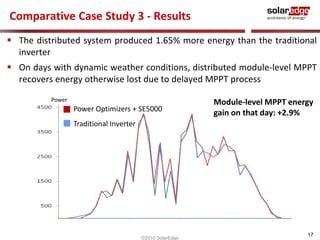
Comparative Case Study 4 – Results
Introduction
The distributed system produced 4% - 8% more energy than the
traditional inverter on most days of the month
Distributed system production was lower on days with very low
irradiance, due to sizable self consumption of the prototype DSP
version of the unit, now replaced by an efficient ASIC
SolarEdge Daily Energy gain
vs. traditional inverter [%]
©2010 SolarEdge](https://image.slidesharecdn.com/how-much-energy-lost-from-partial-shading-141119212359-conversion-gate01/85/Optimizing-Commercial-Solar-PV-Systems-How-much-energy-lost-from-Partial-Shading-20-320.jpg)
![Traditional [kWh]
SolarEdge [kWh]
Weekly Energy
Gain [%]
22
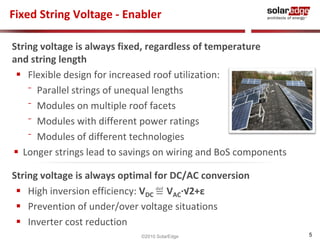
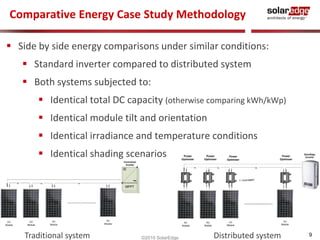
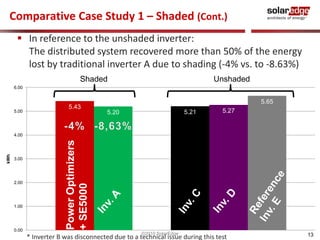
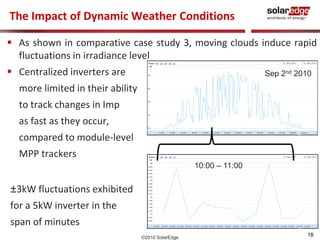
Comparative Case Study 5 – Results
Accumulated Energy comparisons shows the distributed system
consistently produces 4% more energy than the traditional inverter
Energy Gain in [%]
©2010 SolarEdge](https://image.slidesharecdn.com/how-much-energy-lost-from-partial-shading-141119212359-conversion-gate01/85/Optimizing-Commercial-Solar-PV-Systems-How-much-energy-lost-from-Partial-Shading-22-320.jpg)

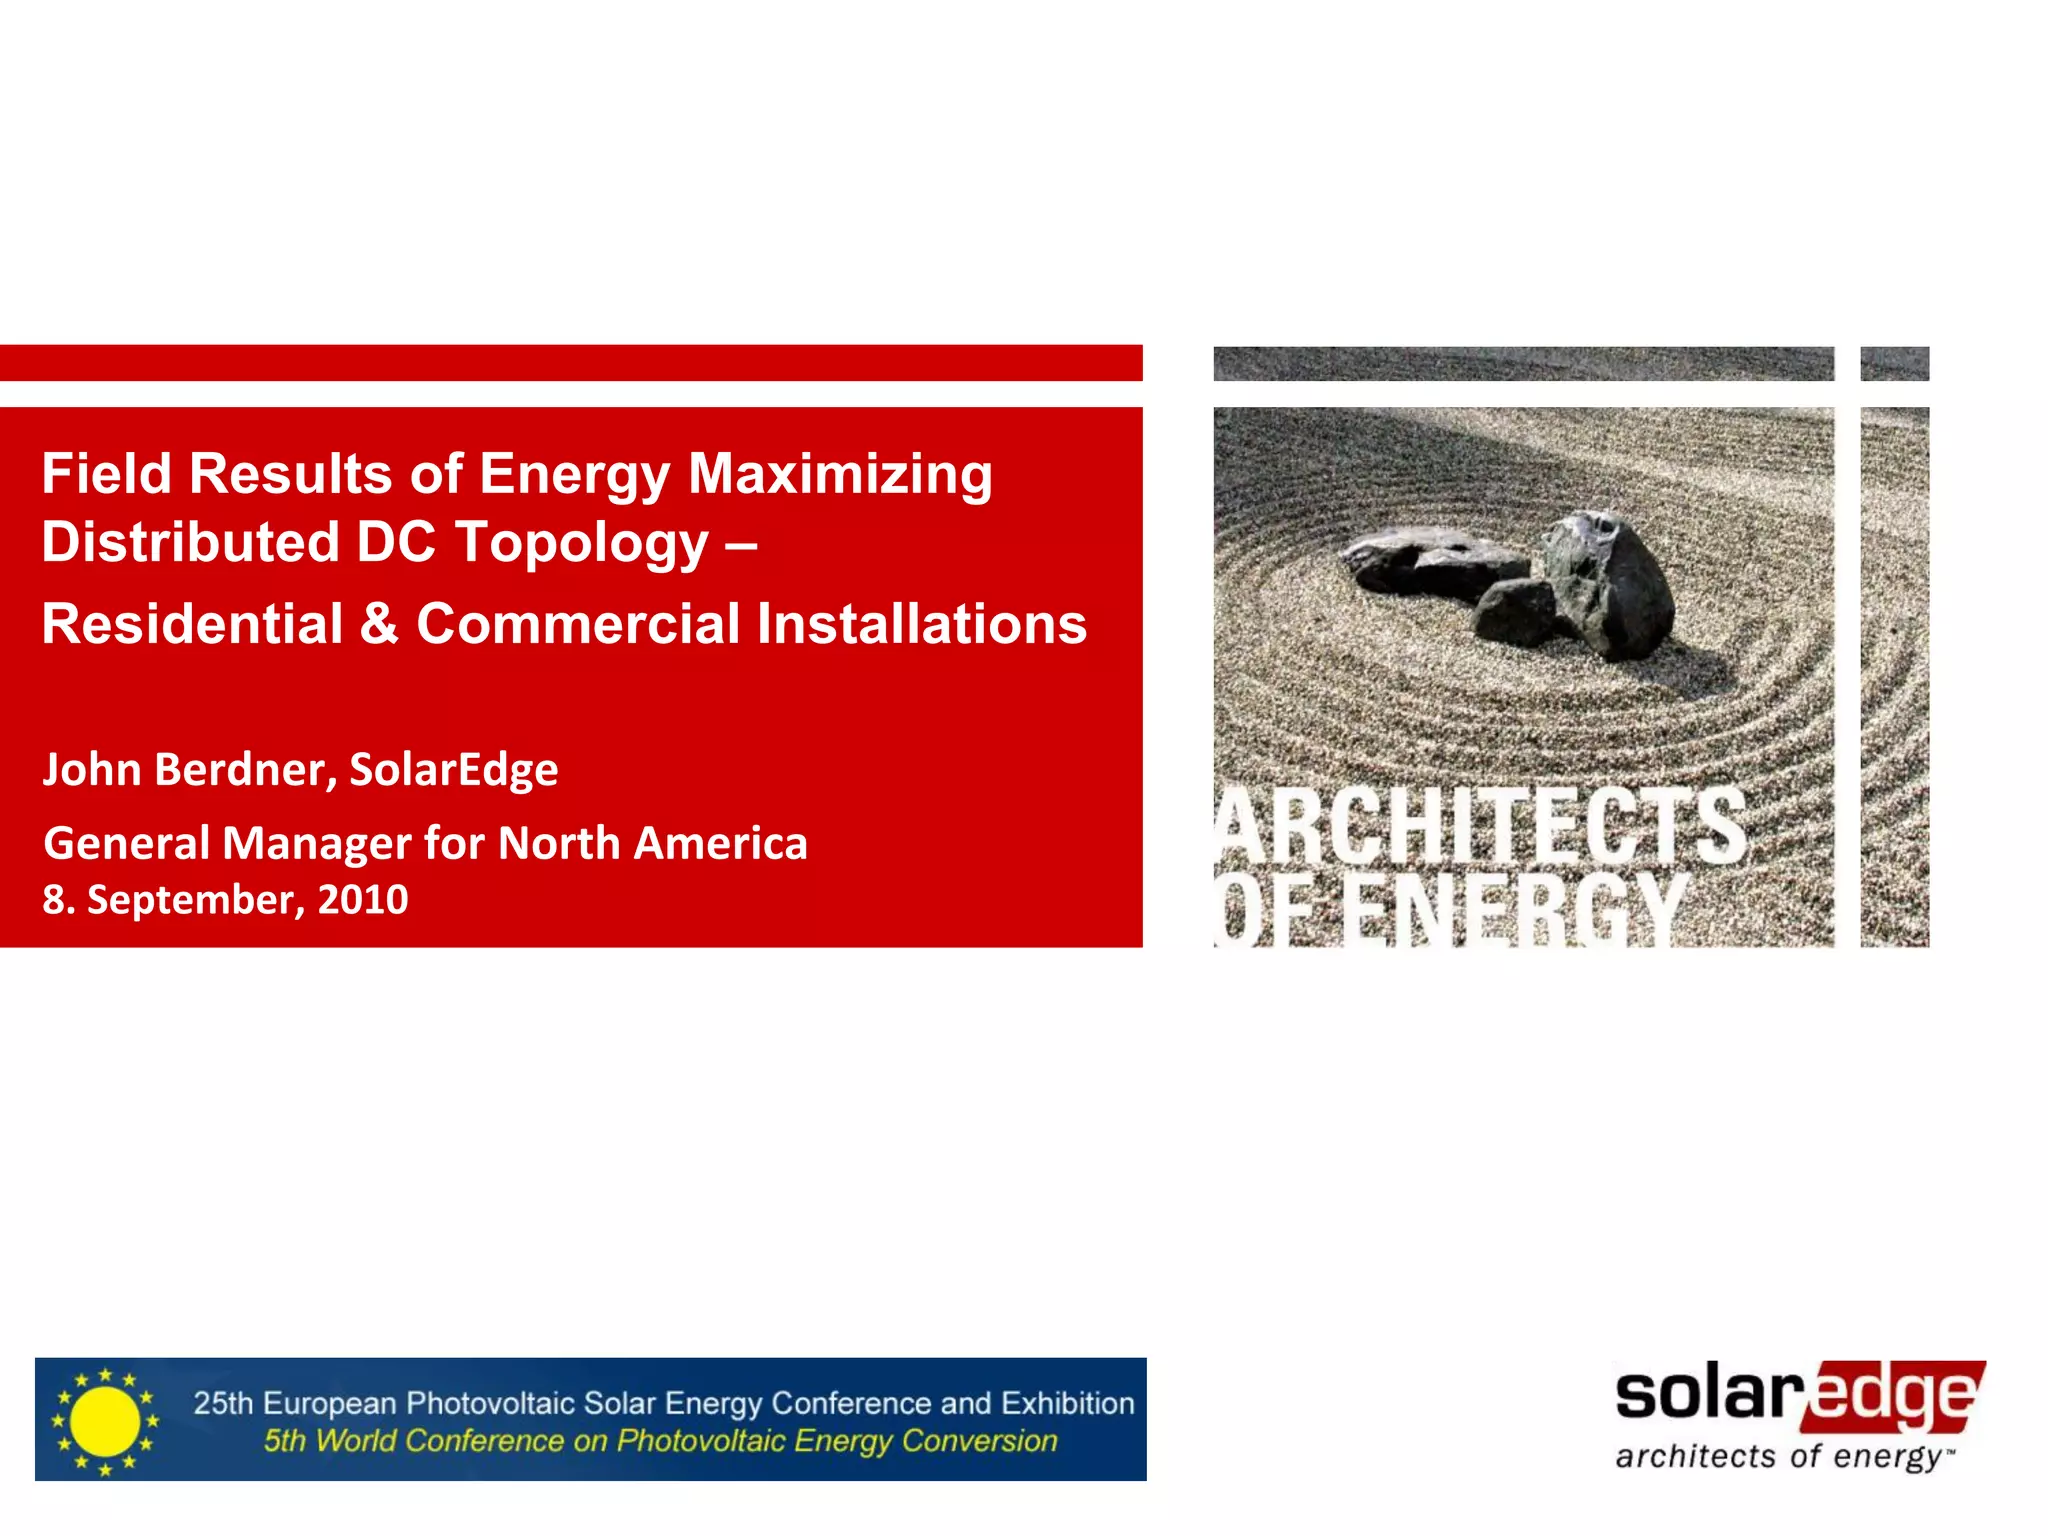
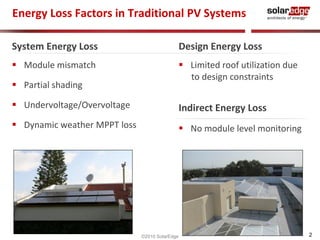
The document discusses the advantages of SolarEdge's distributed DC topology using power optimizers, highlighting reduced energy loss due to features like per-module maximum power point tracking (MPPT) and module-level monitoring. Case studies from various regions demonstrate that distributed systems outperform traditional inverters, especially in shaded conditions, providing higher energy production. Overall, the technology enables better roof utilization and greater energy efficiency across residential and commercial installations.