Download as PDF, PPTX
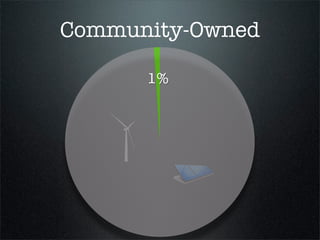
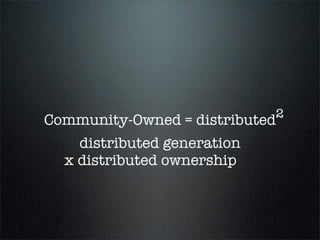
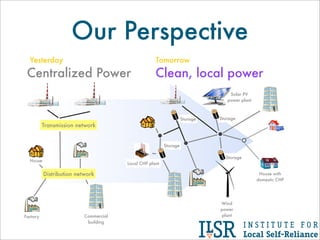
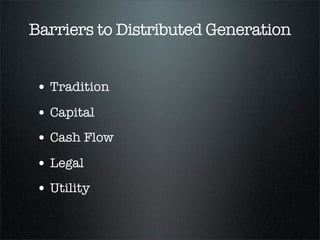
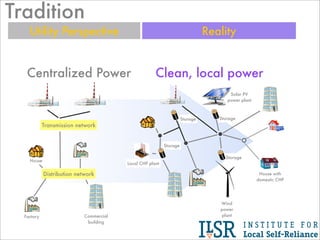
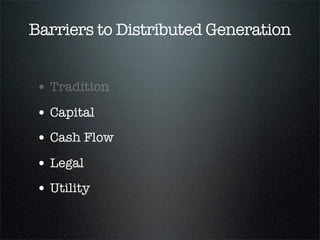
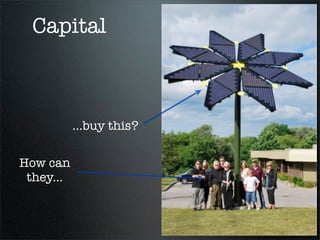
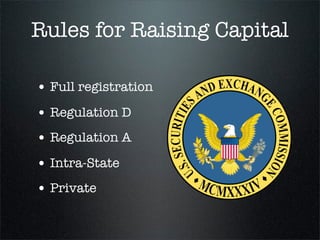
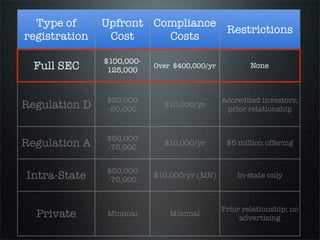
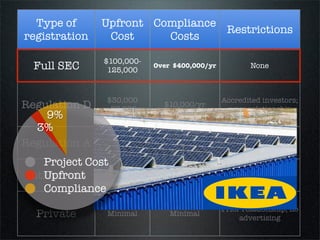
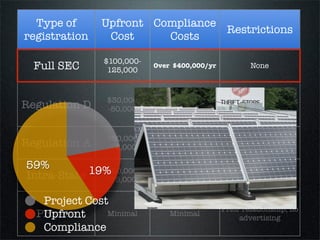
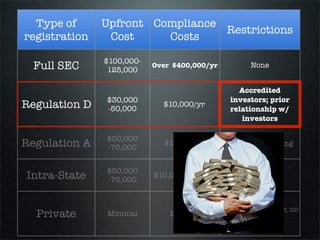
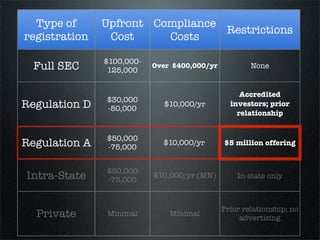
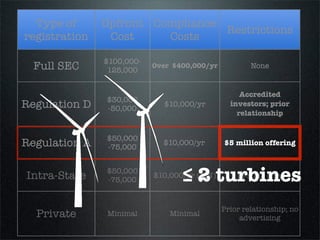
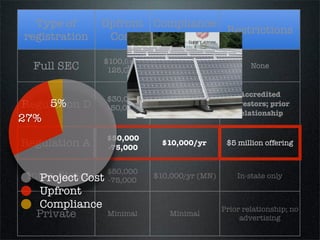
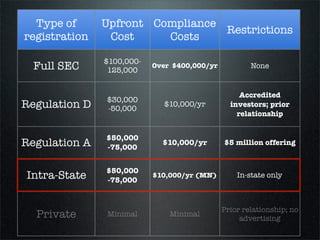
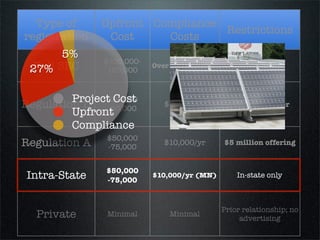
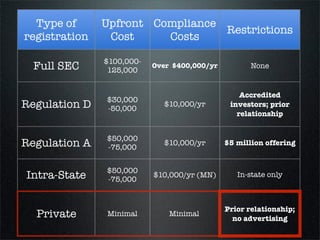
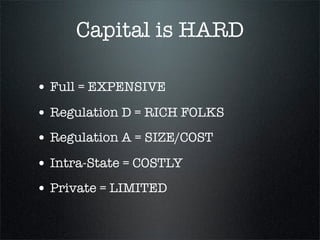
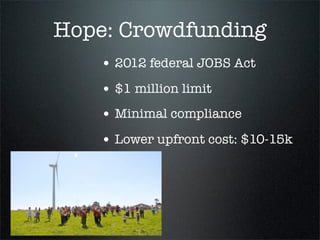
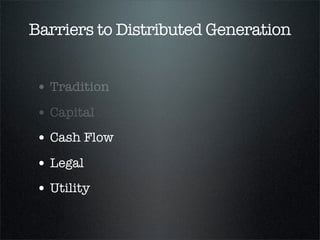
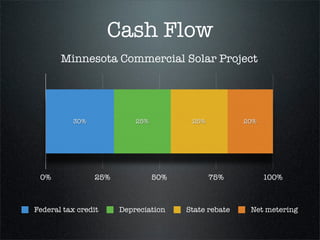

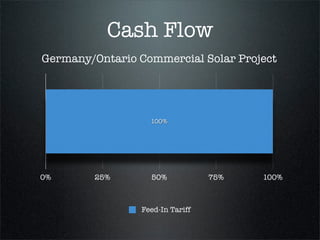
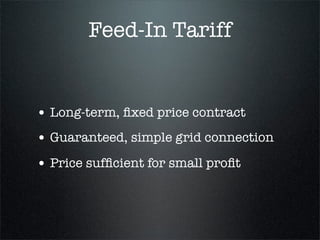
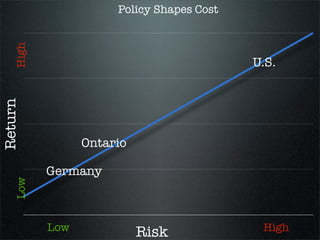
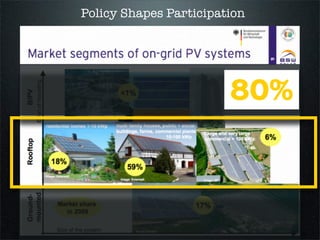
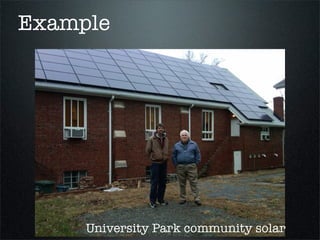

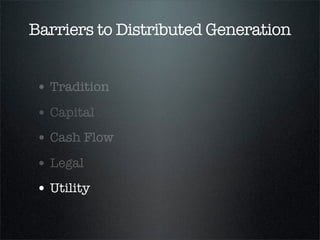

The document discusses barriers to the growth of community-owned distributed renewable energy, highlighting issues such as tradition, capital, cash flow, legal restrictions, and utility perspectives. It emphasizes the complexity and costs associated with raising capital for small projects and compares the financial viability of solar projects in the U.S. versus other countries like Germany and Ontario. Additionally, it explores potential solutions, including crowdfunding and regulatory changes to improve access and participation in community solar initiatives.


![Getting Started with Apache Spark: Big Data Made Simple [Free Meetup]](https://cdn.slidesharecdn.com/ss_thumbnails/apachesparkgettingstarted-260203175547-8361bcc3-thumbnail.jpg?width=640&height=640&fit=bounds)

