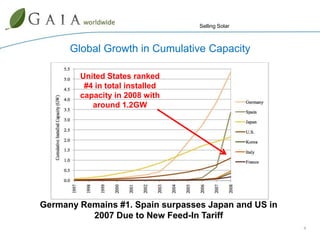
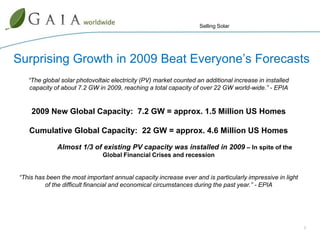
Selling SolarHow to enter, compete and win in the solar business…
About Joe BoycePresident of Gaia Worldwide and Solar Visionaries (Cambridge MA)Lifetime Sales Person – Pragmatic, non-academicKnowledge of Solar, Finance, Tech, Marketing, Recruiting, Org Dev.Some experience in residential construction and remodeling – 1 roofStarted in Solar in 2005 at Prometheus InstituteLaunched Greentech Media with co-founders in 2007Here to help you get started on the right foot – reach goals
GROWTH
Global Market Has Turned the Corner… Proven as a “Bankable” technology
 Viable alternative to fossil fuels for power generation
 Considered highly scalable, no longer fringe
 Energy policy and energy security being taken more seriously
 Government support is very high mainly due to climate change
 Supply / Demand balance has been a problem. Maybe no more
 Recent price declines putting solar on par with fossil fuelsUnique economic benefits Creates good jobs at blue collar, white collar, professional level
 Stimulates economies locally– easy to target hard-hit areas
 Rapid growth during global recession - positive outlier
 Billions in Venture Capital raised each year - #1 cleantech sector
 Stable hedge against energy prices
 Grid parity will create explosive demand and economic growth
 “Distributed Generation” deployable anywhere there’s sunlightGlobal Growth in Cumulative CapacityUnited States ranked #4 in total installed capacity in 2008 with around 1.2GWSource: NRELGermany Remains #1. Spain surpasses Japan and US in 2007 Due to New Feed-In Tariff
 Surprising Growth in 2009 Beat Everyone’s Forecasts“The global solar photovoltaic electricity (PV) market counted an additional increase in installed capacity of about 7.2 GW in 2009, reaching a total capacity of over 22 GW world-wide.” - EPIA2009 New Global Capacity:  7.2 GW = approx. 1.5 Million US HomesCumulative Global Capacity:  22 GW = approx. 4.6 Million US HomesAlmost 1/3 of existing PV capacity was installed in 2009 – In spite of the Global Financial Crises and recession“This has been the most important annual capacity increase ever and is particularly impressive in light of the difficult financial and economical circumstances during the past year.” - EPIA
Primary Drivers of U.S. Solar Industry Growth Strong policies at the state and federal level (solar investment tax credit, removal of $2,000 residential cap, Treasury Grant Program)
 Declining prices (PV module prices down more than 40 percent)
Strong interest (92 percent of Americans think it is important for the U.S. to develop and install solarBusiness, Government, and Consumers Aligned In Their SupportU.S. is depending on solar to create jobs and economic growthAbundant and safe source of domestic energyEnergy Security has become a major problemGood for our environment and quality of lifePlays to Our Strength - Maintains Global CompetitivenessProvides political capital, voters from all backgrounds favor solar
“Widespread Adoption”Government Stepping UpFY10 $225MRecovery act $117.6MFY2009 – $175MThe administration and Congress have demonstrated interest and support in solar over the past several years
USA Solar Market By Connectivity 1997 - 2008
USA Solar Market By Connectivity 2009+429 MW+40 MW2009
Looking Forward
U.S. Solar Industry Year in ReviewDespite the Great Recession of 2009, the U.S. solar industry had its best year ever
  2009 U.S. solar industry revenue grew 36% to almost $4 Billion
  The solar industry supported 17,000 new U.S. jobs in 2009
  U.S. Solar manufacturing grew 7% in 2009 despite recessions
  In 2009 Solar Electricity surpassed 2.200 MW in total capacity
  2009 Annual solar electric installations grew by 37% from 2008
 Solar Hot Water installations rose over 10% from 2008
  Solar Thermal Grew to nearly 24,000 MW
  Only decline was in solar pool heating, down 10% due to housing crisisSource: American Solar Energy Society
What About Our Biggest Competitor?
Coal!
Positive: Coal remains the United States’ #1 source of energy with over 50% market share
Positive: Coal remains the United States’ #1 source of energy with over 50% market shareNegative: Tragic mine collapse kills 25 injures dozens more. Massey Energy being investigated for safety violations.
Positive: Coal remains the United States’ #1 source of energy with over 50% market shareNegative: Tragic mine collapse kills 25 injures dozens more. Massey Energy being investigated for safety violations. Average Coal Miner Wage: (10 years experience – Kansas City MO)$23.83 per hour
Positive: Coal remains the United States’ #1 source of energy with over 50% market shareNegative: Tragic mine collapse kills 25 injures dozens more. Massey Energy being investigated for safety violations. Average Coal Miner Wage: (10 years experience – Kansas City MO)        $23.83 per hour  Average life expectancy:59 years
Are These Really The Jobs Of The Future?Can We Really Build A New, More Competitive America This Way?
ECONOMICS
Solar Economics 101U.S. Electricity prices increase 4% a year on averagePV Prices have declined an average of 5-7% a year for the last 20 yearsLast year ASP of solar modules declined between 30 and 40%Polysilicon, the main raw material used in well over 80% of all solar panels manufactured globally is derived from the most abundant material on earth – sandPV O&M costs are the lowest of any major energy sourceAs demand grows for PV manufacturing and logistics costs are reducedThere are tens of billions of dollars invested in R&D aimed directly at reducing cost the U.S. aloneAll of the solar deployed in the U.S. to date produces less than 0.5% of our annual energy demand
GRID PARITYThe point at which renewable electricity is equal to or cheaper than grid power.
2009NREL study of 1000 largest utilities across the US servicing over 95% of grid electricity consumption.Major population centers are already at or near grid-parity
20151% annual increase in grid electricity prices2/3 of the U.S. is at or below grid costs95% of the U.S. is within 5 cents a kwh
Recent Developments For Downstream PlayersMargins have shifted in your direction
Service levels are improving with higher availability of product
Rapid price declines have not been met with reduced incentives
Banking crisis led to a host of new, innovative financing vehicles
Environmental, Geopolitical, and other factors creating higher consumer awareness, stimulating demand in residential and small business markets
Vertical Integration is the trend - Manufacturers acquiring downstream partners to stabilize salesBut We Still Face Major ChallengesConsumer perception			“Solar is still too expensive” 			“Only works if you get a lot of sunlight”			“Payback Period is over 20 years” 			“Solar will get much cheaper, so it’s better to wait”		Incentives Are Inconsistent and Constantly ChangingStaying current can be a challenge 			Many markets still lack incentives			Budgets can be spent quickly – no more cash availableGrowing CompetitionHighly fragmented market could create price wars			Your biggest competitor is the grid, and prices vary widely		Price Instability		Many believe they have stabilized and are starting 					to increase slightly already

Selling Solar Abridged Boyce

  • 1.
    Selling SolarHow toenter, compete and win in the solar business…
  • 2.
    About Joe BoycePresidentof Gaia Worldwide and Solar Visionaries (Cambridge MA)Lifetime Sales Person – Pragmatic, non-academicKnowledge of Solar, Finance, Tech, Marketing, Recruiting, Org Dev.Some experience in residential construction and remodeling – 1 roofStarted in Solar in 2005 at Prometheus InstituteLaunched Greentech Media with co-founders in 2007Here to help you get started on the right foot – reach goals
  • 3.
  • 4.
    Global Market HasTurned the Corner… Proven as a “Bankable” technology
  • 5.
    Viable alternativeto fossil fuels for power generation
  • 6.
    Considered highlyscalable, no longer fringe
  • 7.
    Energy policyand energy security being taken more seriously
  • 8.
    Government supportis very high mainly due to climate change
  • 9.
    Supply /Demand balance has been a problem. Maybe no more
  • 10.
    Recent pricedeclines putting solar on par with fossil fuelsUnique economic benefits Creates good jobs at blue collar, white collar, professional level
  • 11.
    Stimulates economieslocally– easy to target hard-hit areas
  • 12.
    Rapid growthduring global recession - positive outlier
  • 13.
    Billions inVenture Capital raised each year - #1 cleantech sector
  • 14.
    Stable hedgeagainst energy prices
  • 15.
    Grid paritywill create explosive demand and economic growth
  • 16.
    “Distributed Generation”deployable anywhere there’s sunlightGlobal Growth in Cumulative CapacityUnited States ranked #4 in total installed capacity in 2008 with around 1.2GWSource: NRELGermany Remains #1. Spain surpasses Japan and US in 2007 Due to New Feed-In Tariff
  • 17.
    Surprising Growthin 2009 Beat Everyone’s Forecasts“The global solar photovoltaic electricity (PV) market counted an additional increase in installed capacity of about 7.2 GW in 2009, reaching a total capacity of over 22 GW world-wide.” - EPIA2009 New Global Capacity: 7.2 GW = approx. 1.5 Million US HomesCumulative Global Capacity: 22 GW = approx. 4.6 Million US HomesAlmost 1/3 of existing PV capacity was installed in 2009 – In spite of the Global Financial Crises and recession“This has been the most important annual capacity increase ever and is particularly impressive in light of the difficult financial and economical circumstances during the past year.” - EPIA
  • 18.
    Primary Drivers ofU.S. Solar Industry Growth Strong policies at the state and federal level (solar investment tax credit, removal of $2,000 residential cap, Treasury Grant Program)
  • 19.
    Declining prices(PV module prices down more than 40 percent)
  • 20.
    Strong interest (92percent of Americans think it is important for the U.S. to develop and install solarBusiness, Government, and Consumers Aligned In Their SupportU.S. is depending on solar to create jobs and economic growthAbundant and safe source of domestic energyEnergy Security has become a major problemGood for our environment and quality of lifePlays to Our Strength - Maintains Global CompetitivenessProvides political capital, voters from all backgrounds favor solar
  • 21.
    “Widespread Adoption”Government SteppingUpFY10 $225MRecovery act $117.6MFY2009 – $175MThe administration and Congress have demonstrated interest and support in solar over the past several years
  • 22.
    USA Solar MarketBy Connectivity 1997 - 2008
  • 23.
    USA Solar MarketBy Connectivity 2009+429 MW+40 MW2009
  • 24.
  • 25.
    U.S. Solar IndustryYear in ReviewDespite the Great Recession of 2009, the U.S. solar industry had its best year ever
  • 26.
    2009U.S. solar industry revenue grew 36% to almost $4 Billion
  • 27.
    Thesolar industry supported 17,000 new U.S. jobs in 2009
  • 28.
    U.S.Solar manufacturing grew 7% in 2009 despite recessions
  • 29.
    In2009 Solar Electricity surpassed 2.200 MW in total capacity
  • 30.
    2009Annual solar electric installations grew by 37% from 2008
  • 31.
    Solar HotWater installations rose over 10% from 2008
  • 32.
    SolarThermal Grew to nearly 24,000 MW
  • 33.
    Onlydecline was in solar pool heating, down 10% due to housing crisisSource: American Solar Energy Society
  • 34.
    What About OurBiggest Competitor?
  • 35.
  • 36.
    Positive: Coal remainsthe United States’ #1 source of energy with over 50% market share
  • 37.
    Positive: Coal remainsthe United States’ #1 source of energy with over 50% market shareNegative: Tragic mine collapse kills 25 injures dozens more. Massey Energy being investigated for safety violations.
  • 38.
    Positive: Coal remainsthe United States’ #1 source of energy with over 50% market shareNegative: Tragic mine collapse kills 25 injures dozens more. Massey Energy being investigated for safety violations. Average Coal Miner Wage: (10 years experience – Kansas City MO)$23.83 per hour
  • 39.
    Positive: Coal remainsthe United States’ #1 source of energy with over 50% market shareNegative: Tragic mine collapse kills 25 injures dozens more. Massey Energy being investigated for safety violations. Average Coal Miner Wage: (10 years experience – Kansas City MO) $23.83 per hour Average life expectancy:59 years
  • 40.
    Are These ReallyThe Jobs Of The Future?Can We Really Build A New, More Competitive America This Way?
  • 41.
  • 42.
    Solar Economics 101U.S.Electricity prices increase 4% a year on averagePV Prices have declined an average of 5-7% a year for the last 20 yearsLast year ASP of solar modules declined between 30 and 40%Polysilicon, the main raw material used in well over 80% of all solar panels manufactured globally is derived from the most abundant material on earth – sandPV O&M costs are the lowest of any major energy sourceAs demand grows for PV manufacturing and logistics costs are reducedThere are tens of billions of dollars invested in R&D aimed directly at reducing cost the U.S. aloneAll of the solar deployed in the U.S. to date produces less than 0.5% of our annual energy demand
  • 43.
    GRID PARITYThe pointat which renewable electricity is equal to or cheaper than grid power.
  • 44.
    2009NREL study of1000 largest utilities across the US servicing over 95% of grid electricity consumption.Major population centers are already at or near grid-parity
  • 45.
    20151% annual increasein grid electricity prices2/3 of the U.S. is at or below grid costs95% of the U.S. is within 5 cents a kwh
  • 46.
    Recent Developments ForDownstream PlayersMargins have shifted in your direction
  • 47.
    Service levels areimproving with higher availability of product
  • 48.
    Rapid price declineshave not been met with reduced incentives
  • 49.
    Banking crisis ledto a host of new, innovative financing vehicles
  • 50.
    Environmental, Geopolitical, andother factors creating higher consumer awareness, stimulating demand in residential and small business markets
  • 51.
    Vertical Integration isthe trend - Manufacturers acquiring downstream partners to stabilize salesBut We Still Face Major ChallengesConsumer perception “Solar is still too expensive” “Only works if you get a lot of sunlight” “Payback Period is over 20 years” “Solar will get much cheaper, so it’s better to wait” Incentives Are Inconsistent and Constantly ChangingStaying current can be a challenge Many markets still lack incentives Budgets can be spent quickly – no more cash availableGrowing CompetitionHighly fragmented market could create price wars Your biggest competitor is the grid, and prices vary widely Price Instability Many believe they have stabilized and are starting to increase slightly already

Editor's Notes

  • #2 Let me start with a question, just to get to know who’s in the room…. How many here have already installed at least one solar system for a customer?How many of you have over 10 employees, over 20, over 30? Would someone want to volunteer why they decided to get into the solar business?
  • #3 Just a little bit of my background. . . Key things to know are that I won’t be presenting from the same tack as many othersI am a lifetime sales person, so I am very focused on growth and revenue
  • #4 One thing you’ll hear a lot in this presentation is GROWTH. I’m going to spend some time illustrating and explaining the growth industry, then move into the ways that you can best participate in it and manage it profitably.
  • #5 How the market is setting up… Over the past couple of years we’ve seen some important things happen on a global level…
  • #6 Let’s walk through some of these, some you’re aware of, but others maybe not. It’s important because these benefits are the basis for why we have government incentives around the world that are sustaining these incredible growth rates. .. .
  • #7 Now, this slide is a little more fun to look at. Here’s how we got to that 13.9 Gigs Look at the growth curves. Country by country we’ve gone to hockey-stick growth.Japan was the first country to start providing incentives for PV, and it created a steady climb in growth in the earliest years of the technology. In recent years, they’ve actually begun to roll-back the incentives they had in place and continue to see a steady growth curve. How about Germany, when do you think they put their Federal Feed-In Tariff in place? - right, 2003. How about Spain?Now look at the U.S. Line. As you may all know, we have no national standard for PV production, we do however have some attractive incentives which we’ll discuss later.
  • #8 . . . So what’s driving this growth?
  • #9 Here are the things that are making the U.S. start to get serious about solar
  • #10 What’s most important is that renewable energy in general, and solar more specifically have strong support from all power centers. Heads of global corporations, Government at all levels, small businesses such as many of yours, and entrepreneurs universally support and work to help grow the solar business. Moreover, business and government have aligned in many ways with environmental groups and consumers, who also support solar.
  • #11 What’s most important is that renewable energy in general, and solar more specifically have strong support from all power centers. Heads of global corporations, Government at all levels, small businesses such as many of yours, and entrepreneurs universally support and work to help grow the solar business. Moreover, business and government have aligned in many ways with environmental groups and consumers, who also support solar.
  • #12 So, with the support we get from the end users, business, and government, here’s what we’ve been able to accomplish. We have grown over 12x from 2000 to 2008. I’d put the same chart up here for our economy in general, but it’s too depressing. But what about last year when we had all of the bank failures and other issues around the globe… It was our first year installing over 1GW of capacity. Major milestone.But what about 2009, when the financial crisis hit. . .
  • #13 Well, pretty good news there too. We added a total of almost 470MW more than we did even in 2008 when the financial markets were completely different. This is probably the best indicator of things to come. We got hit the hardest by the recession and banking crisis. Yet in spite of having an economy on life-support from the Federal Government we were able to grow by over 1/3 in solar. This year, we’re looking to double from 2009. - And we still don’t even have a Federal production incentive!
  • #14 As you can see, the policies initiated in 2009 brought about a rise in solar installations at both the residential level as well as Utility-Scale. Many believe that within the next few years we will see an equal distribution of market share for each of the Utility Scale, Commercial, and Residential markets.
  • #15 So, long story short we’re doing very well and the train doesn’t seem to be slowing down anytime soon. . . But….
  • #18 Here are the recent developments in coal. Well the good news is right here…
  • #19 Well, here’s some other recent news…
  • #20 Not bad! But here’s another stat that kind of tempered the excitement…
  • #21 That’s a full 14 years lower than the national average. So we have to ask ourselves something.
  • #22 Maybe we should start to diversify our energy infrastructure a little more.
  • #23 Economics. PV technology has very unique properties that make it more attractive with every passing year.. . .
  • #25 Economics are about the move to this…
  • #26 Here’s what the cost of solar looks like across the country vs. standard utility rates. As you can see, we’re already at par with the grid in some major markets. Mostly those with high utility rates and good sun. Red – at or below parOrange – within 5% of the grid priceYellow – between 5-10% of the grid priceWhite – not even close.
  • #27 Now, it’s important to point out that this map only assumes a 1% annual increase in utility rates, but we already know that the national average is somewhere around 5% with some high-use metro areas increasing at double-digits every year. With this much of the market at or below grid-parity, there will be No More Need for government incentives. At least not on the Federal Level. That’s only five years away.
  • #28 But it’s not just the pricing situation that makes a difference to you. When supply is abundant, the buyers get control in a number of ways.
  • #29 Still, we have to be smart to succeed for the long-term and maximize our profits. With new capacity available and financing on the mend, end Users are the biggest issue. We also need to watch for changes, expiration, or tapped out incentives. Competition will get better, still fragmented and unpredictable, and prices can fluctuate so we need to be prepared.
  • #30 30% credit for any new installation at the residential or commercial level. Now, it’s important to delineate this vs a production incentive. This is an investment incentive meaning that it stimulates the construction of new projects, but does not offer an incentive for the amount of production. So, if you spend $35k on a 5kw system, you’ll get 30% back, but if the system only produces 2/3 of what it’s meant to, it’s not a factor. This could potentially affect quality and design.
  • #32 This is the best resource for following all of the reams of information you’ll need. Bookmark it and refer to it regularly.
  • #33 DSIRE will give you all the updated incentive information you need. It’s a very robust resource, and for single-source research it’s the one to go with. . . Here’s an example of one of the maps on their site. You just pick your state and it will take you to everything you need to know and in most cases quite a bit more.
  • #34 One thing we can say is that if state and local incentives drive installations, these would be the top ten states based on recent capacity expansion and total MW installed.
  • #36 This is the new hot topic in solar. It’s a way of financing solar so that residents make a positive cash-flow from day one of the install.
  • #37 PPA’s are different, they allow the owner of the building to buy electricity from a PPA provider at a fixed price. These are great for non-profits and government facilities where they’re not qualified for any tax incentives. By buying the power from a 3rd party for-profit company, they allow that company to use the incentives giving them the ability to offer a better price for the power.
  • #38 And then there’s one of my favorites. LeasingNo money down… gets ‘em every time. Like a PPA, the company actualy owns the equipment, but rather than selling power, they essentially “rent” it to the owner for a fixed price. Usually the offset from the electricity bill is more than the lease payment. So even with $0 down the owner can have a positive cash-flow from day one. You want to know how SolarCity got so big so fast, this is how.
  • #41 This is where a lot of companies lose their edge, they concern themselves with things like material costs and labor rather than the overhead and other costs that really waste time and money. By focusing on the best customers and dominating in a specific niche, you can take a major chunk out of that 20-29% in overhead and permitting. That’s money straight to the bottom line. Once you learn the process you’ll get better and better rather than having to re-learn each time you need to pull a permit. and money.
  • #44 This is a cool site called Meetup.com. It’s for people who actually like to communicate face-to-face. I pulled groups interested in “solar” in the state of Arizona, and here’s what I found… Affinity, yes! Low tech, absolutely! Listen, you don’t have to become a high-tech company… All it takes is the ability to know what tools are available and to know how to use them. = You should spend less than 20 minutes a day online looking at this stuff. = If you think it’s expensive, you’re in for a pleasant surprise… websites are cheap, and the major components of a brand are extremely cheap. They’re so valuable I would really recommend that all of you find a resource.
  • #45 Do your research, sales isn’t dependent on charm anymore, tools are available.Get the basics and fill in the form in advance, they will appreciate it – it’s a “give”Diff between market knowledge and product knowledgeListening to the questions they ask more imp than giving them all possible info.Group settings make you valid, use tools to create an affinity group – do NOT abuse access if granted. “Friend” and do not do anything else – use media. Offer group education, a webinar, or something of value without a pitch!
  • #46 Market Knowledge – Much more important that product or service knowledge
  • #50 The process of self-qualifying is fun! Customers love it and pass on to others. Media gets a kick out of it and features them all the time.