Download to read offline


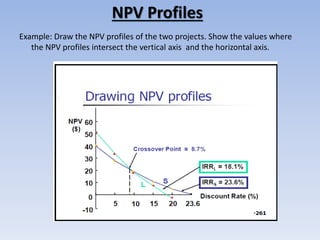


This document discusses net present value (NPV) profiles and how they can be used to analyze projects. It explains that an NPV profile is a graphical representation of a project's NPV over a range of discount rates. It can help resolve conflicting rankings of projects that occur when the discount rate changes. The document also discusses how the internal rate of return (IRR) is the discount rate that makes a project's NPV equal to zero, and how IRR and NPV can sometimes produce different accept/reject decisions for projects due to their different assumptions about reinvestment rates.