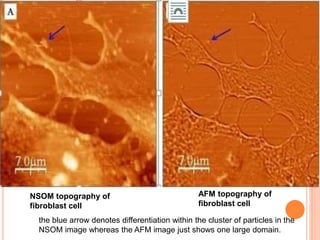
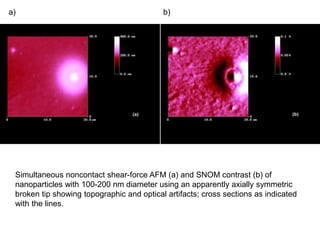
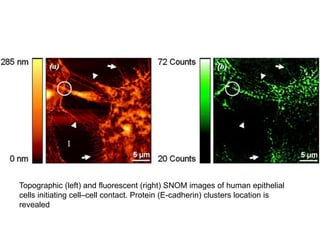
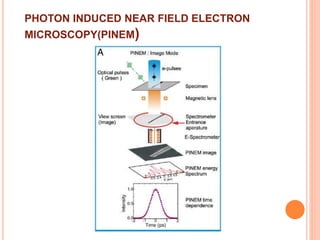
NEAR FIELD SCANNING OPTICAL
MICROSCOPY(NSOM)
Dhanya M S
Indian Institute of Space Science & Technology
PHOTON INDUCED NEAR FIELD
ELECTRON MICROSCOPY(PINEM)
&
WHAT IS NSOM?
 NSOM/SNOM is a form of scanning probe
microscopy.
 NSOM offers higher resolution around 50 nm .
 Breaks the far field resolution limit by exploiting the
properties of evanescent waves.
 These fields carry the high frequency spatial
information about the object and have intensities
that drop off exponentially with distance from the
object. Because of this, the detector must be placed
very close to the sample in the near field zone,
typically a few nanometers.
 As a result, near field microscopy remains primarily
a surface inspection technique
WHAT IS NEAR-FIELD?
For high spatial resolution, the probe
must be close to the sample
λ/2 ~ 250 nm
~50nm
d=0.61*λ/NA
WHY HIGH RESOLUTION IN NSOM?
• Resolution is controlled by the diffraction of light.
• When a point object is magnified, its image is a
central spot (Airy disk ) surrounded by a series of
diffraction rings, not a single spot.
• To distinguish between the point objects, the Airy
disks should not overlap each other.
THE BASIC PRINCIPLE OF SNOM
• Light passes through a sub-wavelength diameter
aperture and illuminates a sample that is placed
within its near field, at a distance much less than the
wavelength of the light.
• Light is localized in a spot of nanometer dimension
with a diameter smaller than the wavelength of light.
• In NSOM, the image is a central spot only, no other
diffraction rings. Hence appear as a single spot and
has high resolution.
BASIC COMPONENTS OF NSOM
The primary components of an NSOM setup are the
Light source
Scanning tip
Detector
Feedback mechanism
• The light source is usually a laser focused into an
optical fiber through a polarizer, a beam splitter and a
coupler.
• The scanning tip is usually a pulled or stretched optical
fiber coated with metal except at the tip or just a
standard AFM cantilever with a hole in the center of the
pyramidal tip
• Standard optical detectors, such as avalanche
photodiode, photomultiplier tube (PMT) or CCD, can
be used
The distance between the point light source and the sample surface is usually
controlled through a feedback mechanism. Currently, most instruments use one
of the following two types of feedback:
 Constant force feedback: This mode is very similar to the feedback
mechanism used in atomic force microscopy . Experiments can be performed
in contact, intermittent contact, and non-contact modes.
 Shear force feedback: In this mode, a tuning fork is mounted alongside the
tip and made to oscillate at its resonance frequency. The amplitude is closely
related to the tip-surface distance, and thus used as a feedback mechanism.
FEED BACK MECHANISM
Modes of Operation
 Aperture Mode
 It is very popular and could provide very highly
resolution images.
 Aperture modes include five operational mode:
• Illumination
• Collection
• Illumination-collection
• Reflection
• Reflection collection
the schematic illustration of (a) aperture SNOM and (b) aperture
less (scattering) SNOM
 Aperture Operational modes
Illumination collection Illumination/c
ollection
reflection Reflection/
collection
 Aperture less mode
 The aperture less mode is another mode which needs more
complicated instrument.
 The tips are very sharp non-metal tips.
 The sample is illuminated by external illumination. The light that
is scattered by oscillating tip and sample.
THE FINAL IMAGE PRODUCED BY SNOM CAN BE USED TO
ANALYZE:
 Changes in the index of refraction
 Changes in the reflectivity
 Changes in the transparency
 Changes in polarization
 Stress at certain points of the sample that changes its optical properties
 Magnetic properties, which can change the optical properties
 Fluorescent molecules
 Molecules excited through a Raman shift or other effects
 Changes in the material
ADVANTAGES OF SNOM
 High resolution (up to 25 nm).
 Analysis of various properties made possible
through contrast.
 No special sample preparation needed. Can
be used for different kind of samples
(conductive, non-conductive & transparent).
LIMITATIONS OF SNOM
 Very low working distance and extremely
shallow depth of field.
 Not conducive for studying soft materials,
especially under shear force mode.
 Long scan times for large sample areas for
high resolution imaging.
APPLICATIONS OF SNOM
 Ideally suited to quickly and effortlessly image the
optical properties of a sample with resolution below
the diffraction limit.
 In Nanotechnology research.
 In Nano-Photonics and Nano-Optics.
 Life Science and materials research - optical
detection of the most miniscule surface
 Single molecule detection is easily achievable.
 Dynamic properties can also be studied at a sub-
wavelength scale.
NSOM topography of
fibroblast cell
AFM topography of
fibroblast cell
the blue arrow denotes differentiation within the cluster of particles in the
NSOM image whereas the AFM image just shows one large domain.
Simultaneous noncontact shear-force AFM (a) and SNOM contrast (b) of
nanoparticles with 100-200 nm diameter using an apparently axially symmetric
broken tip showing topographic and optical artifacts; cross sections as indicated
with the lines.
a) b)
Topographic (left) and fluorescent (right) SNOM images of human epithelial
cells initiating cell–cell contact. Protein (E-cadherin) clusters location is
revealed
PHOTON INDUCED NEAR FIELD ELECTRON
MICROSCOPY(PINEM)
PHOTON INDUCED NEAR FIELD
ELECTRON MICROSCOPY(PINEM)
• Used for capturing dynamic images of nanometre sized
structures.
• electrons can directly interact with photons via the near
field component of light scattering by nanostructures,
and either gain or lose light quanta discretely in energy.
• By energetically selecting those electrons that
exchanged photon energies, we can map this photon-
electron interaction
 In PINEM, an ultra short optical pulse is used to excite evanescent
electromagnetic fields near a nanostructure or at an interface.
 The electrons can absorb/emit one or more scattered photons and
then be detected by their contributions to displaced energy peaks in
the electron energy spectrum
 When using energy filtering to select for imaging only those
electrons gaining energy, the resulting PINEM image reflects the
strength and topology of the excited near field around the
nanostructure or interface.
 Photon-induced near-field EM (PINEM) imaging results in the
mapping of nanostructure plasmonics with high spatial–temporal
resolution.
The PINEM technique has been used to detect
the evanescent near field surrounding a variety
of structures with different materials
properties and different geometries, such as
 Carbon nanotubes
 Silver nanowires
 Nanoparticles
 Cells and protein vesicles and
 Several-atoms-thick graphene-layers.
Near field scanning optical microscopy

Near field scanning optical microscopy

  • 1.
    NEAR FIELD SCANNINGOPTICAL MICROSCOPY(NSOM) Dhanya M S Indian Institute of Space Science & Technology PHOTON INDUCED NEAR FIELD ELECTRON MICROSCOPY(PINEM) &
  • 2.
    WHAT IS NSOM? NSOM/SNOM is a form of scanning probe microscopy.  NSOM offers higher resolution around 50 nm .  Breaks the far field resolution limit by exploiting the properties of evanescent waves.  These fields carry the high frequency spatial information about the object and have intensities that drop off exponentially with distance from the object. Because of this, the detector must be placed very close to the sample in the near field zone, typically a few nanometers.  As a result, near field microscopy remains primarily a surface inspection technique
  • 4.
    WHAT IS NEAR-FIELD? Forhigh spatial resolution, the probe must be close to the sample λ/2 ~ 250 nm ~50nm d=0.61*λ/NA
  • 5.
    WHY HIGH RESOLUTIONIN NSOM? • Resolution is controlled by the diffraction of light. • When a point object is magnified, its image is a central spot (Airy disk ) surrounded by a series of diffraction rings, not a single spot. • To distinguish between the point objects, the Airy disks should not overlap each other.
  • 6.
    THE BASIC PRINCIPLEOF SNOM • Light passes through a sub-wavelength diameter aperture and illuminates a sample that is placed within its near field, at a distance much less than the wavelength of the light. • Light is localized in a spot of nanometer dimension with a diameter smaller than the wavelength of light. • In NSOM, the image is a central spot only, no other diffraction rings. Hence appear as a single spot and has high resolution.
  • 7.
    BASIC COMPONENTS OFNSOM The primary components of an NSOM setup are the Light source Scanning tip Detector Feedback mechanism
  • 8.
    • The lightsource is usually a laser focused into an optical fiber through a polarizer, a beam splitter and a coupler. • The scanning tip is usually a pulled or stretched optical fiber coated with metal except at the tip or just a standard AFM cantilever with a hole in the center of the pyramidal tip • Standard optical detectors, such as avalanche photodiode, photomultiplier tube (PMT) or CCD, can be used
  • 9.
    The distance betweenthe point light source and the sample surface is usually controlled through a feedback mechanism. Currently, most instruments use one of the following two types of feedback:  Constant force feedback: This mode is very similar to the feedback mechanism used in atomic force microscopy . Experiments can be performed in contact, intermittent contact, and non-contact modes.  Shear force feedback: In this mode, a tuning fork is mounted alongside the tip and made to oscillate at its resonance frequency. The amplitude is closely related to the tip-surface distance, and thus used as a feedback mechanism. FEED BACK MECHANISM
  • 10.
    Modes of Operation Aperture Mode  It is very popular and could provide very highly resolution images.  Aperture modes include five operational mode: • Illumination • Collection • Illumination-collection • Reflection • Reflection collection
  • 11.
    the schematic illustrationof (a) aperture SNOM and (b) aperture less (scattering) SNOM
  • 12.
     Aperture Operationalmodes Illumination collection Illumination/c ollection reflection Reflection/ collection
  • 13.
     Aperture lessmode  The aperture less mode is another mode which needs more complicated instrument.  The tips are very sharp non-metal tips.  The sample is illuminated by external illumination. The light that is scattered by oscillating tip and sample.
  • 14.
    THE FINAL IMAGEPRODUCED BY SNOM CAN BE USED TO ANALYZE:  Changes in the index of refraction  Changes in the reflectivity  Changes in the transparency  Changes in polarization  Stress at certain points of the sample that changes its optical properties  Magnetic properties, which can change the optical properties  Fluorescent molecules  Molecules excited through a Raman shift or other effects  Changes in the material
  • 15.
    ADVANTAGES OF SNOM High resolution (up to 25 nm).  Analysis of various properties made possible through contrast.  No special sample preparation needed. Can be used for different kind of samples (conductive, non-conductive & transparent).
  • 16.
    LIMITATIONS OF SNOM Very low working distance and extremely shallow depth of field.  Not conducive for studying soft materials, especially under shear force mode.  Long scan times for large sample areas for high resolution imaging.
  • 17.
    APPLICATIONS OF SNOM Ideally suited to quickly and effortlessly image the optical properties of a sample with resolution below the diffraction limit.  In Nanotechnology research.  In Nano-Photonics and Nano-Optics.  Life Science and materials research - optical detection of the most miniscule surface  Single molecule detection is easily achievable.  Dynamic properties can also be studied at a sub- wavelength scale.
  • 18.
    NSOM topography of fibroblastcell AFM topography of fibroblast cell the blue arrow denotes differentiation within the cluster of particles in the NSOM image whereas the AFM image just shows one large domain.
  • 19.
    Simultaneous noncontact shear-forceAFM (a) and SNOM contrast (b) of nanoparticles with 100-200 nm diameter using an apparently axially symmetric broken tip showing topographic and optical artifacts; cross sections as indicated with the lines. a) b)
  • 20.
    Topographic (left) andfluorescent (right) SNOM images of human epithelial cells initiating cell–cell contact. Protein (E-cadherin) clusters location is revealed
  • 21.
    PHOTON INDUCED NEARFIELD ELECTRON MICROSCOPY(PINEM)
  • 22.
    PHOTON INDUCED NEARFIELD ELECTRON MICROSCOPY(PINEM) • Used for capturing dynamic images of nanometre sized structures. • electrons can directly interact with photons via the near field component of light scattering by nanostructures, and either gain or lose light quanta discretely in energy. • By energetically selecting those electrons that exchanged photon energies, we can map this photon- electron interaction
  • 23.
     In PINEM,an ultra short optical pulse is used to excite evanescent electromagnetic fields near a nanostructure or at an interface.  The electrons can absorb/emit one or more scattered photons and then be detected by their contributions to displaced energy peaks in the electron energy spectrum  When using energy filtering to select for imaging only those electrons gaining energy, the resulting PINEM image reflects the strength and topology of the excited near field around the nanostructure or interface.  Photon-induced near-field EM (PINEM) imaging results in the mapping of nanostructure plasmonics with high spatial–temporal resolution.
  • 24.
    The PINEM techniquehas been used to detect the evanescent near field surrounding a variety of structures with different materials properties and different geometries, such as  Carbon nanotubes  Silver nanowires  Nanoparticles  Cells and protein vesicles and  Several-atoms-thick graphene-layers.

Editor's Notes

  • #20 the blue arrow denotes differentiation within the cluster of particles in the NSOM image whereas the AFM image just shows one large domain.