Download as PDF, PPTX


![Steps in Data Wrangling
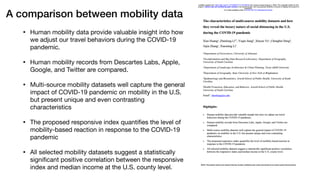
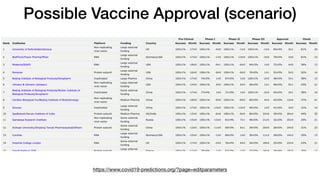
• The overall process of extracting the primary data (State, Date, and Mobility) involved utilizing SQL que- ries to filter out the
Descartes Labs data set in groupings for the individual states of California, Florida, New York, Pennsylvania, and Texas
• another partition was applied on the date in the form of a range in order to maintain consistent statewide data from March 10,
2020, to May 28, 2020. Once completed and initially filtered under the above two constraints, an API call was created from
www.data.world to be read and manipulated further via the Python programming language (Python 3.8.1). Likewise, a Python
script was created to preprocess the dataset by managing and organizing the filtered data into data frames
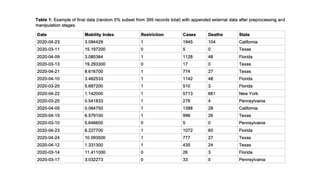
• Additionally, to construct a variable for the effect or contribution of government-imposed restrictions, a logical comparison was
implemented to make a binary coded variable that would take assigned values of 0 (No Restriction present) or 1 (Restriction
present) based upon the respected date values from the data found in the Tracking Involuntary Government Restrictions (TIGR)
Dataset.
• The Cases and Deaths data were compiled from JHU CSSE, Worldometer, and IHME and integrated into the same Python script,
adding on to the initial data frame.
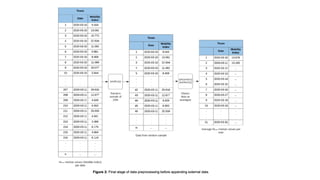
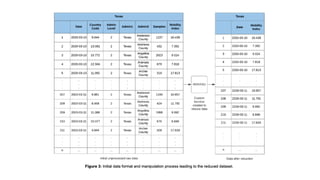
• Random sample from the source data: a random subset of the data was taken for each of the individual states (20%) via
Python’s random sample() function and flattened as averages to yield distinctive data records for each date in the range
• Finally, a conversion of the data's format (DataFrame to CSV) took place, which enabled the migration directly to RStudio (Version
3.6.3) for performing statistical modeling and analysis. A variety of packages were utilized in RStudio namely broom for
summarizing the model results, ggplot2 as a graphical visualization tool, readr to process the CSV data file, dpylr for data
manipulation, lindia [12] for creating regression diagnostic plots along with verifying linear model assumptions, and knitr [13] for
printing and exporting the results of our analyses.](https://image.slidesharecdn.com/multipleregressioncovidmobilitypdf-210923091042/85/Multipleregression-covidmobility-and-Covid-19-policy-recommendation-25-320.jpg)


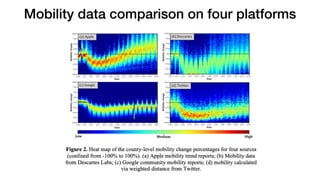
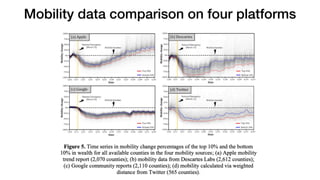
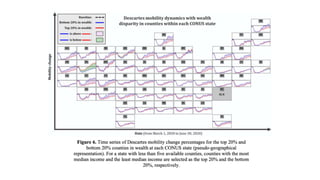
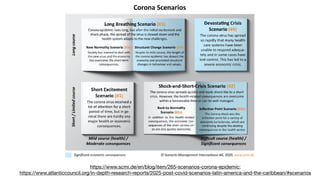
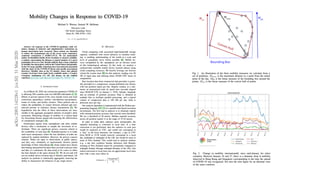
The document presents a multiple regression analysis of mobility data during the COVID-19 pandemic, comparing sources from Apple, Google, Twitter, and Descartes Labs. It emphasizes the importance of mobility tracking for informing evidence-based policy decisions and explores the correlation between lockdown measures and mobility trends. The analysis utilizes Python and R for data wrangling and statistical modeling, with findings supporting the significance of understanding human mobility patterns in the context of public health responses.


![[20240708_LabSeminar_Huy]Covid19Dynamics.pptx](https://cdn.slidesharecdn.com/ss_thumbnails/20240708labseminarhuycovid19dynamics-240708115840-60ccb205-thumbnail.jpg?width=640&height=640&fit=bounds)


