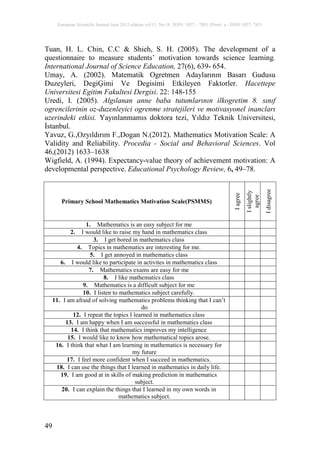
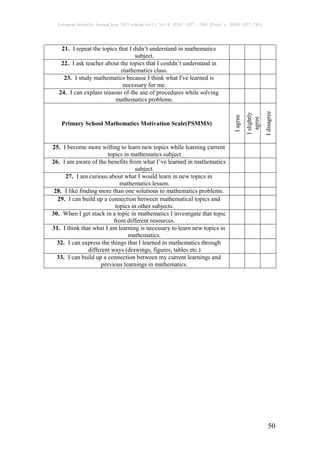
European Scientific Journal June 2015 edition vol.11, No.16 ISSN: 1857 – 7881 (Print) e - ISSN 1857- 7431
37
PRIMARY SCHOOL MATHEMATICS
MOTIVATION SCALE
Ezgi Ersoy,MS
Cumali Oksuz, PhD
Adnan Menderes University , Aydin, Turkey
Abstract
This study was aimed at developing a scale for determining
motivation of primary school students towards learning Mathematics. A
preliminary form of the scale included 74 Three-point scale items and data
was collected from a total of 482 participants who were 3rd and 4th grade
primary students. For construct validity, varimax orthagonal rotation
connects with exploratory factor analysis was used. In the result of factor
analysis, the scale involves in one factor explaining 42.46% of total
variance. Based on the result of item analysis, the scale consisted of 33
items of which 29 were positive and 4 were negative. The overall Cronbach-
alpha coefficient of the scale was high (α= 0.94) indicating that it was a
fairly consistent measure.The results of the study indicate that the scale
named as primary school mathematics motivation scale (PSMMS) has good
psychometric properties and is reliable and valid. It can be used reliably in
future educational researches
Keywords: Primary school mathematics, motivation, scale development
Introduction
Teaching mathematics should not be merely considered as enabling
students to acquire basic operational skills as well as problem solving skills.
Having considered the long term process of education, the importance of
each mathematics lesson offered should be kept in mind with regard to its
value to the students’ current educational lives, its contribution to their
further learning and to their endeavours to do mathematics with self-
confidence; perhaps even to pursue a profession in that journey. To this aim,
while designing the ideal classroom environment, the identification of how
close or far the practices are from that ideal will help to reach the aim. It is
significant to design an ideal classroom atmosphere considering the affective
and psychomotor acquisitions along with the cognitive ones. To
accommodate these features, knowing the level of each student's motivation
European Scientific Journal June 2015 edition vol.11, No.16 ISSN: 1857 – 7881 (Print) e - ISSN 1857- 7431
38
in mathematics is a significant tool to support students in reaching both close
and far goals. However, it is also important to treat motivation as a goal. In
this sense, it is identified that motivation has an impact on the type,
continuity and frequency of learning activities, and students’ motivational
and functional status during this process (Schiefele and Rheinberg, 1997).
Motivation expressed as an internal stimulus encouraging individuals
to take an action (Allen, 1999, p. 463) is also defined as a force activating
individuals, providing continuity and directing behaviours in terms of goals
(Pintrich & Schunk, 2002). Therefore, students’ motivation affects their
learning (Gardner, 1985; Brophy, 1988; Wigfield, 1994). Each individual is
different, and none of them has exactly similar cognitive, affective and
psychomotor features. From this point, motivation leading students’ learning
enables students to explore the importance of mathematics for their life and
for the world and to comprehend the benefits of mathematics. In addition to
this, besides mathematics’ own potential, one’s own mathematical potential
which is effective in constucting mathematical knowledge and skills such as
mathematical interest and self-confidence will be supported by motivation
and so, effective learning will be fulfilled.
Scales developed in motivation and their scope are explained as
follows. Keller, examining theories of motivation developed ARCS
Motivation Model (Keller, 1987a). According to Keller, there are four
components of student motivation: Attention, Relevance, Confidence and
Satisfaction. Using this ARCS model, Keller later developed Instructional
Materials Motivational Survey (IMMS) (Keller, 1987b) for instructional
design including 36 likert type items. Here, again, the IMMS instrument has
four factors, namely Attention, Relevance, Confidence and Satisfaction for
promoting and sustaining motivation. This questionnaire was adapted to
Turkish by Kutu and Sozubilir (2011) and a validity and reliability study was
conducted. In this study, a survey was constructed as two factors and
including 24 items. In order to name the factors, they took into account of the
original titles of the factors of the survey. Thus, the first factor was named
“Attention-Relevance” and second factor was named “Confidence-
Satisfaction”.
Pintrinch and De Groot (1990) developed a scale to determine
students’ metacognitive skill levels (Motivated Strategies for Learning
Questionnaire) (MSLQ). Uredi (2005) adapted this scale into Turkish as
“Motivational Strategies Scale for Learning”(Ogrenmeye İliskin
Motivasyonel Stratejiler Olcegi) including 44 test items. MSLQ,
developed by Pintrich Smith, Garcia ve McKeachie (1991), was adapted to
Turkish by Buyukozturk, Akgun, Ozkahveci ve Demirel (2004) and a validity
and reliability study was conducted. Named as OGSO, the scale consists of
two main subscales. Results of their analyses show that the first subscale,
European Scientific Journal June 2015 edition vol.11, No.16 ISSN: 1857 – 7881 (Print) e - ISSN 1857- 7431
39
Motivation, has six factors, and the second subscale, Learning Strategies, has
nine factors. Similarly, Shia (1998) developed a motivation scale by using
MSLQ. Then, Dede (2003) adapted Shia’s scale into Turkish and developed
a scale measuring instrinsic and extrinsic motivation. Umay (2002)
developed “The Achievement Motivation Scale” based on “Attribution
Theory”, which was developed by considering cognitive field theorists and
“Motivation Achievement Theory” developed by Atkinson. Asik (2006) also
developed “Motivational Regulation Scale” having two dimensions as effort
and self-competence.
When examining mathematics related scales, no direct mathematics-
motivation scale could be found aside from some scales adapted from regular
motivational scales into the mathematics field as a whole or in part. Yavuz,
Ozyıldırım ve Dogan (2012) adapted Nicholls ve colleagues’ (1990) scale of
“Method motivation Adaptation Scale” into Turkish as “Mathematics
Motivation Scale” and used it with 6th, 7th and 8th grade students. Aktan
and Tezci (2013) adapted one of the subdimensions of MSLQ, Motivational
Strategies Scale, into mathematics as “Mathematics Motivation
Scale”(MMS) to determine students’ use of motivationel strategies in
mathematics courses. The scale consists of 6 subdimensions -- intrinsic
motivation, exstrinsic motivation, subject value learning belief, self
competence and exam anxiety. Similary Liu and Lin (2010), adapted MSLQ
scale into mathematics as “Mathematics Motivated Strategies For Learning
Questionnaire” (MMSLQ). Moreover, Fennema-Sherman’s (1976) nine
scale of attitude inventory has a scale for motivation as “Effectance
Motivation Scale”; Galbraith and Haines (2000) developed a mathematical
motivation scale to use at undergraduate level having the subdimensions of
interest in mathematics, enjoyment of mathematics, and intellectual
stimulation; Tapia and Marsh developed a motivation scale to understand
students intentions to avoid or choose mathematics; Fogarty and colleagues
developed mathematics attitudes scales involving motivational factors at
undergraduate level; Pierce and his colleagues developed a scale named
“Affective Engagement Scale” involving interest and intellectual stimulation
factors which are included under motivation.
In this study, some national and international studies about
motivation are mentioned and constructs underlying motivation are
discussed. As seen in the studies noted above, motivation is generally a focus
of interest by many researchers. It can be said that some scales about
motivation have been used in mathematics but the number of scales of
motivation in mathematics is limited. According to the literature, it can be
seen that there is a lack of scales paying attention to the principles of
mathematics teaching and students’ targeted skills considering mathematics
learning in primary school and primary school students’ features. In this
European Scientific Journal June 2015 edition vol.11, No.16 ISSN: 1857 – 7881 (Print) e - ISSN 1857- 7431
40
regard, there is a need to form a reliable and valuable scale to determine
students’ motivation towards mathematics learning at primary school.
Determining students’ motivation towards mathematics learning will be
helpful to develop strategies to increase the level of motivation and to
strengthen teaching methods and techniques. Information about validity and
reliability of the scale, findings and discussion constitute the content of this
study.
Method
Working Group and Testing of the Scale
A testing form of the scale planned for the validity and reliability
study was applied to 482 third and fourth grade students in Aydın central
county. Data from twelve students were taken out of the analysis because of
wrong or missing information in the questionnarie used. In the application
form of the scale, items 1 and 14 were used as inverse items to control the
consistency of answers and, based on the control items, 82 questionnaries
which were determined as filled in carelessly were excluded in the process of
analysis. The scores of 388 students which would be subject to the analysis
were converted into standardized Z (±3,40) score values to avoid outliers and
after that data from 41 students were excluded from the analysis as a result of
this process. Finally, data from 347 students were used in the analysis.
Answers for the questionnaries were transferred to the computer by scoring
from 3 to 1 for the choices of “Agree”, “Slightly Agree” and “Disagree”.
For validity and reliability analysis SPSS 15 package programme was used.
The results of the analysis were presented in findings of this paper.
Kaiser-Meyer-Olkin (KMO) test was used in order to determine
sampling adequacy. According to the results, KMO value was found as 0.94.
Thus, KMO value, which was found as a criteria for the adequateness of the
sample size, was accepted as an indicator that the sample size was adequate.
In addition, the distribution of data must be normal for factor analysis. In the
analysis, Bartlett’s test of sphericity was found significant (χ2=14762.91;
p=.00). Barlett coefficient’s being significant was accepted as an indicator to
use factor analysis to analyze data.
Item Preparation
For the process of the scale development, scale items were prepared
firstly. In this process, essential attributions of motivation towards learning
mathematics in primary school were extracted by reviewing the resources on
motivation and motivation in mathematics learning. Then, scale items were
developed considering these essential features of motivation. These essential
attributions were also defined by considering behavioral views of motivation,
based on using reward-punishment approach; humanistic views of
European Scientific Journal June 2015 edition vol.11, No.16 ISSN: 1857 – 7881 (Print) e - ISSN 1857- 7431
41
motivation, based on realizing and fulfilling self-potential as human beings;
and cognitive views of motivation, based on beliefs, expectations, needs and
understanding of the learner. They were also defined by considering sub-
theories and concepts under these theories. Similarly, review of the items in
current motivation scales and research findings about motivation in the
literature (Aktan & Tezci, 2013; Asık, 2006; Balaban, 2002; Baser, 2007;
Dede, 2003; Christophel, 1990; Dede & Argun, 2004; Dede & Yaman ,2006;
Dogan, 2012; Gomleksiz & Kan, 2012, Kutu & Sozbilir, 2011; Nicholls,
1990; Pintrinch & De Groot, 1990; Shia, 1998; Tuan, ,Chin & Shieh 2005;
Yavuz, Ozyıldırım & Dogan,2012) also provided the researcher with a
conceptual framework in the process of item development. In this sense
seventy themes were composed (perceptual difficulty, understanding,
learning the aim of the lesson, attention-concentration, interest to the lesson,
getting bored, curiousty, material, need, willingness to learn, participation,
peer support, group work, peer-comparison, achievement etc.) and related
items were written down under these themes. Then, through organizing,
reorganizing and combining of these initial seventy themes, eight themes of
preliminary form of the scale emerged as “Feeling of success-failure, Need
for Learning, Expectation (Parent, Teacher and Society), Acceptability
(Parent, Peer and Society), Perception of Effort-Performance, Self-
competence, Participation and Value-Esteem”. In this sense, it was predicted
that the developed scale might have 8 dimensions. Finally, 83 items of
“Mathematics Motivation Scale” to understand students’ motivation towards
learning mathematics was developed. To provide content validity, which
means determining the extent to which this scale measures all facets of the
expected behaviours (Balcı, 2005), expert opinions were gathered. Based on
the suggestions of two experts, studying in psychological counseling -
guidance and mathematics education (excluding the researcher), 9 items
were removed from the scale. As a result of this process, a pool of 74 items
were left for preliminary form of the scale. The scale was also reviewed by a
linguist expert and some items were modified or corrected. Motivations of
primary school students towards learning mathematics were aimed to be
identified by a three point-grading scale. Choices of “Agree”, “Slightly
Agree” and “Disagree” were used in the scale.
Ethical Issues Considered in the Process of the Scale Development
In the process of the scale development some ethical issues were
considered as follows; special attention was paid to express scale items as
original, scales were applied in the classroom settings where the researcher
presented, participation to fill out the scale was completely voluntary, thus
participants were not obliged, scales filled out were reviewed carefully and
the scales with wrong or missing information were excluded, results of
European Scientific Journal June 2015 edition vol.11, No.16 ISSN: 1857 – 7881 (Print) e - ISSN 1857- 7431
42
analysis were presented clearly and unethical practices such as plagiarism,
falsification, fabrication was avoided.
Findings
Scale Construction
Primary School Mathematics Motivation Scale (PSMMS) was
subjected to exploratary factor analyses to verify the construct validity of the
study. Factor analysis revealed a structure with items clustered into nineteen
underlying factors having eigen values of 1 or more and explaining 50.7
percent of the total variance. Because there were too many factors extracted,
there were a few items clustered into the last eighteen factors and there was
no meaningful integrity created under these factors, the researcher decided to
examine the screeplot of principal component analysis (see Figure.1). When
looking at the change point in shape of the plot, one component above that
change point was seen. Thus, the scale was considered to retain only one
factor where the majority of variables loadied substantially.
Figure 1. Screeplot of Principal Component Analysis
In the development of the scale, 0.50 factor loading was accepted as
base, and as a result of the factor analysis, 41 items (Items of 4, 6, 9, 11, 13,
15, 16,18,19, 22, 24, 26, 27, 29, 30, 32, 34, 35, 39, 41, 42, 44, 45, 47, 48,
49, 51, 52, 53, 55, 56, 58, 59, 60, 61, 62, 65, 66, 68, 70, 72) loaded with
more than one factor or that had loadings below 0.50 were removed from the
scale. In final, 33 items consisting of positively and negatively worded items
were included in the scale. A factor loading, which expresses the relationship
of each variable to the underlying factor, must have a 0.50 or more loadings
on a component. Hovewer, a minimum factor loading of 0.30 could be
accepted for a scale having a few items (Buyukozturk, 2002). Thus, attention
European Scientific Journal June 2015 edition vol.11, No.16 ISSN: 1857 – 7881 (Print) e - ISSN 1857- 7431
43
was paid when choosing a scale item to make sure its loading was minimum
0.50 to be a part of an underlying component. As a first step of factor
analysis, principal components analysis revealed the presence of only one
component with eigen values exceeding 1, explaining 43.46 percent of the
total variance. A minimum of thirty percent of variance could be accepted
for the one factor solutions of factor analysis (Buyukozturk, 2007). As a
result of the factor analysis of PSMMS, a total of 33 items as comprising 4
negatively worded and 29 positively worded items were included in the
scale.
Item analysis of the scale
Item analysis was performed to assess the performance of individual
test items on the assumption that the overall quality of a test derives from the
quality of its items. As a result of factor analysis of PSMMS items, items’
factor loadings, items’ total correlations and item t-test values (the top 27%
and the bottom 27% by assessment score) are presented in Table 1.
Table 1: Factor loadings, item-total correlations and t values of PSMMS items
Item
No
Factor
loading
Item -total
Correlations
Item t (Top
%27-Bottom
%27) values
Item
No
Factor
loading
Item -total
Correlations
Item t (Top
%27-Bottom
%27) values
1 .732 .591 6.205*** 18 .583 .471 2.704***
2 .724 .579 5.822*** 19 .622 .489 4.479***
3 .669 .501 4.066*** 20 .715 .579 4.628***
4 .693 .526 5.473*** 21 .725 .592 5.613***
5 .575 .442 3.952*** 22 .589 .452 5.237***
6 .678 .540 4.473*** 23 .636 .500 3.970***
7 .592 .443 2.707*** 24 .683 .554 6.979***
8 .797 .665 7.951*** 25 .728 .594 5.133***
9 .734 .591 6.205*** 26 .655 .516 2.851***
10 .643 .503 4.703*** 27 .695 .571 4.512***
11 .655 .517 5.724*** 28 .668 .524 4.332***
12 .687 .545 3.965*** 29 .635 .502 4.528***
13 .614 .473 3.566*** 30 .759 .627 6.474***
14 .693 .565 5.055*** 31 .615 .476 4.636***
15 .583 .437 2.857*** 32 .586 .436 2.841***
16 .643 .506 2.649*** 33 .768 .630 6.770***
17 .716 .580 4.961***
1
n = 347 2
n1 =n 2= 93 ***p< .001
As can be seen in the table illustrated above, an analysis was
performed to compare the mean scores and to define difference based on the
total item means between high-low-27-percent group in respect to students’
mathematical motivations. Independent t-test was calculated to compare 347
participants’ mean score of the top 27% (n=93) and the bottom 27% (n=93)
European Scientific Journal June 2015 edition vol.11, No.16 ISSN: 1857 – 7881 (Print) e - ISSN 1857- 7431
44
by assessment score. When examining Table 1, it can be seen that t values of
the difference of item points of lower and upper groups with 27% vary
between 0.436 (p<.000) and 0 .665 (p<.000) and the t-test result among 33
items is found significant (p<0.001). As can be seen from the table , the
item-total score of the upper-group with 27% is significantly higher than the
item-total score of the lower-group’s with 27% (p < 0.001) considering all
the items. In general, the item-total correlation values of .30 or higher can be
accepted as an adequate value for discrimination of participants
(Buyukozturk, 2005). As a result of the comparision, it can be said that the
groups were distinctively different from each other in respect to their scores
of each of the 33 items individually and their total scale score. According to
t values it can also be said that two extremes of the factor were adequately
differentiated for the factor and total score. Thus, 33 scale items are
considered as having higher levels of reliability and as measuring the same
behaviors.
Reliability Study of the Scale
The internal consistency coefficient obtained from the answers to the
33 items was calculated through Cronbach Alpha reliability coefficients.
Calculating the Cronbach Alpha coefficient was known as one of the most
frequently used approaches to address the reliability of scales in research.
The internal consistency coefficients of the scale was found as 0.94.
According to Ozdamar (2004), it can be highly reliable if the internal
consistency coefficient is between 0.8 and 1.00. Thus, the value of the alpha
as the criteria of reliability of the scale was found adequate for the reliability
of PSMMS.
Administration and Scoring scale
The final form of PSMMS has 33 items and a three point grading
system. Thus, the maximum scoring from the scale is 99 while the minimum
scoring is 33. Items of 3, 5, 9 and 11 have to be coded reversely. Gaining
higher scores indicates more positive motivation of primary school students
towards learning mathematics. The mean of the scale is 66, and
interpretations of the acquired scores would be done according to ±1 , ±2, or
±3 standard deviations from the mean based on the normal distribution. If
the interpretation is done as stating “low level motivation, middle level
motivation and high level motivation”, then the scores between 33 and 49
would mean low level motivation; the scores between 50 and 82 would mean
middle level motivation and the scores between 83 and 99 would mean high
level motivation. If the interpretation is done as stating “very low level
motivation, low level motivation, middle level motivation,high level
motivation and very high level motivation”, then the scores between 33 and
European Scientific Journal June 2015 edition vol.11, No.16 ISSN: 1857 – 7881 (Print) e - ISSN 1857- 7431
45
43 would mean very low level motivation; the scores between 44 and 54
would mean low level motivation; the scores between 55 and 77 would mean
middle level motivation; the scores between 78 and 88 would mean high
level motivation and the scores between 83 and 99 would mean very high
level motivation.
Discussion
In this study, the aim was to develop a scale for determining
motivation of primary school students towards learning mathematics. Due to
a lack of scales in literature, specifically constructed for mathematics and
especially measuring the motivation in mathematics of primary school
students, this scale, constructed according to the theories of motivation, fills
a major gap. As a result of the factor analysis done to determine PSMMS’s
factor construct developed in this study, the scale was considered to have
only one factor. In general, the item-total correlation values of 0.30 or higher
can be accepted as an adequate value for discrimination of participants
(Buyukozturk, 2005). It was observed from item analysis that item test
correlations met the need of 0.30 requirement. Thus, the scale items were
considered as having higher levels of reliability and as measuring the same
behaviors. The significance of each correlation was examined by t test and it
was concluded that items have adequate power to predict the items’ total
score.
As a result, Primary School Mathematics Motivation Scale
(PSMMS), which consists of 1 factor and 33 items comprising 4 negatively
worded and 29 positively worded items, came into existence.
In general, motivation scales as generally comprising learning
strategies are seen in literature up to a factor of 15 with a variety of different
names. In the beginning of this study, when the themes were constructed
based on the motivational theories, it was predicted that the developed scale
might cluster into eight factors. Mainly, the motivational scales were
observed to come out at least having two factors as intrinsic motivation and
exstrinsic motivation. When examining scales involving mathematical
motivation (Tapia & Marsh,2004; Galbraith & Haines, 2000; Yavuz,
Ozyıldırım & Dogan, 2012; Aktan & Tezci, 2013), it is evident that they
were prepared mostly for undergraduate level and clustered into two or three
factors. Because of the results of the mentioned studies, it was predicted that
the the scale developed in this study might have eight factors or at least two
factors. Hovewer, the scale came out having only one factor including items
that have some of the important attributes of the theories of motivation.
Intrinsic motivation and exstrinsic motivation are not differentiated from
each other in this scale. Thus, it does not give an idea of whether students’
motivation in mathematics is intrinsic or exstrinsic, but instead measures
European Scientific Journal June 2015 edition vol.11, No.16 ISSN: 1857 – 7881 (Print) e - ISSN 1857- 7431
46
students’ motivations towards mathematics by one factor. When examining
the scale in respect to the factor and the total score it can be said that the
scale discriminates the groups, which were distinctively different from each
other. In this sense, the scale can be used for the purpose of general
surveying and determination of motivation of mathematics in general.
Finally, the results of the study indicate that the scale determines the
students’ motivation towards learning mathematics. It can measure
motivation of students for learning mathematics by a single construct. By
reversing negatively worded items (items of 3, 5, 9, 11) and scoring the
scale, acquiring higher scores (total score) indicates more positive
motivation and acquiring lower scores indicates more negative motivation
among primary school students towards learning mathematics.
According to the results of the PSMMS’s validity and reliability
study, it can be claimed that the scale is ready, reliable and valid to
determine motivation of primary school students towards learning
mathematics. It is suggested to repeat validty and reliability studies on
groups of different students and to analyze the scale through confirmatory
factor analysis (CFA). Moreover, Aktan and Tezci’s (2013) adaptative
version of one of the sub-dimensions of MSLQ, Motivational Strategies
Scale, into mathematics as “Mathematics Motivation Scale”(MMS) to
determine students’ use of motivational strategies in mathematics courses is
suggested to be used in the same groups for criterion validity.
References:
Allen, D. (1999). Desire to finish college: An empirical link between
motivation and persistence. Research in Higher Education, 40(4), 461-485.
Asık, G. (2006). Ogrencilerin Problem Cozmede Bilisustu ve Motivasyona
İliskin Denetimleri ile Bilisustu Deneyimleri Arasındaki İliskiyi Acıklayıcı
Bir Model Calısması.Yayımlanmıs Yuksek Lisans Tezi, Bogazici
Universitesi, Ortaogretim Fen ve Matematik Egitimi, İstanbul.
Aktan, S. (2013). Ogrencileri Akademik Basarısı, Oz Duzenleme Becerisi,
Motivasyonu ve Ogretmenlerin ogretim Stilleri Arasındaki
İliski.Yayımlanmıs Doktora Tezi, Balıkesir Universitesi Sosyal Bilimler
Enstitusu, Balıkesir.
Aktan, S. & Tezci, E. (2013).Matematik Motivasyon Olcegi (MMO)
Gecerlik ve Guvenirlik Calısması. The Journal of Academic Social Science
Studies International Journal of Social Science Vol. 6 Issue 4, p. 57-77.
Balaban, S. J. (2002). Bilgisayar destekli ogretimde gudulenme kaynagı ve
yetkinlik duzeyinin ogrenci basarı ve tutumları uzerindeki etkisi.
Yayımlanmıs Doktora Tezi, Anadolu Universitesi Sosyal Bilimler Enstitusu,
Eskisehir.
Balcı, A. (2005). Sosyal Bilimlerde Arastırma.Ankara: PegemA Yayıncılık.
European Scientific Journal June 2015 edition vol.11, No.16 ISSN: 1857 – 7881 (Print) e - ISSN 1857- 7431
47
Baser, M. (2007). The contribution of learning motivation, reasoning ability
and learning orientation to ninth grade international baccalaureate and
national program students’ understanding of mitosis and meiosis. Master’s
Thesis, Middle East Technical University, Ankara, Turkey.
Brophy, J. (1988). Educating teachers about managing classrooms and
students Teaching and Teacher Education, 4 (1), 1-18
Buyukozturk, S. (2005). Sosyal Bilimler İcin Veri Analizi El Kitabı. Ankara:
Pegema Yayıncılık.
Buyukozturk, S.; Akgun, O.E.; Ozkahveci, O. ve Demirel, F. (2004).
Gudulenme ve Ogrenme Stratejileri Olceginin Turkce Formunun Gecerlik ve
Guvenirlik Calısması. Kuram ve Uygulamada Egitim Bilimleri / Educational
Sciences: Theory & Practice, 4(2) Kasım/November 2004. s. 207-239.
Buyukozturk, S.. (2007). Deneysel desenler: Ontest-sontest kontrol gruplu
desen ve SPSS uygulamalı veri analizi. Deneysel desenler, ontest-sontest
kontrol gruplu desen ve verielrin analizinde kullanılan alternatif istatistikler
Turkiye. Pegem.
Christophel, D. M. (1990). The relationship among teacher immediacy
behaviors student motivation and learning. Communication Education, 39,
323–350.
Dede, Y. & Yaman, S. (2006). Fen Ogrenmeye Yonelik Motivasyon Olcegi:
Gecerlik ve Guvenirlik Calısması. Necatibey Egitim Fakultesi Elektronik
Fen ve Matematik Egitimi Dergisi (EFMED) 2(1), 19-37
Dede, Y. (2003). Arcs Motivasyon Modeli’nin Ogrencilerin Matematige
Yonelik Motivasyonlarına Etkisi. Pamukkale Universitesi Egitim Fakultesi
Dergisi, 2 (14), 173-182.
Dede, Y. & Argun Z. (2004). Ogrencilerin Matematige yonelik İcsel ve
Dıssal Motivasyonlarının Belirlenmesi. Egitim ve bilim Dergisi, 29 (134),
49-54.
Doğan, B. (2012). Grup etkinlikleri ile matematik ogretiminin matematik
basarısına ve matematige yonelik tutuma etkisi .Yayımlanmamıs Yuksek
Lisans Tezi,Yeditepe Universitesi, İstanbul
Eric Zhi Feng Liu, E.Z.F., Lin, C.H., (2010). The Survey Study Of
Mathematics Motivated Strategies For Learning Questionnaire (MMSLQ)
For Grade 10–12 Taiwanese Studentstojet: The Turkish Online Journal of
Educational Technology, vol.9 Issue 2
Fennema, E., & Sherman, J. A. (1976). Fennema-Sherman mathematics
attitudes scales; instruments desinged to measure attitudes towards the
learning of mathematics by females and males. Catalog of Selected
Documents in Psychology, 6(1), 31.
Fogarty, G., Cretchley, P., Harman, C., Ellerton, N., & Konki, N. (2001).
Validation of a questionnaire to measure mathematics confidence, computer
European Scientific Journal June 2015 edition vol.11, No.16 ISSN: 1857 – 7881 (Print) e - ISSN 1857- 7431
48
confidence and attitudes towards technology for learning mathematics.
Mathematics Education Research Journal, 13(2), 154-159.
Galbraith, P., & Haines, C. (2000). Mathematics-Computing Attitude Scales.
Monographs in Continuing Education London: City University.
Gardner, R. C. (1985a). Social psychology and second language learning:
The role of attitudes and motivation. London: Edward Arnold Publishers
Gomleksiz, N.,M.& Kan, U.A.(2012) Sosyal Bilgiler Dersi Motivasyon
Olceginin Gecerlik ve Guvenirlik Calısması. Fırat Universitesi Sosyal
Bilimler Dergisi .22( 2),116-125
Keller, J. M. (1987a). Development and use of the ARCS model of
motivational design. Journal of Instructional Development, 10(3), 2-10
Keller, J. M. (1987b). IMMS: Instructional materials motivation survey.
Tallahassee, Florida: Florida State University.
Kutu, H. & Sozbilir M. (2011). Ogretim Materyalleri Motivasyon anketinin
Turkce’ye Uyarlanması: Gecerlik ve Guvenirlik Calısması. Necatibey egitim
Fekultesi Elektronik Fen ve Matematik Egitimi Dergisi, 5(1), 292-312
Nicholls, J. G.,Cobb, P.,Wood.,T.,Yackel,,E.,Patashnick.,M.(1990).
Assessing Students' Theories of Success in Mathematics Individual and
Classroom Differences.Journal for Research in Mathematics Education
,21,109-122.
Pierce, R., Stacey, K., and Barkatsas. A. (2007) A scale for monitoring
students' attitudes to learning mathematics with technology. Computers &
Education. Vol 48 (2). 285-300
Pintrich, P. R., & Schunk, D. H. (2002). Motivation in education: Theory,
research, and applications (2nd ed.). Upper Saddle River, NJ: PrenticeHall.
Pintrich, P.R., ve De Groot, E. (1990). Motivational and self regulated
learning components of classroom academic performance. Journal of
Educational Psychology, 82(1), 33-40.
Pintrich, P.R.,Smith,D.A.F., Garcia, T. ve McKeachie,W.J. (1991A Manual
for the Use of the Motivated Strategies for Learning Questionaire (MSLQ).
National Center for Research to Improve Postsecondary Teaching and
Learning. Ann Arbor: Michigan. ED 338 122.
Schiefele, U., & Rheinberg, F. (1997). Motivation and knowledge
acquisition: Searching for mediating processes. In P. R. Pintrich, & L.
Maehr, Advances in motivation and achievement (pp. 251–301). Greenwich,
CT: JAI Press.
Shia, R. (1998). Academic Intrinsic And Extrinsic Motivation And
Metacognition. Assessing Academic Intrinsic Motivation: A Look At
Student. Goals And Personal Strategy. <
http://www.cet.edu/pdf/motivation.pdf>, (11 February, 2014)
Tapia, M., & Marsh II, G. (2004). An instrument to measure mathematics
attitudes. Academic Exchange Quarterly. 8 (2), 1-8.
European Scientific Journal June 2015 edition vol.11, No.16 ISSN: 1857 – 7881 (Print) e - ISSN 1857- 7431
49
Tuan, H. L. Chin, C.C & Shieh, S. H. (2005). The development of a
questionnaire to measure students’ motivation towards science learning.
International Journal of Science Education, 27(6), 639- 654.
Umay, A. (2002). Matematik Ogretmen Adaylarının Basarı Gudusu
Duzeyleri, DegiĢimi Ve Degisimi Etkileyen Faktorler. Hacettepe
Universitesi Egitim Fakultesi Dergisi. 22: 148-155
Uredi, I. (2005). Algılanan anne baba tutumlarının ilkogretim 8. sınıf
ogrencilerinin oz-duzenleyici ogrenme stratejileri ve motivasyonel inancları
uzerindeki etkisi. Yayınlanmamıs doktora tezi, Yıldız Teknik Universitesi,
İstanbul.
Yavuz, G.,Ozyıldırım F.,Dogan N.(2012). Mathematics Motivation Scale: A
Validity and Reliability. Procedia - Social and Behavioral Sciences. Vol
46,(2012) 1633–1638
Wigfield, A. (1994). Expectancy-value theory of achievement motivation: A
developmental perspective. Educational Psychology Review, 6, 49–78.
Primary School Mathematics Motivation Scale(PSMMS)
I
agree
I
slightly
agree
I
disagree
1. Mathematics is an easy subject for me
2. I would like to raise my hand in mathematics class
3. I get bored in mathematics class
4. Topics in mathematics are interesting for me.
5. I get annoyed in mathematics class
6. I would like to participate in activites in mathematics class
7. Mathematics exams are easy for me
8. I like mathematics class
9. Mathematics is a difficult subject for me
10. I listen to mathematics subject carefully.
11. I am afraid of solving mathematics problems thinking that I can’t
do
12. I repeat the topics I learned in mathematics class
13. I am happy when I am successful in mathematics class
14. I think that mathematics improves my intelligence
15. I would like to know how mathematical topics arose.
16. I think that what I am learning in mathematics is necessary for
my future
17. I feel more confident when I succeed in mathematics.
18. I can use the things that I learned in mathematics in daily life.
19. I am good at in skills of making prediction in mathematics
subject.
20. I can explain the things that I learned in my own words in
mathematics subject.
European Scientific Journal June 2015 edition vol.11, No.16 ISSN: 1857 – 7881 (Print) e - ISSN 1857- 7431
50
21. I repeat the topics that I didn’t understand in mathematics
subject.
22. I ask teacher about the topics that I couldn’t understand in
mathematics class.
23. I study mathematics because I think what I've learned is
necessary for me.
24. I can explain reasons of the use of procedures while solving
mathematics problems.
Primary School Mathematics Motivation Scale(PSMMS)
I
agree
I
slightly
agree
I
disagree
25. I become more willing to learn new topics while learning current
topics in mathematics subject
26. I am aware of the benefits from what I’ve learned in mathematics
subject.
27. I am curious about what I would learn in new topics in
mathematics lesson.
28. I like finding more than one solutions to mathematics problems.
29. I can build up a connection between mathematical topics and
topics in other subjects.
30. When I get stuck in a topic in mathematics I investigate that topic
from different resources.
31. I think that what I am learning is necessary to learn new topics in
mathematics.
32. I can express the things that I learned in mathematics through
different ways (drawings, figures, tables etc.)
33. I can build up a connection between my current learnings and
previous learnings in mathematics.

Motivation scale

  • 1.
    European Scientific JournalJune 2015 edition vol.11, No.16 ISSN: 1857 – 7881 (Print) e - ISSN 1857- 7431 37 PRIMARY SCHOOL MATHEMATICS MOTIVATION SCALE Ezgi Ersoy,MS Cumali Oksuz, PhD Adnan Menderes University , Aydin, Turkey Abstract This study was aimed at developing a scale for determining motivation of primary school students towards learning Mathematics. A preliminary form of the scale included 74 Three-point scale items and data was collected from a total of 482 participants who were 3rd and 4th grade primary students. For construct validity, varimax orthagonal rotation connects with exploratory factor analysis was used. In the result of factor analysis, the scale involves in one factor explaining 42.46% of total variance. Based on the result of item analysis, the scale consisted of 33 items of which 29 were positive and 4 were negative. The overall Cronbach- alpha coefficient of the scale was high (α= 0.94) indicating that it was a fairly consistent measure.The results of the study indicate that the scale named as primary school mathematics motivation scale (PSMMS) has good psychometric properties and is reliable and valid. It can be used reliably in future educational researches Keywords: Primary school mathematics, motivation, scale development Introduction Teaching mathematics should not be merely considered as enabling students to acquire basic operational skills as well as problem solving skills. Having considered the long term process of education, the importance of each mathematics lesson offered should be kept in mind with regard to its value to the students’ current educational lives, its contribution to their further learning and to their endeavours to do mathematics with self- confidence; perhaps even to pursue a profession in that journey. To this aim, while designing the ideal classroom environment, the identification of how close or far the practices are from that ideal will help to reach the aim. It is significant to design an ideal classroom atmosphere considering the affective and psychomotor acquisitions along with the cognitive ones. To accommodate these features, knowing the level of each student's motivation
  • 2.
    European Scientific JournalJune 2015 edition vol.11, No.16 ISSN: 1857 – 7881 (Print) e - ISSN 1857- 7431 38 in mathematics is a significant tool to support students in reaching both close and far goals. However, it is also important to treat motivation as a goal. In this sense, it is identified that motivation has an impact on the type, continuity and frequency of learning activities, and students’ motivational and functional status during this process (Schiefele and Rheinberg, 1997). Motivation expressed as an internal stimulus encouraging individuals to take an action (Allen, 1999, p. 463) is also defined as a force activating individuals, providing continuity and directing behaviours in terms of goals (Pintrich & Schunk, 2002). Therefore, students’ motivation affects their learning (Gardner, 1985; Brophy, 1988; Wigfield, 1994). Each individual is different, and none of them has exactly similar cognitive, affective and psychomotor features. From this point, motivation leading students’ learning enables students to explore the importance of mathematics for their life and for the world and to comprehend the benefits of mathematics. In addition to this, besides mathematics’ own potential, one’s own mathematical potential which is effective in constucting mathematical knowledge and skills such as mathematical interest and self-confidence will be supported by motivation and so, effective learning will be fulfilled. Scales developed in motivation and their scope are explained as follows. Keller, examining theories of motivation developed ARCS Motivation Model (Keller, 1987a). According to Keller, there are four components of student motivation: Attention, Relevance, Confidence and Satisfaction. Using this ARCS model, Keller later developed Instructional Materials Motivational Survey (IMMS) (Keller, 1987b) for instructional design including 36 likert type items. Here, again, the IMMS instrument has four factors, namely Attention, Relevance, Confidence and Satisfaction for promoting and sustaining motivation. This questionnaire was adapted to Turkish by Kutu and Sozubilir (2011) and a validity and reliability study was conducted. In this study, a survey was constructed as two factors and including 24 items. In order to name the factors, they took into account of the original titles of the factors of the survey. Thus, the first factor was named “Attention-Relevance” and second factor was named “Confidence- Satisfaction”. Pintrinch and De Groot (1990) developed a scale to determine students’ metacognitive skill levels (Motivated Strategies for Learning Questionnaire) (MSLQ). Uredi (2005) adapted this scale into Turkish as “Motivational Strategies Scale for Learning”(Ogrenmeye İliskin Motivasyonel Stratejiler Olcegi) including 44 test items. MSLQ, developed by Pintrich Smith, Garcia ve McKeachie (1991), was adapted to Turkish by Buyukozturk, Akgun, Ozkahveci ve Demirel (2004) and a validity and reliability study was conducted. Named as OGSO, the scale consists of two main subscales. Results of their analyses show that the first subscale,
  • 3.
    European Scientific JournalJune 2015 edition vol.11, No.16 ISSN: 1857 – 7881 (Print) e - ISSN 1857- 7431 39 Motivation, has six factors, and the second subscale, Learning Strategies, has nine factors. Similarly, Shia (1998) developed a motivation scale by using MSLQ. Then, Dede (2003) adapted Shia’s scale into Turkish and developed a scale measuring instrinsic and extrinsic motivation. Umay (2002) developed “The Achievement Motivation Scale” based on “Attribution Theory”, which was developed by considering cognitive field theorists and “Motivation Achievement Theory” developed by Atkinson. Asik (2006) also developed “Motivational Regulation Scale” having two dimensions as effort and self-competence. When examining mathematics related scales, no direct mathematics- motivation scale could be found aside from some scales adapted from regular motivational scales into the mathematics field as a whole or in part. Yavuz, Ozyıldırım ve Dogan (2012) adapted Nicholls ve colleagues’ (1990) scale of “Method motivation Adaptation Scale” into Turkish as “Mathematics Motivation Scale” and used it with 6th, 7th and 8th grade students. Aktan and Tezci (2013) adapted one of the subdimensions of MSLQ, Motivational Strategies Scale, into mathematics as “Mathematics Motivation Scale”(MMS) to determine students’ use of motivationel strategies in mathematics courses. The scale consists of 6 subdimensions -- intrinsic motivation, exstrinsic motivation, subject value learning belief, self competence and exam anxiety. Similary Liu and Lin (2010), adapted MSLQ scale into mathematics as “Mathematics Motivated Strategies For Learning Questionnaire” (MMSLQ). Moreover, Fennema-Sherman’s (1976) nine scale of attitude inventory has a scale for motivation as “Effectance Motivation Scale”; Galbraith and Haines (2000) developed a mathematical motivation scale to use at undergraduate level having the subdimensions of interest in mathematics, enjoyment of mathematics, and intellectual stimulation; Tapia and Marsh developed a motivation scale to understand students intentions to avoid or choose mathematics; Fogarty and colleagues developed mathematics attitudes scales involving motivational factors at undergraduate level; Pierce and his colleagues developed a scale named “Affective Engagement Scale” involving interest and intellectual stimulation factors which are included under motivation. In this study, some national and international studies about motivation are mentioned and constructs underlying motivation are discussed. As seen in the studies noted above, motivation is generally a focus of interest by many researchers. It can be said that some scales about motivation have been used in mathematics but the number of scales of motivation in mathematics is limited. According to the literature, it can be seen that there is a lack of scales paying attention to the principles of mathematics teaching and students’ targeted skills considering mathematics learning in primary school and primary school students’ features. In this
  • 4.
    European Scientific JournalJune 2015 edition vol.11, No.16 ISSN: 1857 – 7881 (Print) e - ISSN 1857- 7431 40 regard, there is a need to form a reliable and valuable scale to determine students’ motivation towards mathematics learning at primary school. Determining students’ motivation towards mathematics learning will be helpful to develop strategies to increase the level of motivation and to strengthen teaching methods and techniques. Information about validity and reliability of the scale, findings and discussion constitute the content of this study. Method Working Group and Testing of the Scale A testing form of the scale planned for the validity and reliability study was applied to 482 third and fourth grade students in Aydın central county. Data from twelve students were taken out of the analysis because of wrong or missing information in the questionnarie used. In the application form of the scale, items 1 and 14 were used as inverse items to control the consistency of answers and, based on the control items, 82 questionnaries which were determined as filled in carelessly were excluded in the process of analysis. The scores of 388 students which would be subject to the analysis were converted into standardized Z (±3,40) score values to avoid outliers and after that data from 41 students were excluded from the analysis as a result of this process. Finally, data from 347 students were used in the analysis. Answers for the questionnaries were transferred to the computer by scoring from 3 to 1 for the choices of “Agree”, “Slightly Agree” and “Disagree”. For validity and reliability analysis SPSS 15 package programme was used. The results of the analysis were presented in findings of this paper. Kaiser-Meyer-Olkin (KMO) test was used in order to determine sampling adequacy. According to the results, KMO value was found as 0.94. Thus, KMO value, which was found as a criteria for the adequateness of the sample size, was accepted as an indicator that the sample size was adequate. In addition, the distribution of data must be normal for factor analysis. In the analysis, Bartlett’s test of sphericity was found significant (χ2=14762.91; p=.00). Barlett coefficient’s being significant was accepted as an indicator to use factor analysis to analyze data. Item Preparation For the process of the scale development, scale items were prepared firstly. In this process, essential attributions of motivation towards learning mathematics in primary school were extracted by reviewing the resources on motivation and motivation in mathematics learning. Then, scale items were developed considering these essential features of motivation. These essential attributions were also defined by considering behavioral views of motivation, based on using reward-punishment approach; humanistic views of
  • 5.
    European Scientific JournalJune 2015 edition vol.11, No.16 ISSN: 1857 – 7881 (Print) e - ISSN 1857- 7431 41 motivation, based on realizing and fulfilling self-potential as human beings; and cognitive views of motivation, based on beliefs, expectations, needs and understanding of the learner. They were also defined by considering sub- theories and concepts under these theories. Similarly, review of the items in current motivation scales and research findings about motivation in the literature (Aktan & Tezci, 2013; Asık, 2006; Balaban, 2002; Baser, 2007; Dede, 2003; Christophel, 1990; Dede & Argun, 2004; Dede & Yaman ,2006; Dogan, 2012; Gomleksiz & Kan, 2012, Kutu & Sozbilir, 2011; Nicholls, 1990; Pintrinch & De Groot, 1990; Shia, 1998; Tuan, ,Chin & Shieh 2005; Yavuz, Ozyıldırım & Dogan,2012) also provided the researcher with a conceptual framework in the process of item development. In this sense seventy themes were composed (perceptual difficulty, understanding, learning the aim of the lesson, attention-concentration, interest to the lesson, getting bored, curiousty, material, need, willingness to learn, participation, peer support, group work, peer-comparison, achievement etc.) and related items were written down under these themes. Then, through organizing, reorganizing and combining of these initial seventy themes, eight themes of preliminary form of the scale emerged as “Feeling of success-failure, Need for Learning, Expectation (Parent, Teacher and Society), Acceptability (Parent, Peer and Society), Perception of Effort-Performance, Self- competence, Participation and Value-Esteem”. In this sense, it was predicted that the developed scale might have 8 dimensions. Finally, 83 items of “Mathematics Motivation Scale” to understand students’ motivation towards learning mathematics was developed. To provide content validity, which means determining the extent to which this scale measures all facets of the expected behaviours (Balcı, 2005), expert opinions were gathered. Based on the suggestions of two experts, studying in psychological counseling - guidance and mathematics education (excluding the researcher), 9 items were removed from the scale. As a result of this process, a pool of 74 items were left for preliminary form of the scale. The scale was also reviewed by a linguist expert and some items were modified or corrected. Motivations of primary school students towards learning mathematics were aimed to be identified by a three point-grading scale. Choices of “Agree”, “Slightly Agree” and “Disagree” were used in the scale. Ethical Issues Considered in the Process of the Scale Development In the process of the scale development some ethical issues were considered as follows; special attention was paid to express scale items as original, scales were applied in the classroom settings where the researcher presented, participation to fill out the scale was completely voluntary, thus participants were not obliged, scales filled out were reviewed carefully and the scales with wrong or missing information were excluded, results of
  • 6.
    European Scientific JournalJune 2015 edition vol.11, No.16 ISSN: 1857 – 7881 (Print) e - ISSN 1857- 7431 42 analysis were presented clearly and unethical practices such as plagiarism, falsification, fabrication was avoided. Findings Scale Construction Primary School Mathematics Motivation Scale (PSMMS) was subjected to exploratary factor analyses to verify the construct validity of the study. Factor analysis revealed a structure with items clustered into nineteen underlying factors having eigen values of 1 or more and explaining 50.7 percent of the total variance. Because there were too many factors extracted, there were a few items clustered into the last eighteen factors and there was no meaningful integrity created under these factors, the researcher decided to examine the screeplot of principal component analysis (see Figure.1). When looking at the change point in shape of the plot, one component above that change point was seen. Thus, the scale was considered to retain only one factor where the majority of variables loadied substantially. Figure 1. Screeplot of Principal Component Analysis In the development of the scale, 0.50 factor loading was accepted as base, and as a result of the factor analysis, 41 items (Items of 4, 6, 9, 11, 13, 15, 16,18,19, 22, 24, 26, 27, 29, 30, 32, 34, 35, 39, 41, 42, 44, 45, 47, 48, 49, 51, 52, 53, 55, 56, 58, 59, 60, 61, 62, 65, 66, 68, 70, 72) loaded with more than one factor or that had loadings below 0.50 were removed from the scale. In final, 33 items consisting of positively and negatively worded items were included in the scale. A factor loading, which expresses the relationship of each variable to the underlying factor, must have a 0.50 or more loadings on a component. Hovewer, a minimum factor loading of 0.30 could be accepted for a scale having a few items (Buyukozturk, 2002). Thus, attention
  • 7.
    European Scientific JournalJune 2015 edition vol.11, No.16 ISSN: 1857 – 7881 (Print) e - ISSN 1857- 7431 43 was paid when choosing a scale item to make sure its loading was minimum 0.50 to be a part of an underlying component. As a first step of factor analysis, principal components analysis revealed the presence of only one component with eigen values exceeding 1, explaining 43.46 percent of the total variance. A minimum of thirty percent of variance could be accepted for the one factor solutions of factor analysis (Buyukozturk, 2007). As a result of the factor analysis of PSMMS, a total of 33 items as comprising 4 negatively worded and 29 positively worded items were included in the scale. Item analysis of the scale Item analysis was performed to assess the performance of individual test items on the assumption that the overall quality of a test derives from the quality of its items. As a result of factor analysis of PSMMS items, items’ factor loadings, items’ total correlations and item t-test values (the top 27% and the bottom 27% by assessment score) are presented in Table 1. Table 1: Factor loadings, item-total correlations and t values of PSMMS items Item No Factor loading Item -total Correlations Item t (Top %27-Bottom %27) values Item No Factor loading Item -total Correlations Item t (Top %27-Bottom %27) values 1 .732 .591 6.205*** 18 .583 .471 2.704*** 2 .724 .579 5.822*** 19 .622 .489 4.479*** 3 .669 .501 4.066*** 20 .715 .579 4.628*** 4 .693 .526 5.473*** 21 .725 .592 5.613*** 5 .575 .442 3.952*** 22 .589 .452 5.237*** 6 .678 .540 4.473*** 23 .636 .500 3.970*** 7 .592 .443 2.707*** 24 .683 .554 6.979*** 8 .797 .665 7.951*** 25 .728 .594 5.133*** 9 .734 .591 6.205*** 26 .655 .516 2.851*** 10 .643 .503 4.703*** 27 .695 .571 4.512*** 11 .655 .517 5.724*** 28 .668 .524 4.332*** 12 .687 .545 3.965*** 29 .635 .502 4.528*** 13 .614 .473 3.566*** 30 .759 .627 6.474*** 14 .693 .565 5.055*** 31 .615 .476 4.636*** 15 .583 .437 2.857*** 32 .586 .436 2.841*** 16 .643 .506 2.649*** 33 .768 .630 6.770*** 17 .716 .580 4.961*** 1 n = 347 2 n1 =n 2= 93 ***p< .001 As can be seen in the table illustrated above, an analysis was performed to compare the mean scores and to define difference based on the total item means between high-low-27-percent group in respect to students’ mathematical motivations. Independent t-test was calculated to compare 347 participants’ mean score of the top 27% (n=93) and the bottom 27% (n=93)
  • 8.
    European Scientific JournalJune 2015 edition vol.11, No.16 ISSN: 1857 – 7881 (Print) e - ISSN 1857- 7431 44 by assessment score. When examining Table 1, it can be seen that t values of the difference of item points of lower and upper groups with 27% vary between 0.436 (p<.000) and 0 .665 (p<.000) and the t-test result among 33 items is found significant (p<0.001). As can be seen from the table , the item-total score of the upper-group with 27% is significantly higher than the item-total score of the lower-group’s with 27% (p < 0.001) considering all the items. In general, the item-total correlation values of .30 or higher can be accepted as an adequate value for discrimination of participants (Buyukozturk, 2005). As a result of the comparision, it can be said that the groups were distinctively different from each other in respect to their scores of each of the 33 items individually and their total scale score. According to t values it can also be said that two extremes of the factor were adequately differentiated for the factor and total score. Thus, 33 scale items are considered as having higher levels of reliability and as measuring the same behaviors. Reliability Study of the Scale The internal consistency coefficient obtained from the answers to the 33 items was calculated through Cronbach Alpha reliability coefficients. Calculating the Cronbach Alpha coefficient was known as one of the most frequently used approaches to address the reliability of scales in research. The internal consistency coefficients of the scale was found as 0.94. According to Ozdamar (2004), it can be highly reliable if the internal consistency coefficient is between 0.8 and 1.00. Thus, the value of the alpha as the criteria of reliability of the scale was found adequate for the reliability of PSMMS. Administration and Scoring scale The final form of PSMMS has 33 items and a three point grading system. Thus, the maximum scoring from the scale is 99 while the minimum scoring is 33. Items of 3, 5, 9 and 11 have to be coded reversely. Gaining higher scores indicates more positive motivation of primary school students towards learning mathematics. The mean of the scale is 66, and interpretations of the acquired scores would be done according to ±1 , ±2, or ±3 standard deviations from the mean based on the normal distribution. If the interpretation is done as stating “low level motivation, middle level motivation and high level motivation”, then the scores between 33 and 49 would mean low level motivation; the scores between 50 and 82 would mean middle level motivation and the scores between 83 and 99 would mean high level motivation. If the interpretation is done as stating “very low level motivation, low level motivation, middle level motivation,high level motivation and very high level motivation”, then the scores between 33 and
  • 9.
    European Scientific JournalJune 2015 edition vol.11, No.16 ISSN: 1857 – 7881 (Print) e - ISSN 1857- 7431 45 43 would mean very low level motivation; the scores between 44 and 54 would mean low level motivation; the scores between 55 and 77 would mean middle level motivation; the scores between 78 and 88 would mean high level motivation and the scores between 83 and 99 would mean very high level motivation. Discussion In this study, the aim was to develop a scale for determining motivation of primary school students towards learning mathematics. Due to a lack of scales in literature, specifically constructed for mathematics and especially measuring the motivation in mathematics of primary school students, this scale, constructed according to the theories of motivation, fills a major gap. As a result of the factor analysis done to determine PSMMS’s factor construct developed in this study, the scale was considered to have only one factor. In general, the item-total correlation values of 0.30 or higher can be accepted as an adequate value for discrimination of participants (Buyukozturk, 2005). It was observed from item analysis that item test correlations met the need of 0.30 requirement. Thus, the scale items were considered as having higher levels of reliability and as measuring the same behaviors. The significance of each correlation was examined by t test and it was concluded that items have adequate power to predict the items’ total score. As a result, Primary School Mathematics Motivation Scale (PSMMS), which consists of 1 factor and 33 items comprising 4 negatively worded and 29 positively worded items, came into existence. In general, motivation scales as generally comprising learning strategies are seen in literature up to a factor of 15 with a variety of different names. In the beginning of this study, when the themes were constructed based on the motivational theories, it was predicted that the developed scale might cluster into eight factors. Mainly, the motivational scales were observed to come out at least having two factors as intrinsic motivation and exstrinsic motivation. When examining scales involving mathematical motivation (Tapia & Marsh,2004; Galbraith & Haines, 2000; Yavuz, Ozyıldırım & Dogan, 2012; Aktan & Tezci, 2013), it is evident that they were prepared mostly for undergraduate level and clustered into two or three factors. Because of the results of the mentioned studies, it was predicted that the the scale developed in this study might have eight factors or at least two factors. Hovewer, the scale came out having only one factor including items that have some of the important attributes of the theories of motivation. Intrinsic motivation and exstrinsic motivation are not differentiated from each other in this scale. Thus, it does not give an idea of whether students’ motivation in mathematics is intrinsic or exstrinsic, but instead measures
  • 10.
    European Scientific JournalJune 2015 edition vol.11, No.16 ISSN: 1857 – 7881 (Print) e - ISSN 1857- 7431 46 students’ motivations towards mathematics by one factor. When examining the scale in respect to the factor and the total score it can be said that the scale discriminates the groups, which were distinctively different from each other. In this sense, the scale can be used for the purpose of general surveying and determination of motivation of mathematics in general. Finally, the results of the study indicate that the scale determines the students’ motivation towards learning mathematics. It can measure motivation of students for learning mathematics by a single construct. By reversing negatively worded items (items of 3, 5, 9, 11) and scoring the scale, acquiring higher scores (total score) indicates more positive motivation and acquiring lower scores indicates more negative motivation among primary school students towards learning mathematics. According to the results of the PSMMS’s validity and reliability study, it can be claimed that the scale is ready, reliable and valid to determine motivation of primary school students towards learning mathematics. It is suggested to repeat validty and reliability studies on groups of different students and to analyze the scale through confirmatory factor analysis (CFA). Moreover, Aktan and Tezci’s (2013) adaptative version of one of the sub-dimensions of MSLQ, Motivational Strategies Scale, into mathematics as “Mathematics Motivation Scale”(MMS) to determine students’ use of motivational strategies in mathematics courses is suggested to be used in the same groups for criterion validity. References: Allen, D. (1999). Desire to finish college: An empirical link between motivation and persistence. Research in Higher Education, 40(4), 461-485. Asık, G. (2006). Ogrencilerin Problem Cozmede Bilisustu ve Motivasyona İliskin Denetimleri ile Bilisustu Deneyimleri Arasındaki İliskiyi Acıklayıcı Bir Model Calısması.Yayımlanmıs Yuksek Lisans Tezi, Bogazici Universitesi, Ortaogretim Fen ve Matematik Egitimi, İstanbul. Aktan, S. (2013). Ogrencileri Akademik Basarısı, Oz Duzenleme Becerisi, Motivasyonu ve Ogretmenlerin ogretim Stilleri Arasındaki İliski.Yayımlanmıs Doktora Tezi, Balıkesir Universitesi Sosyal Bilimler Enstitusu, Balıkesir. Aktan, S. & Tezci, E. (2013).Matematik Motivasyon Olcegi (MMO) Gecerlik ve Guvenirlik Calısması. The Journal of Academic Social Science Studies International Journal of Social Science Vol. 6 Issue 4, p. 57-77. Balaban, S. J. (2002). Bilgisayar destekli ogretimde gudulenme kaynagı ve yetkinlik duzeyinin ogrenci basarı ve tutumları uzerindeki etkisi. Yayımlanmıs Doktora Tezi, Anadolu Universitesi Sosyal Bilimler Enstitusu, Eskisehir. Balcı, A. (2005). Sosyal Bilimlerde Arastırma.Ankara: PegemA Yayıncılık.
  • 11.
    European Scientific JournalJune 2015 edition vol.11, No.16 ISSN: 1857 – 7881 (Print) e - ISSN 1857- 7431 47 Baser, M. (2007). The contribution of learning motivation, reasoning ability and learning orientation to ninth grade international baccalaureate and national program students’ understanding of mitosis and meiosis. Master’s Thesis, Middle East Technical University, Ankara, Turkey. Brophy, J. (1988). Educating teachers about managing classrooms and students Teaching and Teacher Education, 4 (1), 1-18 Buyukozturk, S. (2005). Sosyal Bilimler İcin Veri Analizi El Kitabı. Ankara: Pegema Yayıncılık. Buyukozturk, S.; Akgun, O.E.; Ozkahveci, O. ve Demirel, F. (2004). Gudulenme ve Ogrenme Stratejileri Olceginin Turkce Formunun Gecerlik ve Guvenirlik Calısması. Kuram ve Uygulamada Egitim Bilimleri / Educational Sciences: Theory & Practice, 4(2) Kasım/November 2004. s. 207-239. Buyukozturk, S.. (2007). Deneysel desenler: Ontest-sontest kontrol gruplu desen ve SPSS uygulamalı veri analizi. Deneysel desenler, ontest-sontest kontrol gruplu desen ve verielrin analizinde kullanılan alternatif istatistikler Turkiye. Pegem. Christophel, D. M. (1990). The relationship among teacher immediacy behaviors student motivation and learning. Communication Education, 39, 323–350. Dede, Y. & Yaman, S. (2006). Fen Ogrenmeye Yonelik Motivasyon Olcegi: Gecerlik ve Guvenirlik Calısması. Necatibey Egitim Fakultesi Elektronik Fen ve Matematik Egitimi Dergisi (EFMED) 2(1), 19-37 Dede, Y. (2003). Arcs Motivasyon Modeli’nin Ogrencilerin Matematige Yonelik Motivasyonlarına Etkisi. Pamukkale Universitesi Egitim Fakultesi Dergisi, 2 (14), 173-182. Dede, Y. & Argun Z. (2004). Ogrencilerin Matematige yonelik İcsel ve Dıssal Motivasyonlarının Belirlenmesi. Egitim ve bilim Dergisi, 29 (134), 49-54. Doğan, B. (2012). Grup etkinlikleri ile matematik ogretiminin matematik basarısına ve matematige yonelik tutuma etkisi .Yayımlanmamıs Yuksek Lisans Tezi,Yeditepe Universitesi, İstanbul Eric Zhi Feng Liu, E.Z.F., Lin, C.H., (2010). The Survey Study Of Mathematics Motivated Strategies For Learning Questionnaire (MMSLQ) For Grade 10–12 Taiwanese Studentstojet: The Turkish Online Journal of Educational Technology, vol.9 Issue 2 Fennema, E., & Sherman, J. A. (1976). Fennema-Sherman mathematics attitudes scales; instruments desinged to measure attitudes towards the learning of mathematics by females and males. Catalog of Selected Documents in Psychology, 6(1), 31. Fogarty, G., Cretchley, P., Harman, C., Ellerton, N., & Konki, N. (2001). Validation of a questionnaire to measure mathematics confidence, computer
  • 12.
    European Scientific JournalJune 2015 edition vol.11, No.16 ISSN: 1857 – 7881 (Print) e - ISSN 1857- 7431 48 confidence and attitudes towards technology for learning mathematics. Mathematics Education Research Journal, 13(2), 154-159. Galbraith, P., & Haines, C. (2000). Mathematics-Computing Attitude Scales. Monographs in Continuing Education London: City University. Gardner, R. C. (1985a). Social psychology and second language learning: The role of attitudes and motivation. London: Edward Arnold Publishers Gomleksiz, N.,M.& Kan, U.A.(2012) Sosyal Bilgiler Dersi Motivasyon Olceginin Gecerlik ve Guvenirlik Calısması. Fırat Universitesi Sosyal Bilimler Dergisi .22( 2),116-125 Keller, J. M. (1987a). Development and use of the ARCS model of motivational design. Journal of Instructional Development, 10(3), 2-10 Keller, J. M. (1987b). IMMS: Instructional materials motivation survey. Tallahassee, Florida: Florida State University. Kutu, H. & Sozbilir M. (2011). Ogretim Materyalleri Motivasyon anketinin Turkce’ye Uyarlanması: Gecerlik ve Guvenirlik Calısması. Necatibey egitim Fekultesi Elektronik Fen ve Matematik Egitimi Dergisi, 5(1), 292-312 Nicholls, J. G.,Cobb, P.,Wood.,T.,Yackel,,E.,Patashnick.,M.(1990). Assessing Students' Theories of Success in Mathematics Individual and Classroom Differences.Journal for Research in Mathematics Education ,21,109-122. Pierce, R., Stacey, K., and Barkatsas. A. (2007) A scale for monitoring students' attitudes to learning mathematics with technology. Computers & Education. Vol 48 (2). 285-300 Pintrich, P. R., & Schunk, D. H. (2002). Motivation in education: Theory, research, and applications (2nd ed.). Upper Saddle River, NJ: PrenticeHall. Pintrich, P.R., ve De Groot, E. (1990). Motivational and self regulated learning components of classroom academic performance. Journal of Educational Psychology, 82(1), 33-40. Pintrich, P.R.,Smith,D.A.F., Garcia, T. ve McKeachie,W.J. (1991A Manual for the Use of the Motivated Strategies for Learning Questionaire (MSLQ). National Center for Research to Improve Postsecondary Teaching and Learning. Ann Arbor: Michigan. ED 338 122. Schiefele, U., & Rheinberg, F. (1997). Motivation and knowledge acquisition: Searching for mediating processes. In P. R. Pintrich, & L. Maehr, Advances in motivation and achievement (pp. 251–301). Greenwich, CT: JAI Press. Shia, R. (1998). Academic Intrinsic And Extrinsic Motivation And Metacognition. Assessing Academic Intrinsic Motivation: A Look At Student. Goals And Personal Strategy. < http://www.cet.edu/pdf/motivation.pdf>, (11 February, 2014) Tapia, M., & Marsh II, G. (2004). An instrument to measure mathematics attitudes. Academic Exchange Quarterly. 8 (2), 1-8.
  • 13.
    European Scientific JournalJune 2015 edition vol.11, No.16 ISSN: 1857 – 7881 (Print) e - ISSN 1857- 7431 49 Tuan, H. L. Chin, C.C & Shieh, S. H. (2005). The development of a questionnaire to measure students’ motivation towards science learning. International Journal of Science Education, 27(6), 639- 654. Umay, A. (2002). Matematik Ogretmen Adaylarının Basarı Gudusu Duzeyleri, DegiĢimi Ve Degisimi Etkileyen Faktorler. Hacettepe Universitesi Egitim Fakultesi Dergisi. 22: 148-155 Uredi, I. (2005). Algılanan anne baba tutumlarının ilkogretim 8. sınıf ogrencilerinin oz-duzenleyici ogrenme stratejileri ve motivasyonel inancları uzerindeki etkisi. Yayınlanmamıs doktora tezi, Yıldız Teknik Universitesi, İstanbul. Yavuz, G.,Ozyıldırım F.,Dogan N.(2012). Mathematics Motivation Scale: A Validity and Reliability. Procedia - Social and Behavioral Sciences. Vol 46,(2012) 1633–1638 Wigfield, A. (1994). Expectancy-value theory of achievement motivation: A developmental perspective. Educational Psychology Review, 6, 49–78. Primary School Mathematics Motivation Scale(PSMMS) I agree I slightly agree I disagree 1. Mathematics is an easy subject for me 2. I would like to raise my hand in mathematics class 3. I get bored in mathematics class 4. Topics in mathematics are interesting for me. 5. I get annoyed in mathematics class 6. I would like to participate in activites in mathematics class 7. Mathematics exams are easy for me 8. I like mathematics class 9. Mathematics is a difficult subject for me 10. I listen to mathematics subject carefully. 11. I am afraid of solving mathematics problems thinking that I can’t do 12. I repeat the topics I learned in mathematics class 13. I am happy when I am successful in mathematics class 14. I think that mathematics improves my intelligence 15. I would like to know how mathematical topics arose. 16. I think that what I am learning in mathematics is necessary for my future 17. I feel more confident when I succeed in mathematics. 18. I can use the things that I learned in mathematics in daily life. 19. I am good at in skills of making prediction in mathematics subject. 20. I can explain the things that I learned in my own words in mathematics subject.
  • 14.
    European Scientific JournalJune 2015 edition vol.11, No.16 ISSN: 1857 – 7881 (Print) e - ISSN 1857- 7431 50 21. I repeat the topics that I didn’t understand in mathematics subject. 22. I ask teacher about the topics that I couldn’t understand in mathematics class. 23. I study mathematics because I think what I've learned is necessary for me. 24. I can explain reasons of the use of procedures while solving mathematics problems. Primary School Mathematics Motivation Scale(PSMMS) I agree I slightly agree I disagree 25. I become more willing to learn new topics while learning current topics in mathematics subject 26. I am aware of the benefits from what I’ve learned in mathematics subject. 27. I am curious about what I would learn in new topics in mathematics lesson. 28. I like finding more than one solutions to mathematics problems. 29. I can build up a connection between mathematical topics and topics in other subjects. 30. When I get stuck in a topic in mathematics I investigate that topic from different resources. 31. I think that what I am learning is necessary to learn new topics in mathematics. 32. I can express the things that I learned in mathematics through different ways (drawings, figures, tables etc.) 33. I can build up a connection between my current learnings and previous learnings in mathematics.