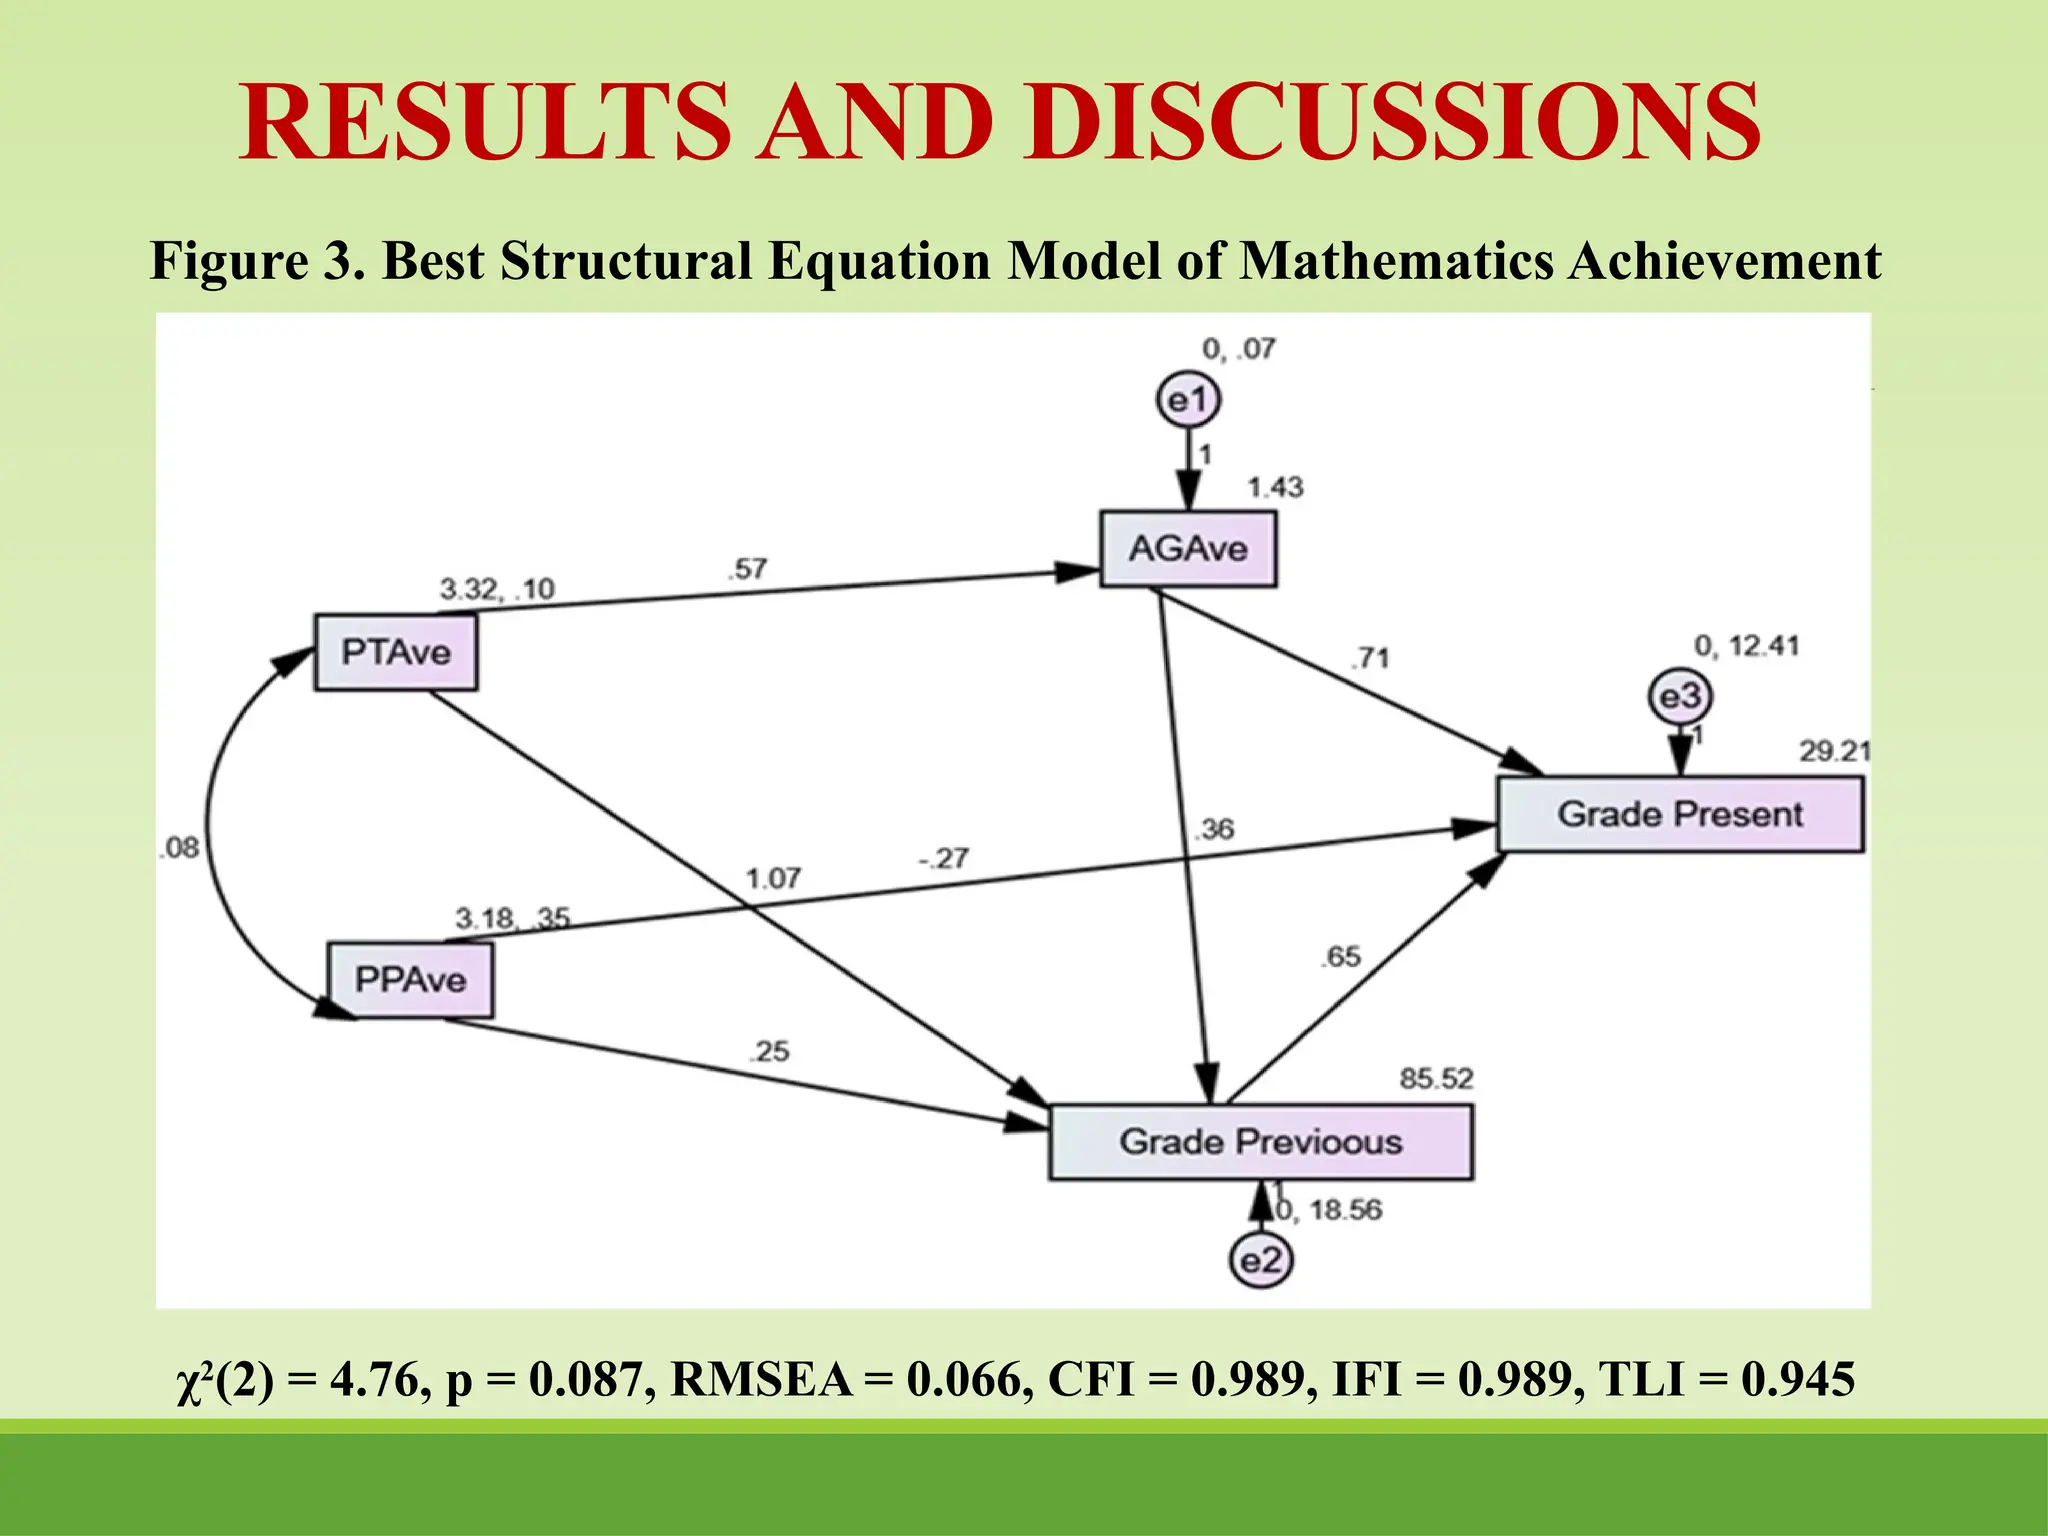
FINAL DEFENSE
WYNTEE MAY D VELASCO-CRUZ
MST-MATHEMATICS
MOTIVATIONAL LEARNING FACTORS AND MATHEMATICS
ACHIEVEMENT AMONG THE STEM-STRAND STUDENTS
OF THE DIVISION OF NUEVA VIZCAYA THROUGH
STRUCTURAL EQUATION MODELING
The Problem and Its Background
• Implementation of RA 10533 known as the
Enhanced Basic Education Curriculum
• The Importance of Mathematics as a
subject.
• Data on Mathematics Achievement
• Factors that affect Mathematics
achievement
Implementation of RA 10533 known as the
Enhanced Basic Education Curriculum
• Students are required 13 years of their
lives to stay in the school.
• 7 years in the Elementary Level
(Kindergarten to Grade 6).
• 6 years in the High School (4 years for the
Junior High School and 2 years for the
Senior High School)
• How to keep the learners motivated to
attend their classes for that long?
The Importance of Mathematics as a subject
• Provide opportunities for individuals to
develop skills and attitudes needed for
effective participation in everyday living
and prepare them for further education
and the world of work so that they make
worthwhile contributions to the society at
large (Pascua, 1993).
• Mathematics instruction has become a
basic need in all levels of education
• As teachers, how do we improve the
teaching-learning process to achieve
this goal?
Data on Mathematics Achievement
• Philippines ranked 58th
among the
participating countries based from TIMSS
ranked 2nd
lowest both in Mathematics
and scientific assessment in PISA 2018
( Mendoza, 2020);
• In the NAT, MPS in Math for Region 2 is
44.7, Division of Nueva Vizcaya is 42.27
while 47.8 for the 16 regions;
• How can we improve the Mathematics
Achievement in the National
Achievement Test (NAT)?
Factors that affect Mathematics Achievement
• Student-related and teacher-
related factors (Lubina, 2006; Del
Castillo (2010); Balbosa, 2010;
Yara, 2011);
• Environment factors and
psychological factors within the
learners like motivation (Kumar &
Karimi, 2010).
Factors that affect Mathematics Achievement
• According to Auwalu Shuaibu Muhammed,
et. al., 2014, it revealed that students’
academic performance is having a positive
relationship with their motivation in
learning.
• Acccording to Yazici and Altun (2013), the
importance of motivational sources may
decrease or increase according to the sample
group.
• How do these factors affect the
learning process and what is its effect
in the mathematics achievement?
Statement of the Problem
To address the goal of the Department of
Education K to 12 program that is, to strive
for excellence in mathematics, this study
aimed to determine a mathematical model
showing the interrelationships of the profile of
students, motivational learning factors that
determines mathematics achievement.
Objectives of the Study
This study aimed to determine the
mathematical model that will show interrelationships
of the students’ profile and motivational learning
factors to mathematics achievement.
Specifically, it sought to determine the
following:
1. To determine the demographic profile of the
learners in terms of the following:
a. Sex
b. Grade Level
c. Grade Point Average (GPA-previous grade).
Objectives of the Study
3. To determine the level of motivational learning
factors to students in terms of:
a. Achievement Goal
i. Mastery Goal
ii. Performance-Approach Goal
iii. Performance-Avoid Goal
b. Perception of Teachers
i. Teacher Mastery
ii. Teacher Performance-Approach
c. Perception of Parents
i. Parent Mastery
ii. Parent Performance
2. To determine the grade point average (GPA-present
grade) and the level of mathematics achievement of
the students,
Objectives of the Study
4. To determine the structural equation model that
reflects the interrelationships of student’s profile and
motivational learning factors to mathematics
achievement.
Scope and Limitation
The study focused primarily on the
motivational learning factors that affects students’
mathematics achievement in the mathematics
classroom. The motivational learning factors are
limited to the following namely; (a) Perception of
Teachers with aspects namely: Teachers’ Mastery and
Teachers’ Performance-Approach, (b) Perception of
Parents with aspects namely: Parents’ Mastery and
Parents’ Performance (c) Achievement Goal with
aspects namely: Mastery Goal, Performance-
Approach and Performance-Avoid Goal.
Scope and Limitation
The study will only include the senior high
school students enrolled in STEM-Strand from the
public schools under the Department of Education in
the Schools Division of Nueva Vizcaya. Deletion of
some indicators in the motivational learning factors
through factor loading was not realized by
Confirmatory Factor Analysis (CFA) since all the
items were considered good items as CFA was
applied. In addition, the questionnaire on
motivational learning factors is an adopted
questionnaire, thus all indicators of the learning
factors had been used in data analysis.
Conceptual Framework
Figure 1. Hypothetical Path Model
Research Design
This study utilized the descriptive and
exploratory designs of research. The descriptive type
of research was used to describe the student’s profile
and the level of mathematics achievement and the
level of motivational learning factors of the students.
The study explored the best mathematical model that
show interrelationships among student’s profile and
motivational learning factors that determines
mathematics achievement of senior students from the
STEM strand.
Time and Place of the Study
The study was conducted at the Public Senior
High Schools under the Department of Education in
the Schools Division of Nueva Vizcaya offering the
Science, Technology, Engineering and Mathematics
(STEM) Strand during the second semester of school
year 2018-2019. The Schools Division of Nueva
Vizcaya have 45 public high schools and of which 8
schools are offering STEM strand namely: Aritao
High School, Bambang High School, Diadi National
High School, Dupax del Norte National High School,
Nueva Vizcaya General Comprehensive High School,
Pinkian National High School, Runruno National High
School, and Solano High School.
Figure 2. Map of Nueva Vizcaya
Respondents of the Study
The respondents of the study were the grade 11
and 12 students from the identified public senior
high schools of the Schools Division of Nueva Vizcaya
enrolled in the STEM Strand during the second
semester of School Year 2018-2019. There were 34
students from Aritao High School, 75 students
Bambang High School, 28 students from Diadi
National High School, 20 students from Dupax del
Norte National High School, 102 students from Nueva
Vizcaya General Comprehensive High School, 20
students from Pinkian National High School,
23 students from Runruno National High School, and
48 students from Solano High School.
Respondents of the Study
However, only 330 students responded and
returned the fully answered questionnaire which were
used for further analysis. According to Wolf,
Harrington, Clark, and Miller (2013), the range of
sample size requirements for structural equation
modeling ranges from 30 to 460 cases. Thus, in this
study, 330 students was considered for data analysis.
Research Instrument
The respondents answered a questionnaire that
comprised of two parts. The first part was used to
determine students’ demographic profile (sex and
grade level, and previous and present grade point
average) while the second part was a questionnaire
on the Patterns of Adaptive Learning on the perceived
level of achievement goal, perception to teachers and
perception to parents. The questionnaire was
adopted from the Manual for the Patterns of Adaptive
Learning Scales (PALS revised) (Midgely, Maehr,
Hruda, Anderman, Andermanm, Freeman, Gheen et
al., 2000) with three identified motivational learning
factors.
Research Instrument
The first motivational learning factor is the
achievement goal comprised of three (3) aspects
which are Mastery Goal with five (5) items,
Performance-Approach goal with five (5) items and
Performance-Avoid goal with 4 items with Cronbach
Alpha of 0.85,.089 &0.74 respectively. The second
motivational learning factor is the Perception of
Teacher’s Goal with two (2) aspects which are
Teacher Mastery, 5 items and Teacher Performance-
Approach with 7 items with Cronbach Alpha of 0.83,
and 0.79 respectively.
The last motivational learning factor is the
Perceptions of Parents with 2 aspects which are
the Parent Mastery with 6 items and Parent
Performance with 5 items with Cronbach Alpha
0.71 for each aspect. Students was asked to rate
the following statement on a four-point Likert
scale (ranging from 1 as “strongly disagree’ to 4 as
“Strongly agree”). The 37 items were randomly
spread throughout the questionnaire, to avoid the
formation of possible reaction patterns. The said
questionnaire underwent expert validation for the
content of behavioral aspect by the expert
psychologists of the Nueva Vizcaya State
University identified by the panel.
Research Instrument
The grade point average (GPA-present) in
Mathematics of the participants was used to
represent their mathematics achievement and was
taken from their permanent school record (School
Form 10).
Research Instrument
Data Gathering Procedure
The process of data collection took place at the public
Senior High Schools of the Division of Nueva Vizcaya offering
Science, Technology, Engineering and Mathematics (STEM) Strand
namely Aritao High School, Bambang High School, Diadi National
High School, Dupax del Norte National High School, Nueva Vizcaya
General Comprehensive High School, Pinkian National High
School, Runruno National High School, and Solano High School.
A permit to conduct the research was secured from the
Office of the Superintendent of the Division and a letter to the
respective School Principals of the identified schools was endorsed
to gather data from their Grade 11 and 12 students which also
included their permit to access to their permanent records (SF 10)
for their grade point average (GPA).
Questionnaires that were the main tool of data collection
were distributed to the respondents by the researcher with the help
of their Mathematics teachers. A structured questionnaire was
distributed to a large number of male and female students
Statistical Tools & Treatment of Data
Descriptive statistics were used to
describe the demographic profile of the
participants and perceived level of the students
with regards to the identified motivational
learning factors. For the level of mathematics
achievement, the grade point average (GPA) of
the students will be described using the
descriptive scale as mention in Deped Order No.
8, s. 2015. Table 1 shows the qualitative
description of the grade point average of
students. The description will be as follows:
Statistical Tools & Treatment of Data
DESCRIPTION GRADE SCALE REMARKS
Outstanding 90-100 Passed
Very Satisfactory 85-89 Passed
Satisfactory 80-84 Passed
Fairly Satisfactory 75-79 Passed
Did not meet Expectations
Below 75 Failed
Table 1. Qualitative Descriptions of Grades of Students
Statistical Tools & Treatment of Data
Table 2. Qualitative Descriptions of Motivational Learning Factors
Weight Mean Range Description
4 3.51-4.50 Highly Motivated
3 2.51-3.50 Moderately Motivated
2 1.51-2.50 Fairly Motivated
1 1.00-1.50 Not Motivate
Statistical Tools & Treatment of Data
To describe the mathematical model that show
interrelationships among student’s profile and
motivational learning factors to the mathematics
achievement of students, Structural Equation
Modelling was employed (SEM) using Analysis of
Moment Structures (AMOS). SEM illustrates related
procedures in testing the interrelatedness of
observed statistics and unobserved variables.
Statistical Tools & Treatment of Data
Carlbäck & Wong (2018) stressed that chi-square
is one of the most reported absolute indices in
structural equation modeling. It explains the effect of
the numbers of variables considered in a study
wherein if more variables a model possesses, the
more likely the model will produce a higher chi-
square value. Several researchers have
recommended the range between 2.0 to 5.0 as a
general rule of thumb for acceptance of model fit
since there was a lack of universally agreed upon
standard regarding the value of an acceptable ratio.
Schermelleh-Engel & Moosbrugger (2003) stated
that the model is in good fit if p-value is greater
than 0.05 but less than or equal to 1.
Statistical Tools & Treatment of Data
Table 3. Indices of Good Fit models
Index Good Fit
x2/
df 2<x2/
df<5
p-value 0.05<p≤1
AGFI 0.90<AGFI<1
RMSEA 0.10<RMSEA<1
CFI 0.9<CFI<1
IFI 0.95<IFI<1
TLI 0.85<AGFI<0.95
GFI 0.95<GFI<1
A. Demographic Profile of the students in
terms of sex, grade level and grade in
the previous mathematics subject.
RESULTS AND DISCUSSIONS
Table 4. Distribution of the respondents
based on sex and grade level
Sex Frequency Percent
Male 153 46.4
Female 177 53.6
Total 330 100
Grade Level
Grade 11 236 71.5
Grade 12 94 28.5
Total 330 100
RESULTS AND DISCUSSIONS
Table 5. Distribution of Grade Point Average (Previous)
according to sex and grade level of respondents
Sex Mean
Percentage
Qualitative
Description
Male 91.13 Outstanding
Female 91.02 Outstanding
Grade Level
Grade 11 91.11 Outstanding
Grade 12 90.96 Outstanding
OVERALL MEAN 91.07 Outstanding
B. Distribution of Grade Point Average
(Present) in Mathematics according to
sex and grade level.
RESULTS AND DISCUSSIONS
Table 6. Grade Point Average (Present) in
mathematics as distributed based on sex and
grade level.
Sex Mean
Percentage
Qualitative
Description
Male 90.18 Outstanding
Female 90.50 Outstanding
Grade Level
Grade 11 90.22 Outstanding
Grade 12 90.66 Outstanding
OVERALL
MEAN
90.35 Outstanding
RESULTS AND DISCUSSIONS
C. Level of Motivational Factors towards
students mathematics achievement
RESULTS AND DISCUSSIONS
Table 7. Level of Motivational Learning Factors of the Respondents
Motivational Learning
Factor
Mean Standard
Deviation
Descriptive
Achievement Goal
Mastery Goal 3.63 .36634 Highly Motivated
Performance Approach Goal 3.15 .47862 Moderately Motivated
Performance Avoid Goal 3.17 .47580 Moderately Motivated
Overall Mean 3.32 Moderately Motivated
Perception of Teachers
Teacher Mastery 3.52 .41557 Highly Motivated
Teacher Performance
approach
3.18 .37867 Moderately Motivated
Overall Mean 3.35 Moderately Motivated
Perception of Parents
Parent Mastery 3.35 .88905 Moderately Motivated
Parent Performance 2.96 .59335 Moderately Motivated
Overall Mean 3.16 Moderately Motivated
RESULTS AND DISCUSSIONS
D. Optimal Structural Equation Model that reflects
the interrelationships of profile variables and
motivational learning factors to the academic
achievement of students.
RESULTS AND DISCUSSIONS
χ2
(2) = 4.76, p = 0.087, RMSEA = 0.066, CFI = 0.989, IFI = 0.989, TLI = 0.945
Figure 3. Best Structural Equation Model of Mathematics Achievement
SUMMARY, CONCLUSIONS AND
RECOMMENDATIONS
Summary
During the analysis of the study, the researcher tested a
structural equation model using SPSS and AMOS to explain the
motivational learning factor and mathematics achievement of the
STEM students of the Division of Nueva Vizcaya. Taking into
support on the model was investigated. The mathematical
achievement was examined based on the different motivational
learning factor such as the academic goal (AG Ave), perception of
the teachers (PT Ave) and the perception of the parent (PP Ave).
While testing the model, the AGAve and the grade previous had
explained a direct effect towards the mathematical achievement of
which the grade present. While the mathematical achievement of
the students showed a significant positive relationship. Moreover,
the perception of the teachers showed a significant relationship
towards grade previous and academic goal. However, perception
of the parents indicates a negative significant relationship. This
means that as one variable increases such as the perception of
parents increases, the grade present will decrease and vice versa.
Summary
In this study, the researcher investigated
grade previous, academic goal, perception of
teacher and perception of parents as main factors
that influence the motivational learning of the
students in their performance to learn
mathematics. Basing on the identified hypothesis
of this study was accepted and this finding was
consistent with previous researchers as stated in
this study. Students’ mathematical achievement
is captured based on the intrinsic motivational
learning factors based on their achieved academic
goal, perception of teachers in learning the subject
mathematics.
SUMMARY, CONCLUSIONS AND
RECOMMENDATIONS
CONCLUSIONS
Based on the significant findings of the study, the following
conclusions were drawn:
1. Grade 11 and 12 STEM students in the Department of
Education, Division of Nueva Vizcaya exhibited an outstanding
grades in mathematics during their previous semester and
present semester.
2. Grade 11 and 12 STEM students in the Department of
Education, Division of Nueva Vizcaya perceived that they are
moderately motivated to learn mathematics in terms of their
achievement goal, and support from their teachers and parents.
3. The structural equation model of mathematics achievement
includes the positive and indirect causal relationship of
motivation received by students from teachers and parents as
mediated by achievement goals of students as well as the first
semester grade, respectively however the direct causal effect of
the motivation from parents have a negative effect to the
mathematics achievement of students.
SUMMARY, CONCLUSIONS AND
RECOMMENDATIONS
SUMMARY, CONCLUSIONS AND
RECOMMENDATIONS
Recommendations
Based on the drawn conclusions, the following suggestive recommendations
must be considered as follows:
1. The study showed a significant performance of students in mathematics. This
further recommends monitoring and evaluating the best practices of the teachers
in teaching mathematics as well as the continuous upgrade of their professional
development.
2. This study further suggests that teachers may enhance their knowledge in the
field of motivation strategies in mathematics through attendance to seminars to
become more affective in developing greater interest of students to learn
mathematics.
3. School officials may device programs and projects that may help improve the role
of the parents in the delivery of learning in mathematics. It also further
recommends to conduct need analysis to determine the specific intervention that
can address the factor leading to the mathematical achievement of the students.
4. For future researchers, further studies may be conducted in terms of other
motivational learning factors that may affect the mathematics achievement of
students
THANK YOU

thesis defense focusing on the context of senior high school

  • 1.
    FINAL DEFENSE WYNTEE MAYD VELASCO-CRUZ MST-MATHEMATICS
  • 2.
    MOTIVATIONAL LEARNING FACTORSAND MATHEMATICS ACHIEVEMENT AMONG THE STEM-STRAND STUDENTS OF THE DIVISION OF NUEVA VIZCAYA THROUGH STRUCTURAL EQUATION MODELING
  • 3.
    The Problem andIts Background • Implementation of RA 10533 known as the Enhanced Basic Education Curriculum • The Importance of Mathematics as a subject. • Data on Mathematics Achievement • Factors that affect Mathematics achievement
  • 4.
    Implementation of RA10533 known as the Enhanced Basic Education Curriculum • Students are required 13 years of their lives to stay in the school. • 7 years in the Elementary Level (Kindergarten to Grade 6). • 6 years in the High School (4 years for the Junior High School and 2 years for the Senior High School) • How to keep the learners motivated to attend their classes for that long?
  • 5.
    The Importance ofMathematics as a subject • Provide opportunities for individuals to develop skills and attitudes needed for effective participation in everyday living and prepare them for further education and the world of work so that they make worthwhile contributions to the society at large (Pascua, 1993). • Mathematics instruction has become a basic need in all levels of education • As teachers, how do we improve the teaching-learning process to achieve this goal?
  • 6.
    Data on MathematicsAchievement • Philippines ranked 58th among the participating countries based from TIMSS ranked 2nd lowest both in Mathematics and scientific assessment in PISA 2018 ( Mendoza, 2020); • In the NAT, MPS in Math for Region 2 is 44.7, Division of Nueva Vizcaya is 42.27 while 47.8 for the 16 regions; • How can we improve the Mathematics Achievement in the National Achievement Test (NAT)?
  • 7.
    Factors that affectMathematics Achievement • Student-related and teacher- related factors (Lubina, 2006; Del Castillo (2010); Balbosa, 2010; Yara, 2011); • Environment factors and psychological factors within the learners like motivation (Kumar & Karimi, 2010).
  • 8.
    Factors that affectMathematics Achievement • According to Auwalu Shuaibu Muhammed, et. al., 2014, it revealed that students’ academic performance is having a positive relationship with their motivation in learning. • Acccording to Yazici and Altun (2013), the importance of motivational sources may decrease or increase according to the sample group. • How do these factors affect the learning process and what is its effect in the mathematics achievement?
  • 9.
    Statement of theProblem To address the goal of the Department of Education K to 12 program that is, to strive for excellence in mathematics, this study aimed to determine a mathematical model showing the interrelationships of the profile of students, motivational learning factors that determines mathematics achievement.
  • 10.
    Objectives of theStudy This study aimed to determine the mathematical model that will show interrelationships of the students’ profile and motivational learning factors to mathematics achievement. Specifically, it sought to determine the following: 1. To determine the demographic profile of the learners in terms of the following: a. Sex b. Grade Level c. Grade Point Average (GPA-previous grade).
  • 11.
    Objectives of theStudy 3. To determine the level of motivational learning factors to students in terms of: a. Achievement Goal i. Mastery Goal ii. Performance-Approach Goal iii. Performance-Avoid Goal b. Perception of Teachers i. Teacher Mastery ii. Teacher Performance-Approach c. Perception of Parents i. Parent Mastery ii. Parent Performance 2. To determine the grade point average (GPA-present grade) and the level of mathematics achievement of the students,
  • 12.
    Objectives of theStudy 4. To determine the structural equation model that reflects the interrelationships of student’s profile and motivational learning factors to mathematics achievement.
  • 13.
    Scope and Limitation Thestudy focused primarily on the motivational learning factors that affects students’ mathematics achievement in the mathematics classroom. The motivational learning factors are limited to the following namely; (a) Perception of Teachers with aspects namely: Teachers’ Mastery and Teachers’ Performance-Approach, (b) Perception of Parents with aspects namely: Parents’ Mastery and Parents’ Performance (c) Achievement Goal with aspects namely: Mastery Goal, Performance- Approach and Performance-Avoid Goal.
  • 14.
    Scope and Limitation Thestudy will only include the senior high school students enrolled in STEM-Strand from the public schools under the Department of Education in the Schools Division of Nueva Vizcaya. Deletion of some indicators in the motivational learning factors through factor loading was not realized by Confirmatory Factor Analysis (CFA) since all the items were considered good items as CFA was applied. In addition, the questionnaire on motivational learning factors is an adopted questionnaire, thus all indicators of the learning factors had been used in data analysis.
  • 15.
    Conceptual Framework Figure 1.Hypothetical Path Model
  • 16.
    Research Design This studyutilized the descriptive and exploratory designs of research. The descriptive type of research was used to describe the student’s profile and the level of mathematics achievement and the level of motivational learning factors of the students. The study explored the best mathematical model that show interrelationships among student’s profile and motivational learning factors that determines mathematics achievement of senior students from the STEM strand.
  • 17.
    Time and Placeof the Study The study was conducted at the Public Senior High Schools under the Department of Education in the Schools Division of Nueva Vizcaya offering the Science, Technology, Engineering and Mathematics (STEM) Strand during the second semester of school year 2018-2019. The Schools Division of Nueva Vizcaya have 45 public high schools and of which 8 schools are offering STEM strand namely: Aritao High School, Bambang High School, Diadi National High School, Dupax del Norte National High School, Nueva Vizcaya General Comprehensive High School, Pinkian National High School, Runruno National High School, and Solano High School.
  • 18.
    Figure 2. Mapof Nueva Vizcaya
  • 19.
    Respondents of theStudy The respondents of the study were the grade 11 and 12 students from the identified public senior high schools of the Schools Division of Nueva Vizcaya enrolled in the STEM Strand during the second semester of School Year 2018-2019. There were 34 students from Aritao High School, 75 students Bambang High School, 28 students from Diadi National High School, 20 students from Dupax del Norte National High School, 102 students from Nueva Vizcaya General Comprehensive High School, 20 students from Pinkian National High School, 23 students from Runruno National High School, and 48 students from Solano High School.
  • 20.
    Respondents of theStudy However, only 330 students responded and returned the fully answered questionnaire which were used for further analysis. According to Wolf, Harrington, Clark, and Miller (2013), the range of sample size requirements for structural equation modeling ranges from 30 to 460 cases. Thus, in this study, 330 students was considered for data analysis.
  • 21.
    Research Instrument The respondentsanswered a questionnaire that comprised of two parts. The first part was used to determine students’ demographic profile (sex and grade level, and previous and present grade point average) while the second part was a questionnaire on the Patterns of Adaptive Learning on the perceived level of achievement goal, perception to teachers and perception to parents. The questionnaire was adopted from the Manual for the Patterns of Adaptive Learning Scales (PALS revised) (Midgely, Maehr, Hruda, Anderman, Andermanm, Freeman, Gheen et al., 2000) with three identified motivational learning factors.
  • 22.
    Research Instrument The firstmotivational learning factor is the achievement goal comprised of three (3) aspects which are Mastery Goal with five (5) items, Performance-Approach goal with five (5) items and Performance-Avoid goal with 4 items with Cronbach Alpha of 0.85,.089 &0.74 respectively. The second motivational learning factor is the Perception of Teacher’s Goal with two (2) aspects which are Teacher Mastery, 5 items and Teacher Performance- Approach with 7 items with Cronbach Alpha of 0.83, and 0.79 respectively.
  • 23.
    The last motivationallearning factor is the Perceptions of Parents with 2 aspects which are the Parent Mastery with 6 items and Parent Performance with 5 items with Cronbach Alpha 0.71 for each aspect. Students was asked to rate the following statement on a four-point Likert scale (ranging from 1 as “strongly disagree’ to 4 as “Strongly agree”). The 37 items were randomly spread throughout the questionnaire, to avoid the formation of possible reaction patterns. The said questionnaire underwent expert validation for the content of behavioral aspect by the expert psychologists of the Nueva Vizcaya State University identified by the panel. Research Instrument
  • 24.
    The grade pointaverage (GPA-present) in Mathematics of the participants was used to represent their mathematics achievement and was taken from their permanent school record (School Form 10). Research Instrument
  • 25.
    Data Gathering Procedure Theprocess of data collection took place at the public Senior High Schools of the Division of Nueva Vizcaya offering Science, Technology, Engineering and Mathematics (STEM) Strand namely Aritao High School, Bambang High School, Diadi National High School, Dupax del Norte National High School, Nueva Vizcaya General Comprehensive High School, Pinkian National High School, Runruno National High School, and Solano High School. A permit to conduct the research was secured from the Office of the Superintendent of the Division and a letter to the respective School Principals of the identified schools was endorsed to gather data from their Grade 11 and 12 students which also included their permit to access to their permanent records (SF 10) for their grade point average (GPA). Questionnaires that were the main tool of data collection were distributed to the respondents by the researcher with the help of their Mathematics teachers. A structured questionnaire was distributed to a large number of male and female students
  • 26.
    Statistical Tools &Treatment of Data Descriptive statistics were used to describe the demographic profile of the participants and perceived level of the students with regards to the identified motivational learning factors. For the level of mathematics achievement, the grade point average (GPA) of the students will be described using the descriptive scale as mention in Deped Order No. 8, s. 2015. Table 1 shows the qualitative description of the grade point average of students. The description will be as follows:
  • 27.
    Statistical Tools &Treatment of Data DESCRIPTION GRADE SCALE REMARKS Outstanding 90-100 Passed Very Satisfactory 85-89 Passed Satisfactory 80-84 Passed Fairly Satisfactory 75-79 Passed Did not meet Expectations Below 75 Failed Table 1. Qualitative Descriptions of Grades of Students
  • 28.
    Statistical Tools &Treatment of Data Table 2. Qualitative Descriptions of Motivational Learning Factors Weight Mean Range Description 4 3.51-4.50 Highly Motivated 3 2.51-3.50 Moderately Motivated 2 1.51-2.50 Fairly Motivated 1 1.00-1.50 Not Motivate
  • 29.
    Statistical Tools &Treatment of Data To describe the mathematical model that show interrelationships among student’s profile and motivational learning factors to the mathematics achievement of students, Structural Equation Modelling was employed (SEM) using Analysis of Moment Structures (AMOS). SEM illustrates related procedures in testing the interrelatedness of observed statistics and unobserved variables.
  • 30.
    Statistical Tools &Treatment of Data Carlbäck & Wong (2018) stressed that chi-square is one of the most reported absolute indices in structural equation modeling. It explains the effect of the numbers of variables considered in a study wherein if more variables a model possesses, the more likely the model will produce a higher chi- square value. Several researchers have recommended the range between 2.0 to 5.0 as a general rule of thumb for acceptance of model fit since there was a lack of universally agreed upon standard regarding the value of an acceptable ratio. Schermelleh-Engel & Moosbrugger (2003) stated that the model is in good fit if p-value is greater than 0.05 but less than or equal to 1.
  • 31.
    Statistical Tools &Treatment of Data Table 3. Indices of Good Fit models Index Good Fit x2/ df 2<x2/ df<5 p-value 0.05<p≤1 AGFI 0.90<AGFI<1 RMSEA 0.10<RMSEA<1 CFI 0.9<CFI<1 IFI 0.95<IFI<1 TLI 0.85<AGFI<0.95 GFI 0.95<GFI<1
  • 32.
    A. Demographic Profileof the students in terms of sex, grade level and grade in the previous mathematics subject. RESULTS AND DISCUSSIONS
  • 33.
    RESULTS AND DISCUSSIONS Table4. Distribution of the respondents based on sex and grade level Sex Frequency Percent Male 153 46.4 Female 177 53.6 Total 330 100 Grade Level Grade 11 236 71.5 Grade 12 94 28.5 Total 330 100
  • 34.
    RESULTS AND DISCUSSIONS Table5. Distribution of Grade Point Average (Previous) according to sex and grade level of respondents Sex Mean Percentage Qualitative Description Male 91.13 Outstanding Female 91.02 Outstanding Grade Level Grade 11 91.11 Outstanding Grade 12 90.96 Outstanding OVERALL MEAN 91.07 Outstanding
  • 35.
    B. Distribution ofGrade Point Average (Present) in Mathematics according to sex and grade level. RESULTS AND DISCUSSIONS
  • 36.
    RESULTS AND DISCUSSIONS Table6. Grade Point Average (Present) in mathematics as distributed based on sex and grade level. Sex Mean Percentage Qualitative Description Male 90.18 Outstanding Female 90.50 Outstanding Grade Level Grade 11 90.22 Outstanding Grade 12 90.66 Outstanding OVERALL MEAN 90.35 Outstanding
  • 37.
    RESULTS AND DISCUSSIONS C.Level of Motivational Factors towards students mathematics achievement
  • 38.
    RESULTS AND DISCUSSIONS Table7. Level of Motivational Learning Factors of the Respondents Motivational Learning Factor Mean Standard Deviation Descriptive Achievement Goal Mastery Goal 3.63 .36634 Highly Motivated Performance Approach Goal 3.15 .47862 Moderately Motivated Performance Avoid Goal 3.17 .47580 Moderately Motivated Overall Mean 3.32 Moderately Motivated Perception of Teachers Teacher Mastery 3.52 .41557 Highly Motivated Teacher Performance approach 3.18 .37867 Moderately Motivated Overall Mean 3.35 Moderately Motivated Perception of Parents Parent Mastery 3.35 .88905 Moderately Motivated Parent Performance 2.96 .59335 Moderately Motivated Overall Mean 3.16 Moderately Motivated
  • 39.
    RESULTS AND DISCUSSIONS D.Optimal Structural Equation Model that reflects the interrelationships of profile variables and motivational learning factors to the academic achievement of students.
  • 40.
    RESULTS AND DISCUSSIONS χ2 (2)= 4.76, p = 0.087, RMSEA = 0.066, CFI = 0.989, IFI = 0.989, TLI = 0.945 Figure 3. Best Structural Equation Model of Mathematics Achievement
  • 41.
    SUMMARY, CONCLUSIONS AND RECOMMENDATIONS Summary Duringthe analysis of the study, the researcher tested a structural equation model using SPSS and AMOS to explain the motivational learning factor and mathematics achievement of the STEM students of the Division of Nueva Vizcaya. Taking into support on the model was investigated. The mathematical achievement was examined based on the different motivational learning factor such as the academic goal (AG Ave), perception of the teachers (PT Ave) and the perception of the parent (PP Ave). While testing the model, the AGAve and the grade previous had explained a direct effect towards the mathematical achievement of which the grade present. While the mathematical achievement of the students showed a significant positive relationship. Moreover, the perception of the teachers showed a significant relationship towards grade previous and academic goal. However, perception of the parents indicates a negative significant relationship. This means that as one variable increases such as the perception of parents increases, the grade present will decrease and vice versa.
  • 42.
    Summary In this study,the researcher investigated grade previous, academic goal, perception of teacher and perception of parents as main factors that influence the motivational learning of the students in their performance to learn mathematics. Basing on the identified hypothesis of this study was accepted and this finding was consistent with previous researchers as stated in this study. Students’ mathematical achievement is captured based on the intrinsic motivational learning factors based on their achieved academic goal, perception of teachers in learning the subject mathematics. SUMMARY, CONCLUSIONS AND RECOMMENDATIONS
  • 43.
    CONCLUSIONS Based on thesignificant findings of the study, the following conclusions were drawn: 1. Grade 11 and 12 STEM students in the Department of Education, Division of Nueva Vizcaya exhibited an outstanding grades in mathematics during their previous semester and present semester. 2. Grade 11 and 12 STEM students in the Department of Education, Division of Nueva Vizcaya perceived that they are moderately motivated to learn mathematics in terms of their achievement goal, and support from their teachers and parents. 3. The structural equation model of mathematics achievement includes the positive and indirect causal relationship of motivation received by students from teachers and parents as mediated by achievement goals of students as well as the first semester grade, respectively however the direct causal effect of the motivation from parents have a negative effect to the mathematics achievement of students. SUMMARY, CONCLUSIONS AND RECOMMENDATIONS
  • 44.
    SUMMARY, CONCLUSIONS AND RECOMMENDATIONS Recommendations Basedon the drawn conclusions, the following suggestive recommendations must be considered as follows: 1. The study showed a significant performance of students in mathematics. This further recommends monitoring and evaluating the best practices of the teachers in teaching mathematics as well as the continuous upgrade of their professional development. 2. This study further suggests that teachers may enhance their knowledge in the field of motivation strategies in mathematics through attendance to seminars to become more affective in developing greater interest of students to learn mathematics. 3. School officials may device programs and projects that may help improve the role of the parents in the delivery of learning in mathematics. It also further recommends to conduct need analysis to determine the specific intervention that can address the factor leading to the mathematical achievement of the students. 4. For future researchers, further studies may be conducted in terms of other motivational learning factors that may affect the mathematics achievement of students
  • 45.

Editor's Notes

  • #3 The researcher was driven to carry out this study with these four reasons.
  • #5 Which is still in line with the goal of the enhance basic education curriculum which is to prepare the learners to become globally competitive
  • #15 The figure above shows how the different variables interrelate with math achievement. Extrinsic-PT-Perception of teachers a. Teacher Mastery (PT1) b. Teacher-Performance Approach (PT 2) PP-Perception of Parents a. Parent Mastery (PP1) b. Parent Performance (PP2) Intrinsic AG-Achievement Goal a. Mastery Goal (AG1) b. Performance-approach goal (AG2) c. Performance-avoid Goal (AG3) Figure 1 shows how the different variables interrelate with mathematics achievement (GPA_Present) Students’ demographic profile (sex, grade level and GPA_Previous) interact with the extrinsic and intrinsic motivations It is also assumed that students’ demographic profile have significant indirect effect to the motivational learning aspects and have a significant direct effect on mathematics achievement
  • #19 The number of respondents was determined using the proportional stratified sampling technique.
  • #21 2 parts Used to determined sstudents’ demographic profile Questionnaires on the Patterns of Adaptive Learning on the perceived level of AG (14 items),PT (12 items)AND PP (11 items) adopted from MANUAL FOR THE ATTERNS OF ADAPTIVE LEARNING SCALES (PALS) 3. The said questionnaire underwent expert validation for the content of behavioral aspect by the expert psychologists of NVSU 3. The 37 items were randomly spread throughout the questionnaire to avoid the formation of possible reaction patterns
  • #25 Permit to conduct was secured from the office of the schools division superintendent A letter to the principals was endorsed to gather data Questionnaires were distributed to the respondents by the researcher with the help of their mathematics teacher
  • #31 Table 3 shows the ranges of values on indices that determines the goodness and acceptability of the model
  • #32 This chapter provides the answers to the questions raised in this study. It is divided into 4 sections. Presentations on the demographic profile of the students
  • #33 Table 4 shows the distribution of the respondents based on sex and grade level. Out of the 330 respondents, there are 53.6 or 177 female respondents while there are 46.4 or 153 male respondents. In the grade level distribution indicated that 71.5 or 236 Grade 11 senior high school as compared with grade 12 respondents totalling to 28.5 or 94 students. In the study of Egorova and Chertkova (2016) stated that analysis on sex differences in mathematical achievements is considered important in exploring academic achievement based on adequate educational environment with equal opportunities for boys and girls in improving overall mathematical literacy creating balanced professional opportunities of both sexes in the society. While grade level has no direct significance in the achievement in mathematics.
  • #34 Table 5 shows the qualitative description of the grade point average_previous of the respondents in terms of sex and grade level. The overall mean percentage (MP) grade of the students in their previous mathematics subject is 91.07. This indicates that both grade 11 and grade 12 students among STEM-Strand students in the division has recorded a very high mean percentage which obtained a qualitative description of outstanding. It revealed in the study that male mean percentage is 91.13 as compared with the female of 91.02 mean percentage. This implies that those male counterparts are better in mathematics performance. It can be seen that mean percentage of both male and female is not far from the obtained overall mean percentage of 91.07. This therefore support studies of (Ahmed & Bruinsma, 2006) that academic performance is the basic criterion used to assess students success in their studies. It further understands other factors responsible in determining, predicting variance in mathematical achievement. The quality of students’ mathematical achievement is influenced by a range of environmental factors and psychological factors within the learners such as motivation and self- efficacy (Kumar & Karimi, 2010).
  • #36 The above table presents the overall mean percentage of the GPA_Present of the respondents with MP of 90.35. This indicates that sex and grade level distribution of the respondents has close values with their performance. The female counterpart has obtained the MP of 90.50 while the male counterpart obtained MP is 90.18 which both denotes an outstanding performance. On the other hand, the grade 11 of the respondents has obtained a MP of 90.22 as compared with grade 12 with MP of 90.66 indicating that grade 12 outperformed the grade 11 in their mathematics achievement. However both performances in mathematics are closely relative to the overall mean percentage with a qualitative description of outstanding. This implies that the determined variable used for comparison has a significant factor towards the mathematical achievement of the students. It therefore signify mathematics is considered difficult subject however, many students based on their sex and grade level outperformed themselves to achieve a high mathematics grade.
  • #38 Based from the table above, it shows the level of perception of the students in terms of their motivational factors. The achievement goal of the students showed a moderately motivated with an overall mean of 3.32, this is revealed by their mastery goal with highly motivated in terms of mean of 3.63, performance-approach goal with a mean of 3.15 and performance-avoid goal with a mean of 3.17. The academic goal is supported by the student beliefs that they will learn and master new concepts and mastery of the learning competencies improve their skills. It also showed that their goal is simply to be good in class work. This implies that achievement goals of the students are moderately motivated as portrayed by the students not looking trouble doing the work and keep thinking by others to be smart in class. It therefore support the study made that achievement goal portrays human behaviour in diverse ways within a particular content domains and performance context (Nicholls et al., 1990; Dweck, 2000; Linnenbrink and Pintrich, 2002; Elliot et al., 2011). It also further says that academic settings, achievement goals is influenced by learners in how or, if they engage in different learning tasks. (Pintrich, 2003;Elliot et al., 2010) While looking into the perception of teachers showed an overall mean of 3.35 which obtained a qualitative description of moderately motivated. This is presented based on their teachers’ mastery mean of 3.52 with a level as highly motivated. This is revealed by which the teachers assures the students that they understand their work and not just memorize it and dits is okay to commit mistakes as long as the student is learning. Aside from it, the teachers also recognizes the students for trying hard and also giving the students time to explore and understand new ideas. Moreover, teacher performance approach had a mean of 3.18 and with a qualitative description as moderately motivated. This is captured based on the students ability to explore and understand new ideas and perceived by the teachers and recognizes for trying hard. This is manifested based on the students’ mathematics achievement which shows that the student is not hard up with the class work. It can be said that research showed student’s perceptions towards teachers’ expectations as goals related to learning in the class have a significant impact on the students’ behaviour and achievement (Hattie, 2009). In addition, the level of the respondents on perception of parents showed a moderately motivated with an overall mean of 3.16. This is based from parent mastery with a mean of 3.35 of which obtained a moderately motivated and parent performance mean is 2.96 and also moderately motivated. This is based on the students’ goal that parents’ assurance is important that they can do challenging class work, even make mistakes and that they can show their parents how class work relates to things outside of school and most importantly by getting the right answer in class. This further support the study of Stenberg (2005) that motivation is important for school success and students make an effort to learn. It further explains and implies that different quantities and qualities of motivation vary on the learning and teaching context (Ryan & Deci, 2000; Schlechty, 2001).
  • #39  This section presents the optimal structural equation model after a careful analysis of the different factors affecting the mathematics achievement of the students. The factors include the motivational learning factors such as achievement goal, perception of teachers goal and perception of parents goal as indicators based on the different independent variables such as the sex, grade level and grade point average in the previous mathematics subject. The obtained model explains the effect of motivational learning factors and profile variables to the mathematics achievement of senior high school students under STEM-Strand using the following variables, namely, AG Ave, Grade_Prev, Grade_Present, PT Ave and PPAve. Perception of Teachers Goal (PT Ave) and Perception of Parents Goal (PPAve) were exogenous (INDEPENDENT) variable while Achievement Goal (AG Ave), GPA Previous (Grade_Prev) and GPA Present (Grade_Ores) were the endogenous (DEPENDENT) variables. The chi-square. Goodness of Fit Index (GF), Root Mean Square Error of Approximation (RMSEA), Comparative Fit Index (CFI), Non-Normed Fit Index/Tucker Lewis Index (NNFI/TLI) and Incremental Fit Index (IFI) were examined to check the correctness of the solution and goodness-of-fit of the model. All the indices meet their commonly accepted level, demonstrating that the measurement model exhibited a good fit. Standardized path coefficients of structural model were shown in the figure. Furthermore, the hypothesized path model was shown in the conceptual framework of the study. After testing all indicated paths, some paths were deleted from the model until optimal model was achieved. That is, all paths that resulted to non-significant p-values were deleted to come up with the best fit model. This process is called the trimming of the model for better fit.
  • #40 Figure 3 presents the optimal model for mathematics achievement of students based on motivational learning factors, previous grade of the STEM-Strand students of the Division of Nueva Vizcaya. The exogenous variables consisting of Perception of Teachers Goal (PTAve) and Perception of Parents Goal (PPAve) are included in the model. It also included the endogenous variables, Achievement Goal (AGAve) and GPA Previous in the model. The model was fit with Chi-square value of 4.76, degrees of freedom of 2 and probability level of .087 since the chi-square is within 2 and 5 and the p-value is within the range of 0.05 to 1.0 as Schermelleh-Engel & Moosbrugger (2003) stated that the model is in good fit if p-value is greater than 0.05 but less than or equal to 1 (Table 3. Indices of Good Fit models). RMSEA value is 0.066 which is less than 0.08 which imply that the model is considered fit. CFI and IFI are both have the same value of 0. 989 wherein the IFI suggests similar idea on coefficient of determination, thus the value is closed to one (1) manifesting the best possible fit. The value of TLI of 0.945 is within the acceptable fit which is less than the boundary of 0.95. Thus the model is in good fit since all the values are within the ranges of model fit indices. As shown in the given figure, the motivation shown by both teachers and parents are considered covariance and had causal effect to mathematics achievement of students (grade present). Specifically, Perception of Teachers Goal (PT Ave) has an indirect causal effect to the present grade of students as it is mediated by Achievement Goal (AG Ave). The beta coefficient of 0.57 on the path from PT Ave to AG Ave indicates that for every unit increase on the PT Ave, there is 0.57 increase in the AG Ave. Also, the path from AG Ave to present grade has a beta coefficient of 0.71 which means that for every unit increase in Ag Ave, there is a corresponding increase of 0.71 in the present grade. This path indicates that the mathematics achievement of students is influenced by the motivation given by their teachers as reflected on the way the students establish their confidence to learn mathematics. This result can be traced from the explanation of Mueller, Yankelewitz, and Maher (2011) wherein intrinsic motivation fosters positive dispositions toward mathematics, which, in turn, encourage students to develop self-efficacy and mathematical autonomy as they discuss and share their understandings with their classmates and teachers. A similar pattern is shown on the path from Perception of Teachers Goal (PT Ave) to Previous Grade of students then a path to mathematics achievement. It shows that the previous grade of students is influenced by the students’ perception to have obtained motivation from their teachers which will eventually affect their present grade or achievement in mathematics. The path from PT Ave to the previous grade of students has a coefficient of 1.07 which means that for every unit increase of PT Ave, there is 1.07 unit increase on their previous grade. Also the coefficient from previous grade to present grade of 0.65 indicates that for every unit increase on their previous grade, there is a corresponding 0.65 increase on their present grade (mathematics achievement). That is, the previous grade of students is affected by the motivation given by their teachers which will also the reason of their outcomes in their mathematics achievement. This result is justified by the result of the study of Rifandi (2013) who found that there is a correlation between the roles of teacher and students’ motivation that would improve student motivation towards mathematics. It was also explained that if teacher designs an adequate teaching and learning activity for the learning process, the students’ interest will increase. On the other hand, there is a direct path from Perception of Parents Goal (PPAve) to Mathematics Achievement, however, the beta coefficient is -0.27. The negative value indicates that the motivation received by students from parents may tend to have an adverse effect to the mathematics achievement of their children. That is, for every single unit increase on their perception towards Parents Goal, there is 0.27 unit decrease on the present grade of students. It can be traced that during the last semester of the school year, parents had higher expectations towards the academic achievement to their children which may result to emotional distress which may affect their academics. Anderson (2015) articulated that high parental expectations are associated with high academic achievement however, setting expectations too high is counterproductive. In addition, the motivation shown by parents to their children have an indirect effect to the mathematics achievement of students as mediated by their previous grade. The first path manifests a beta coefficient of 0.25 which indicates that every single unit increase on the perception towards parents goal correspond a 0.25 unit increase on their previous grade. It shows that the motivation shown by parent to their children during the first semester of school year had a positive impact to the first semester grade of students. It implies that supportive parents will enhance the academic performance of their children. This result is supported by the study of Mahuro, G.M., Hungi, N. (2016) concluded that for students to reap maximum benefits in an education system, the learning should not be solely left to the student–teacher relationship but should be extended to include active parental involvement among other education stakeholders.