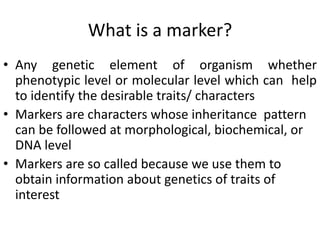
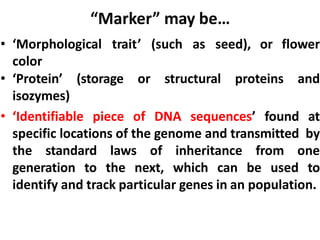
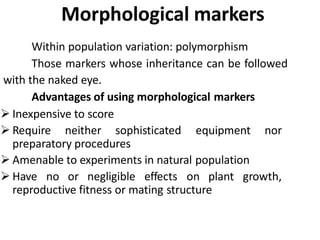
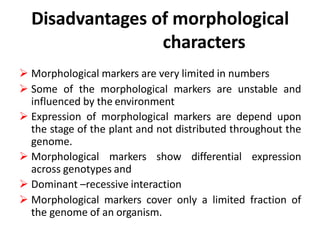
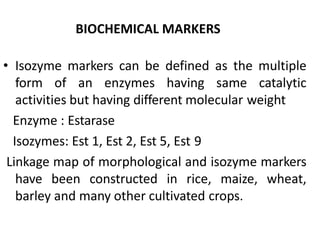
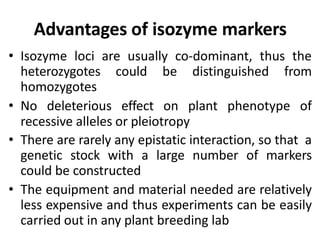
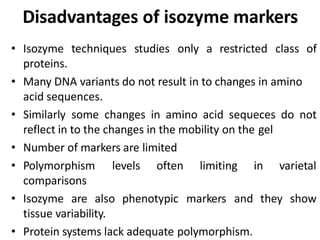
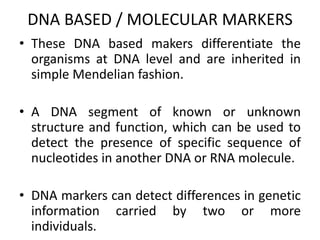
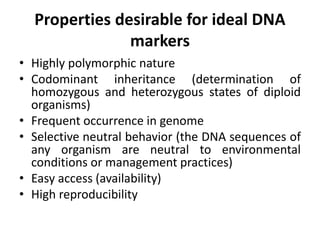
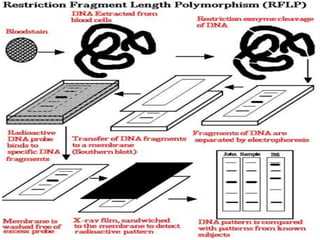
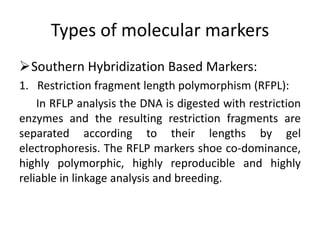
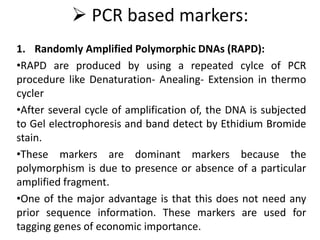
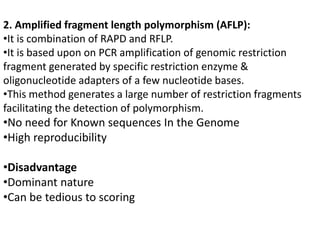
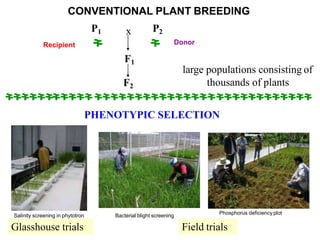
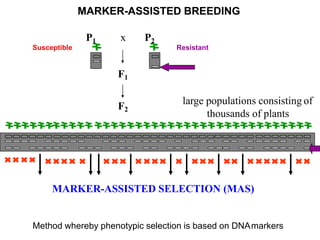
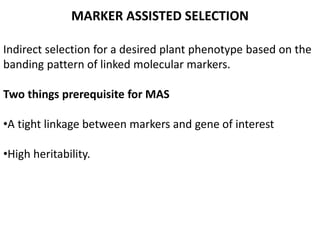
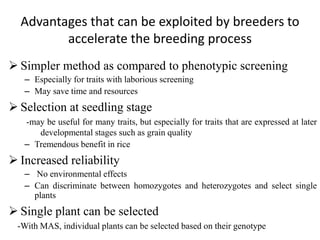
Molecular markers and
Marker Assisted Selection
What is a marker?
• Any genetic element of organism whether
phenotypic level or molecular level which can help
to identify the desirable traits/ characters
• Markers are characters whose inheritance pattern
can be followed at morphological, biochemical, or
DNA level
• Markers are so called because we use them to
obtain information about genetics of traits of
interest
“Marker” may be…
• ‘Morphological trait’ (such as seed), or flower
color
• ‘Protein’ (storage or structural proteins and
isozymes)
• ‘Identifiable piece of DNA sequences’ found at
specific locations of the genome and transmitted by
the standard laws of inheritance from one
generation to the next, which can be used to
identify and track particular genes in an population.
CLASSIFICATION OF MARKERS
MORPHOLOGICAL MARKERS
BIOCHEMICAL MARKERS
DNA BASED / MOLECULAR MARKERS
Morphological markers
Within population variation: polymorphism
Those markers whose inheritance can be followed
with the naked eye.
Advantages of using morphological markers
 Inexpensive to score
 Require neither sophisticated equipment nor
preparatory procedures
 Amenable to experiments in natural population
 Have no or negligible effects on plant growth,
reproductive fitness or mating structure
Disadvantages of morphological
characters
 Morphological markers are very limited in numbers
 Some of the morphological markers are unstable and
influenced by the environment
 Expression of morphological markers are depend upon
the stage of the plant and not distributed throughout the
genome.
 Morphological markers show differential expression
across genotypes and
 Dominant –recessive interaction
 Morphological markers cover only a limited fraction of
the genome of an organism.
BIOCHEMICAL MARKERS
• Isozyme markers can be defined as the multiple
form of an enzymes having same catalytic
activities but having different molecular weight
Enzyme : Estarase
Isozymes: Est 1, Est 2, Est 5, Est 9
Linkage map of morphological and isozyme markers
have been constructed in rice, maize, wheat,
barley and many other cultivated crops.
Advantages of isozyme markers
• Isozyme loci are usually co-dominant, thus the
heterozygotes could be distinguished from
homozygotes
• No deleterious effect on plant phenotype of
recessive alleles or pleiotropy
• There are rarely any epistatic interaction, so that a
genetic stock with a large number of markers
could be constructed
• The equipment and material needed are relatively
less expensive and thus experiments can be easily
carried out in any plant breeding lab
Disadvantages of isozyme markers
• Isozyme techniques studies only a restricted class of
proteins.
• Many DNA variants do not result in to changes in amino
acid sequences.
• Similarly some changes in amino acid sequeces do not
reflect in to the changes in the mobility on the gel
• Number of markers are limited
• Polymorphism levels often limiting in varietal
comparisons
• Isozyme are also phenotypic markers and they show
tissue variability.
• Protein systems lack adequate polymorphism.
DNA BASED / MOLECULAR MARKERS
• These DNA based makers differentiate the
organisms at DNA level and are inherited in
simple Mendelian fashion.
• A DNA segment of known or unknown
structure and function, which can be used to
detect the presence of specific sequence of
nucleotides in another DNA or RNA molecule.
• DNA markers can detect differences in genetic
information carried by two or more
individuals.
Properties desirable for ideal DNA
markers
• Highly polymorphic nature
• Codominant inheritance (determination of
homozygous and heterozygous states of diploid
organisms)
• Frequent occurrence in genome
• Selective neutral behavior (the DNA sequences of
any organism are neutral to environmental
conditions or management practices)
• Easy access (availability)
• High reproducibility
DNA markers
A DNA marker is a DNA sequence which is readily detected
and whose inheritance can easily be monitored.
1. Hybridization based
RFLP
2. Polymerase Chain Reaction (PCR) based markers
RAPD,
AFLP and
Microsatellite/SSR
3. Sequence based markers
ESTs,
SNPs
Southern hybridization
First devised by Professor Sir Edwin Mellor Southern in
(1975)
Fellow of the Royal Society, Knight Bachelor
Biochemistry professor at the University of Oxford
Applications of Southern hybridization
RFLP’s, VNTR’s and DNA fingerprinting
Checking of the gene knockout mice
Flow chart of Southern hybridization
Preparing the samples and running the gel
Southern transfer
Probe preparation
Prehybridization
Hybridization
Post-hybridization washing
Signal detection
Isotope
Non-isotope
RFLP (Restriction Fragment Length Polymorphisms)
•RFLP, as a molecular marker, is specific to a single
clone/restriction enzyme combination.
•RFLP markers follow southern blotting principle viz.,
cutting the DNA into different fragments by restriction
enzyme , hybridized with specific DNA probe and
detect by Radiography.
Types of molecular markers
Southern Hybridization Based Markers:
1. Restriction fragment length polymorphism (RFPL):
In RFLP analysis the DNA is digested with restriction
enzymes and the resulting restriction fragments are
separated according to their lengths by gel
electrophoresis. The RFLP markers shoe co-dominance,
highly polymorphic, highly reproducible and highly
reliable in linkage analysis and breeding.
 PCR based markers:
1. Randomly Amplified Polymorphic DNAs (RAPD):
•RAPD are produced by using a repeated cylce of PCR
procedure like Denaturation- Anealing- Extension in thermo
cycler
•After several cycle of amplification of, the DNA is subjected
to Gel electrophoresis and band detect by Ethidium Bromide
stain.
•These markers are dominant markers because the
polymorphism is due to presence or absence of a particular
amplified fragment.
•One of the major advantage is that this does not need any
prior sequence information. These markers are used for
tagging genes of economic importance.
2. Amplified fragment length polymorphism (AFLP):
•It is combination of RAPD and RFLP.
•It is based upon on PCR amplification of genomic restriction
fragment generated by specific restriction enzyme &
oligonucleotide adapters of a few nucleotide bases.
•This method generates a large number of restriction fragments
facilitating the detection of polymorphism.
•No need for Known sequences In the Genome
•High reproducibility
•Disadvantage
•Dominant nature
•Can be tedious to scoring
3. Simple sequence repeats (SSRs)
Also called as microsatellites, are short tandem repeats of
mono, di, tri, tetra and pentanucleotides dispersed
throughout the genome.
These are flanked with unique sequence that are highly
conserved. The flanking unique sequences are analyzed and
their complementary primers synthesized.
Jefferys (1985) showed that some RFLPs are caused by VNTRs
(Variable number of tandem repeat) these are known as
minisatellites and have similiarity to larger satellite DNA
repeats.
VNTRs are the tandem repeats of short nucleotides that occur
at large number of loci throughout the genome.
•Microsatellite are highly polymorphic codominant markers
and alleles are inherited in a mendellian fashion with quite
higher mutation rates and heterozygosity.
•Dinucleotide are the most abundant microsatellite in
eukaryotic.
•useful in genome mapping in plants, marker assisted
selection and finally for crop improvement
Sequence based markers
5. Expressed Sequence Tags
• Expressed sequence tags (ESTs) are single-pass
reads of approximately 200–800 base pairs (bp)
generated from randomly selected cDNA clones.
• ESTs are fragments of mRNA sequences derived
through single sequencing reactions performed on
randomly selected clones from cDNA libraries.
• EST’s are typically unedited processed single read
sequences produced from cDNA.
• EST’s may be 5’ or 3’.
6. SNPs
• The variations which are found at a single nucleotide
position are referred to as Single Nucleotide Polymorphism
•This type of DNA polymorphism results due to substitution,
deletion or addition
•Its occurs every approx. 1.3 kb
•SNPs are mostly biallelic
Advantages
•Gene Mapping
•Help in detection of mutations at molecular level
•Useful in identification of disease causing genes.
DNA fingerprinting (DNA profiling)
•Up to 1984, the only method of establishing and
authenticating personal identification was by the
fingerprint process.
•DNA fingerprinting technique was devised in 1985
by Alec Jeffrey at University of Leicester in England,
while working on the sequences within myoglobin
gene.
•A technique that DNA allows us to see differences in
DNA profiling fragments from one person to another
in more general form.
•DNA fingerprinting technique is based on Southern
Hybridization
F1
F2
P1 P2x
large populations consisting of
thousands of plants
PHENOTYPIC SELECTION
Field trialsGlasshouse trials
DonorRecipient
CONVENTIONAL PLANT BREEDING
Salinity screening in phytotron Bacterial blight screening
Phosphorus deficiencyplot
F2
F1
P1 x P2
large populations consisting of
thousands of plants
ResistantSusceptible
MARKER-ASSISTED SELECTION (MAS)
MARKER-ASSISTED BREEDING
Method whereby phenotypic selection is based on DNAmarkers
MARKER ASSISTED SELECTION
Indirect selection for a desired plant phenotype based on the
banding pattern of linked molecular markers.
Two things prerequisite for MAS
•A tight linkage between markers and gene of interest
•High heritability.
Advantages that can be exploited by breeders to
accelerate the breeding process
 Simpler method as compared to phenotypic screening
– Especially for traits with laborious screening
– May save time and resources
 Selection at seedling stage
-may be useful for many traits, but especially for traits that are expressed at later
developmental stages such as grain quality
– Tremendous benefit in rice
 Increased reliability
– No environmental effects
– Can discriminate between homozygotes and heterozygotes and select single
plants
 Single plant can be selected
-With MAS, individual plants can be selected based on their genotype
Mapping Population
• Linkage mapping of molecular markers is
based on suitable mapping populations
created purposes.
• These populations are:
Recombinant Inbred Lines (RILs)
Near-Isogenic Lines (NILs)
F2 population
DHs
Backcrosses
Procedure of Marker Assisted Selection
1. Selection of parents
2. Development of mapping population
3. Isolation of DNA from each parents
4. Scoring
5. Correlations with morphological traits
(1) LEAF TISSUE
SAMPLING
(2) DNA EXTRACTION
(3) PCR
(4) GEL ELECTROPHORESIS
(5) MARKER ANALYSIS
Overview of
‘marker
genotyping’
Potential benefits from MAS
• more accurate and
efficient selection of
specific genotypes
– May lead to
accelerated variety
development
• more efficient use of
resources
– Especially field trials
Crossing house
Backcross nursery
Achievements of MAS in India
•Development of MAS based advanced derived lines
for resistance to tomato leaf curl New Delhi virus in
tomato from Pusa Ruby, Pusa Rohini and Pusa-120.
•Numerous varieties has been released in Rice, maize
Improved Pusa Basmati-1 BLB resistance
Improved Sambha Mahsuri BLB resistance
Swarna Sub-1 Submergence resistance
Vivek QPM 9 a maize hybrid has 2.67% lysine and
0.83% tryptophan in the protein, besides 8.15 parts
ppm of pro-vitamin A.
PEDIGREE METHOD
P1 x P2
F1
F2
F3
F4
F5
F6
F7
F8 – F12
Phenotypic
screening
Plants space-
planted in rows for
individual plant
selection
Families grown in
progeny rows for
selection.
Preliminary yield
trials. Select single
plants.
Further yield
trials
Multi-location testing, licensing, seed increase
and cultivar release
P1 x P2
F1
F2
F3
MAS
SINGLE-LARGE SCALE MARKER-
ASSISTED SELECTION (SLS-MAS)
F4
Families grown in
progeny rows for
selection.
Pedigreeselection
based on local
needs
F6
F7
F5
F8 – F12
Multi-location testing, licensing, seed increase
and cultivar release
Only desirableF3
lines planted in
field
Benefits: breeding program can be efficiently
scaled down to focus on fewer lines
F2
F1
P1 x P2
large populations (e.g. 2000 plants)
ResistantSusceptible
MAS for 1 QTL – 75% elimination of (3/4) unwantedgenotypes
MAS for 2 QTLs – 94% elimination of (15/16) unwanted genotypes
Combined approaches
• In some cases, a combination of
phenotypic screening and MAS approach
may be useful
1. To maximize genetic gain (when some QTLs
have been unidentified from QTL mapping)
2. Level of recombination between marker and
QTL (in other words marker is not 100%
accurate)
3. To reduce population sizes for traits where
marker genotyping is cheaper or easier than
phenotypic screening
Some possible reasons to explain the
low impact of MAS in crop
improvement
• Resources (equipment) not available
• Markers may not be cost-effective
• Accuracy of QTL mapping studies
• QTL effects may depend on genetic background
or be influenced by environmental conditions
• Lack of marker polymorphism in
breeding material
• Poor integration of molecular genetics
and conventional breeding
Cost - a major obstacle
• Cost-efficiency has rarely been
calculated but MAS is more
expensive for most traits
– Exceptions include quality traits
• Determined by:
– Trait and method for phenotypic
screening
– Cost of glasshouse/field trials
– Labour costs
– Type of markers used

Molecular markers and mas

  • 1.
    Molecular markers and MarkerAssisted Selection
  • 2.
    What is amarker? • Any genetic element of organism whether phenotypic level or molecular level which can help to identify the desirable traits/ characters • Markers are characters whose inheritance pattern can be followed at morphological, biochemical, or DNA level • Markers are so called because we use them to obtain information about genetics of traits of interest
  • 3.
    “Marker” may be… •‘Morphological trait’ (such as seed), or flower color • ‘Protein’ (storage or structural proteins and isozymes) • ‘Identifiable piece of DNA sequences’ found at specific locations of the genome and transmitted by the standard laws of inheritance from one generation to the next, which can be used to identify and track particular genes in an population.
  • 4.
    CLASSIFICATION OF MARKERS MORPHOLOGICALMARKERS BIOCHEMICAL MARKERS DNA BASED / MOLECULAR MARKERS
  • 5.
    Morphological markers Within populationvariation: polymorphism Those markers whose inheritance can be followed with the naked eye. Advantages of using morphological markers  Inexpensive to score  Require neither sophisticated equipment nor preparatory procedures  Amenable to experiments in natural population  Have no or negligible effects on plant growth, reproductive fitness or mating structure
  • 6.
    Disadvantages of morphological characters Morphological markers are very limited in numbers  Some of the morphological markers are unstable and influenced by the environment  Expression of morphological markers are depend upon the stage of the plant and not distributed throughout the genome.  Morphological markers show differential expression across genotypes and  Dominant –recessive interaction  Morphological markers cover only a limited fraction of the genome of an organism.
  • 7.
    BIOCHEMICAL MARKERS • Isozymemarkers can be defined as the multiple form of an enzymes having same catalytic activities but having different molecular weight Enzyme : Estarase Isozymes: Est 1, Est 2, Est 5, Est 9 Linkage map of morphological and isozyme markers have been constructed in rice, maize, wheat, barley and many other cultivated crops.
  • 8.
    Advantages of isozymemarkers • Isozyme loci are usually co-dominant, thus the heterozygotes could be distinguished from homozygotes • No deleterious effect on plant phenotype of recessive alleles or pleiotropy • There are rarely any epistatic interaction, so that a genetic stock with a large number of markers could be constructed • The equipment and material needed are relatively less expensive and thus experiments can be easily carried out in any plant breeding lab
  • 9.
    Disadvantages of isozymemarkers • Isozyme techniques studies only a restricted class of proteins. • Many DNA variants do not result in to changes in amino acid sequences. • Similarly some changes in amino acid sequeces do not reflect in to the changes in the mobility on the gel • Number of markers are limited • Polymorphism levels often limiting in varietal comparisons • Isozyme are also phenotypic markers and they show tissue variability. • Protein systems lack adequate polymorphism.
  • 10.
    DNA BASED /MOLECULAR MARKERS • These DNA based makers differentiate the organisms at DNA level and are inherited in simple Mendelian fashion. • A DNA segment of known or unknown structure and function, which can be used to detect the presence of specific sequence of nucleotides in another DNA or RNA molecule. • DNA markers can detect differences in genetic information carried by two or more individuals.
  • 11.
    Properties desirable forideal DNA markers • Highly polymorphic nature • Codominant inheritance (determination of homozygous and heterozygous states of diploid organisms) • Frequent occurrence in genome • Selective neutral behavior (the DNA sequences of any organism are neutral to environmental conditions or management practices) • Easy access (availability) • High reproducibility
  • 12.
    DNA markers A DNAmarker is a DNA sequence which is readily detected and whose inheritance can easily be monitored. 1. Hybridization based RFLP 2. Polymerase Chain Reaction (PCR) based markers RAPD, AFLP and Microsatellite/SSR 3. Sequence based markers ESTs, SNPs
  • 13.
    Southern hybridization First devisedby Professor Sir Edwin Mellor Southern in (1975) Fellow of the Royal Society, Knight Bachelor Biochemistry professor at the University of Oxford Applications of Southern hybridization RFLP’s, VNTR’s and DNA fingerprinting Checking of the gene knockout mice
  • 14.
    Flow chart ofSouthern hybridization Preparing the samples and running the gel Southern transfer Probe preparation Prehybridization Hybridization Post-hybridization washing Signal detection Isotope Non-isotope
  • 15.
    RFLP (Restriction FragmentLength Polymorphisms) •RFLP, as a molecular marker, is specific to a single clone/restriction enzyme combination. •RFLP markers follow southern blotting principle viz., cutting the DNA into different fragments by restriction enzyme , hybridized with specific DNA probe and detect by Radiography.
  • 17.
    Types of molecularmarkers Southern Hybridization Based Markers: 1. Restriction fragment length polymorphism (RFPL): In RFLP analysis the DNA is digested with restriction enzymes and the resulting restriction fragments are separated according to their lengths by gel electrophoresis. The RFLP markers shoe co-dominance, highly polymorphic, highly reproducible and highly reliable in linkage analysis and breeding.
  • 18.
     PCR basedmarkers: 1. Randomly Amplified Polymorphic DNAs (RAPD): •RAPD are produced by using a repeated cylce of PCR procedure like Denaturation- Anealing- Extension in thermo cycler •After several cycle of amplification of, the DNA is subjected to Gel electrophoresis and band detect by Ethidium Bromide stain. •These markers are dominant markers because the polymorphism is due to presence or absence of a particular amplified fragment. •One of the major advantage is that this does not need any prior sequence information. These markers are used for tagging genes of economic importance.
  • 19.
    2. Amplified fragmentlength polymorphism (AFLP): •It is combination of RAPD and RFLP. •It is based upon on PCR amplification of genomic restriction fragment generated by specific restriction enzyme & oligonucleotide adapters of a few nucleotide bases. •This method generates a large number of restriction fragments facilitating the detection of polymorphism. •No need for Known sequences In the Genome •High reproducibility •Disadvantage •Dominant nature •Can be tedious to scoring
  • 21.
    3. Simple sequencerepeats (SSRs) Also called as microsatellites, are short tandem repeats of mono, di, tri, tetra and pentanucleotides dispersed throughout the genome. These are flanked with unique sequence that are highly conserved. The flanking unique sequences are analyzed and their complementary primers synthesized. Jefferys (1985) showed that some RFLPs are caused by VNTRs (Variable number of tandem repeat) these are known as minisatellites and have similiarity to larger satellite DNA repeats. VNTRs are the tandem repeats of short nucleotides that occur at large number of loci throughout the genome.
  • 22.
    •Microsatellite are highlypolymorphic codominant markers and alleles are inherited in a mendellian fashion with quite higher mutation rates and heterozygosity. •Dinucleotide are the most abundant microsatellite in eukaryotic. •useful in genome mapping in plants, marker assisted selection and finally for crop improvement
  • 23.
    Sequence based markers 5.Expressed Sequence Tags • Expressed sequence tags (ESTs) are single-pass reads of approximately 200–800 base pairs (bp) generated from randomly selected cDNA clones. • ESTs are fragments of mRNA sequences derived through single sequencing reactions performed on randomly selected clones from cDNA libraries. • EST’s are typically unedited processed single read sequences produced from cDNA. • EST’s may be 5’ or 3’.
  • 25.
    6. SNPs • Thevariations which are found at a single nucleotide position are referred to as Single Nucleotide Polymorphism •This type of DNA polymorphism results due to substitution, deletion or addition •Its occurs every approx. 1.3 kb •SNPs are mostly biallelic Advantages •Gene Mapping •Help in detection of mutations at molecular level •Useful in identification of disease causing genes.
  • 26.
    DNA fingerprinting (DNAprofiling) •Up to 1984, the only method of establishing and authenticating personal identification was by the fingerprint process. •DNA fingerprinting technique was devised in 1985 by Alec Jeffrey at University of Leicester in England, while working on the sequences within myoglobin gene. •A technique that DNA allows us to see differences in DNA profiling fragments from one person to another in more general form.
  • 27.
    •DNA fingerprinting techniqueis based on Southern Hybridization
  • 28.
    F1 F2 P1 P2x large populationsconsisting of thousands of plants PHENOTYPIC SELECTION Field trialsGlasshouse trials DonorRecipient CONVENTIONAL PLANT BREEDING Salinity screening in phytotron Bacterial blight screening Phosphorus deficiencyplot
  • 29.
    F2 F1 P1 x P2 largepopulations consisting of thousands of plants ResistantSusceptible MARKER-ASSISTED SELECTION (MAS) MARKER-ASSISTED BREEDING Method whereby phenotypic selection is based on DNAmarkers
  • 30.
    MARKER ASSISTED SELECTION Indirectselection for a desired plant phenotype based on the banding pattern of linked molecular markers. Two things prerequisite for MAS •A tight linkage between markers and gene of interest •High heritability.
  • 31.
    Advantages that canbe exploited by breeders to accelerate the breeding process  Simpler method as compared to phenotypic screening – Especially for traits with laborious screening – May save time and resources  Selection at seedling stage -may be useful for many traits, but especially for traits that are expressed at later developmental stages such as grain quality – Tremendous benefit in rice  Increased reliability – No environmental effects – Can discriminate between homozygotes and heterozygotes and select single plants  Single plant can be selected -With MAS, individual plants can be selected based on their genotype
  • 32.
    Mapping Population • Linkagemapping of molecular markers is based on suitable mapping populations created purposes. • These populations are: Recombinant Inbred Lines (RILs) Near-Isogenic Lines (NILs) F2 population DHs Backcrosses
  • 33.
    Procedure of MarkerAssisted Selection 1. Selection of parents 2. Development of mapping population 3. Isolation of DNA from each parents 4. Scoring 5. Correlations with morphological traits
  • 34.
    (1) LEAF TISSUE SAMPLING (2)DNA EXTRACTION (3) PCR (4) GEL ELECTROPHORESIS (5) MARKER ANALYSIS Overview of ‘marker genotyping’
  • 35.
    Potential benefits fromMAS • more accurate and efficient selection of specific genotypes – May lead to accelerated variety development • more efficient use of resources – Especially field trials Crossing house Backcross nursery
  • 36.
    Achievements of MASin India •Development of MAS based advanced derived lines for resistance to tomato leaf curl New Delhi virus in tomato from Pusa Ruby, Pusa Rohini and Pusa-120. •Numerous varieties has been released in Rice, maize Improved Pusa Basmati-1 BLB resistance Improved Sambha Mahsuri BLB resistance Swarna Sub-1 Submergence resistance Vivek QPM 9 a maize hybrid has 2.67% lysine and 0.83% tryptophan in the protein, besides 8.15 parts ppm of pro-vitamin A.
  • 37.
    PEDIGREE METHOD P1 xP2 F1 F2 F3 F4 F5 F6 F7 F8 – F12 Phenotypic screening Plants space- planted in rows for individual plant selection Families grown in progeny rows for selection. Preliminary yield trials. Select single plants. Further yield trials Multi-location testing, licensing, seed increase and cultivar release P1 x P2 F1 F2 F3 MAS SINGLE-LARGE SCALE MARKER- ASSISTED SELECTION (SLS-MAS) F4 Families grown in progeny rows for selection. Pedigreeselection based on local needs F6 F7 F5 F8 – F12 Multi-location testing, licensing, seed increase and cultivar release Only desirableF3 lines planted in field Benefits: breeding program can be efficiently scaled down to focus on fewer lines
  • 38.
    F2 F1 P1 x P2 largepopulations (e.g. 2000 plants) ResistantSusceptible MAS for 1 QTL – 75% elimination of (3/4) unwantedgenotypes MAS for 2 QTLs – 94% elimination of (15/16) unwanted genotypes
  • 39.
    Combined approaches • Insome cases, a combination of phenotypic screening and MAS approach may be useful 1. To maximize genetic gain (when some QTLs have been unidentified from QTL mapping) 2. Level of recombination between marker and QTL (in other words marker is not 100% accurate) 3. To reduce population sizes for traits where marker genotyping is cheaper or easier than phenotypic screening
  • 40.
    Some possible reasonsto explain the low impact of MAS in crop improvement • Resources (equipment) not available • Markers may not be cost-effective • Accuracy of QTL mapping studies • QTL effects may depend on genetic background or be influenced by environmental conditions • Lack of marker polymorphism in breeding material • Poor integration of molecular genetics and conventional breeding
  • 41.
    Cost - amajor obstacle • Cost-efficiency has rarely been calculated but MAS is more expensive for most traits – Exceptions include quality traits • Determined by: – Trait and method for phenotypic screening – Cost of glasshouse/field trials – Labour costs – Type of markers used