Hypotheses testing is used by statisticians to determine whether to reject statements about populations. It involves stating the null and alternative hypotheses, choosing a significance level, computing the test statistic, determining critical values or p-values, and drawing a conclusion. Two examples are provided to demonstrate the process of hypotheses testing for means when variance and distribution are known.
1. HYPOTHESES TESTING is procedure used by statisticians to determine whether or not to reject a
statement about a population. The following steps in hypotheses testing for population mean when the
variance is known and the population is assumed to follow normal distribution:
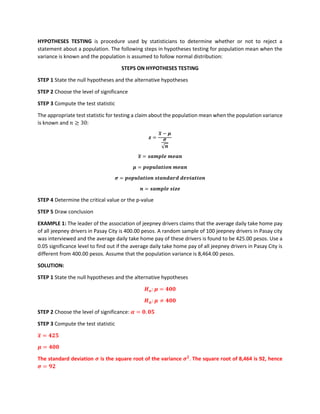
STEPS ON HYPOTHESES TESTING
STEP 1 State the null hypotheses and the alternative hypotheses
STEP 2 Choose the level of significance
STEP 3 Compute the test statistic
The appropriate test statistic for testing a claim about the population mean when the population variance
is known and 𝑛 ≥ 30:
𝒛 =
𝒙
̅ − 𝝁
𝝈
√𝒏
𝒙
̅ = 𝒔𝒂𝒎𝒑𝒍𝒆 𝒎𝒆𝒂𝒏
𝝁 = 𝒑𝒐𝒑𝒖𝒍𝒂𝒕𝒊𝒐𝒏 𝒎𝒆𝒂𝒏
𝝈 = 𝒑𝒐𝒑𝒖𝒍𝒂𝒕𝒊𝒐𝒏 𝒔𝒕𝒂𝒏𝒅𝒂𝒓𝒅 𝒅𝒆𝒗𝒊𝒂𝒕𝒊𝒐𝒏
𝒏 = 𝒔𝒂𝒎𝒑𝒍𝒆 𝒔𝒊𝒛𝒆
STEP 4 Determine the critical value or the p-value
STEP 5 Draw conclusion
EXAMPLE 1: The leader of the association of jeepney drivers claims that the average daily take home pay
of all jeepney drivers in Pasay City is 400.00 pesos. A random sample of 100 jeepney drivers in Pasay city
was interviewed and the average daily take home pay of these drivers is found to be 425.00 pesos. Use a
0.05 significance level to find out if the average daily take home pay of all jeepney drivers in Pasay City is
different from 400.00 pesos. Assume that the population variance is 8,464.00 pesos.
SOLUTION:
STEP 1 State the null hypotheses and the alternative hypotheses
𝑯𝒐: 𝝁 = 𝟒𝟎𝟎
𝑯𝒂: 𝝁 ≠ 𝟒𝟎𝟎
STEP 2 Choose the level of significance: 𝜶 = 𝟎. 𝟎𝟓
STEP 3 Compute the test statistic
𝒙
̅ = 𝟒𝟐𝟓
𝝁 = 𝟒𝟎𝟎
The standard deviation 𝝈 is the square root of the variance 𝝈𝟐
. The square root of 8,464 is 92, hence
𝝈 = 𝟗𝟐
2. 𝒛 =
𝟒𝟐𝟓 − 𝟒𝟎𝟎
𝟗𝟐
√𝟏𝟎𝟎
= 𝟐. 𝟕𝟐
STEP 4 Determine the critical value or the p-value
The alternative hypothesis is non-directional; hence, the two-tailed test shall be used. Divide 𝜶 by 2,
and then subtract the quotient from 0.05.
𝜶
𝟐
=
𝟎. 𝟎𝟓
𝟐
= 𝟎. 𝟎𝟐𝟓
𝟎. 𝟓𝟎 − 𝟎. 𝟎𝟐𝟓 = 𝟎. 𝟒𝟕𝟓 𝒐𝒓 𝟎. 𝟒𝟕𝟓𝟎 = ± 𝟏. 𝟗𝟔
STEP 5 Draw conclusion
Because the computed test statistic, z = 2.72 falls within the rejection region (beyond the critical values
± 𝟏. 𝟗𝟔), reject the null hypothesis and accept the alternative hypothesis. Conclude that the average
daily take home pay of jeepney drivers is not equal to 400.00 pesos. This result is considered to be
significant at 𝜶 = 𝟎. 𝟎𝟓 level.
EXAMPLE 2: According to a study done last year, the average monthly expenses for mobile phone loads
of high school students in Manila was 350.00 pesos. A statistics student believes that this amount has
increased since January of this year. Is there a reason to believe that this amount has really increased if a
random sample of 60 students has an average monthly expense for mobile phone loads of 380.00 pesos?
Use 0.05 level of significance. Assume that the population standard deviation is 77.00 pesos.
SOLUTION:
3. STEP 1 State the null hypotheses and the alternative hypotheses
𝑯𝒐: 𝝁 = 𝟑𝟓𝟎
𝑯𝒂: 𝝁 > 𝟑𝟓𝟎
STEP 2 Choose the level of significance: 𝜶 = 𝟎. 𝟎𝟓
STEP 3 Compute the test statistic
𝒙
̅ = 𝟑𝟖𝟎
𝝁 = 𝟑𝟓𝟎
𝝈 = 𝟕𝟕
𝒛 =
𝟑𝟖𝟎 − 𝟑𝟓𝟎
𝟕𝟕
√𝟔𝟎
= 𝟑. 𝟎𝟐
STEP 4 Determine the critical value or the p-value
The alternative hypothesis is directional. Hence, the one-tailed test shall be used. This time, 𝜶 will not
be divided by 2. Subtract 0.05 from 0.5
𝟎. 𝟓 − 𝟎. 𝟎𝟓 = 𝟎. 𝟒𝟓 = 𝟏. 𝟔𝟒𝟓
STEP 5 Draw conclusion
Because the computed test statistic, z = 3.02 falls within the rejection region (beyond the critical values
𝟏. 𝟔𝟒𝟓), reject the null hypothesis and accept the alternative hypothesis. Conclude that the average
monthly expenses for mobile phone loads of high school students in Manila is more than 350.00 pesos.
This result is considered to be significant at 𝜶 = 𝟎. 𝟎𝟓 level.