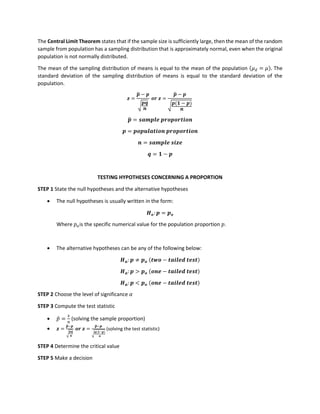
The Central Limit Theorem states that if the sample size is sufficiently large, then the mean of the random
sample from population has a sampling distribution that is approximately normal, even when the original
population is not normally distributed.
The mean of the sampling distribution of means is equal to the mean of the population (𝜇𝑥̅ = 𝜇). The
standard deviation of the sampling distribution of means is equal to the standard deviation of the
population.
𝒛 =
𝒑
̂ − 𝒑
√
𝒑𝒒
𝒏
𝒐𝒓 𝒛 =
𝒑
̂ − 𝒑
√𝒑(𝟏 − 𝒑)
𝒏
𝒑
̂ = 𝒔𝒂𝒎𝒑𝒍𝒆 𝒑𝒓𝒐𝒑𝒐𝒓𝒕𝒊𝒐𝒏
𝒑 = 𝒑𝒐𝒑𝒖𝒍𝒂𝒕𝒊𝒐𝒏 𝒑𝒓𝒐𝒑𝒐𝒓𝒕𝒊𝒐𝒏
𝒏 = 𝒔𝒂𝒎𝒑𝒍𝒆 𝒔𝒊𝒛𝒆
𝒒 = 𝟏 − 𝒑
TESTING HYPOTHESES CONCERNING A PROPORTION
STEP 1 State the null hypotheses and the alternative hypotheses
• The null hypotheses is usually written in the form:
𝑯𝒐:𝒑 = 𝒑𝒐
Where 𝑝𝑜is the specific numerical value for the population proportion 𝑝.
• The alternative hypotheses can be any of the following below:
𝑯𝒂:𝒑 ≠ 𝒑𝒐 (𝒕𝒘𝒐 − 𝒕𝒂𝒊𝒍𝒆𝒅 𝒕𝒆𝒔𝒕)
𝑯𝒂: 𝒑 > 𝒑𝒐 (𝒐𝒏𝒆 − 𝒕𝒂𝒊𝒍𝒆𝒅 𝒕𝒆𝒔𝒕)
𝑯𝒂: 𝒑 < 𝒑𝒐 (𝒐𝒏𝒆 − 𝒕𝒂𝒊𝒍𝒆𝒅 𝒕𝒆𝒔𝒕)
STEP 2 Choose the level of significance 𝛼
STEP 3 Compute the test statistic
• 𝑝̂ =
𝑥
𝑛
(solving the sample proportion)
• 𝒛 =
𝒑
̂−𝒑
√
𝒑𝒒
𝒏
𝒐𝒓 𝒛 =
𝒑
̂−𝒑
√𝒑(𝟏−𝒑)
𝒏
(solving the test statistic)
STEP 4 Determine the critical value
STEP 5 Make a decision
EXAMPLE 1: It is believed that in the coming election, 65% of the voters in the province of Cebu will vote
for the administration candidate for governor. Suppose 713 out of the 1,150 randomly selected voters
indicate that they would vote for the administration candidate. At 0.10 level of significance, find out
whether the percentage of voters for the administration candidate is different from 65%.
SOLUTION:
STEP 1 State the null hypotheses and the alternative hypotheses
𝑯𝒐: 𝒑 = 𝟔𝟓% 𝒐𝒓 𝟎. 𝟔𝟓
𝑯𝒂:𝒑 ≠ 𝟔𝟓% 𝒐𝒓 𝟎. 𝟔𝟓
STEP 2 Choose the level of significance: 𝜶 = 𝟎. 𝟏𝟎
STEP 3 Compute the test statistic
𝒑
̂ =
𝒙
𝒏
=
𝟕𝟏𝟑
𝟏, 𝟏𝟓𝟎
= 𝟎. 𝟔𝟐 (𝒈𝒆𝒕𝒕𝒊𝒏𝒈 𝒕𝒉𝒆 𝒔𝒂𝒎𝒑𝒍𝒆 𝒑𝒓𝒐𝒑𝒐𝒓𝒕𝒊𝒐𝒏)
𝒛 =
𝒑
̂ − 𝒑
√𝒑(𝟏 − 𝒑)
𝒏
=
𝟎. 𝟔𝟐 − 𝟎. 𝟔𝟓
√
𝟎. 𝟔𝟓(𝟏 − 𝟎. 𝟔𝟓)
𝟏, 𝟏𝟓𝟎
= −𝟐. 𝟏𝟑𝟑
STEP 4 Determine the critical value
The alternative hypothesis is non-directional. Hence, the two-tailed test shall be used. Divide the α by 2,
and then subtract the quotient from 0.50.
𝜶
𝟐
=
𝟎. 𝟏𝟎
𝟐
= 𝟎. 𝟎𝟓
𝟎. 𝟓𝟎 − 𝟎. 𝟎𝟓 = 𝟎. 𝟒𝟓 = ± 𝟏. 𝟔𝟒𝟓
STEP 5 Make a decision
Since the computed test statistic 𝒛 = −𝟐. 𝟏𝟑𝟑 falls in the rejection region (beyond the ± 𝟏. 𝟔𝟒𝟓), reject
the null hypothesis. Conclude that at 0.10 level of significance, there is enough evidence that the
percentage of voters for the administration candidate is different from 65%.
EXAMPLE 2: Before the Mayweather vs Pacquiao’s Fight of the Century, 75% of the people in Manila said
that they preferred boxing over basketball. After the fight, out of the 150 randomly chosen people in
Manila, 105 said they preferred boxing over basketball. Does this indicate that people in Manila are losing
interest in boxing? Use 0.05 level of significance.
SOLUTION:
STEP 1 State the null hypotheses and the alternative hypotheses
𝑯𝒐: 𝒑 = 𝟕𝟓% 𝒐𝒓 𝟎. 𝟕𝟓
𝑯𝒂:𝒑 < 𝟕𝟓% 𝒐𝒓 𝟎. 𝟕𝟓
STEP 2 Choose the level of significance: 𝜶 = 𝟎. 𝟎𝟓
STEP 3 Compute the test statistic
𝒑
̂ =
𝒙
𝒏
=
𝟏𝟎𝟓
𝟏𝟓𝟎
= 𝟎. 𝟕𝟎 (𝒈𝒆𝒕𝒕𝒊𝒏𝒈 𝒕𝒉𝒆 𝒔𝒂𝒎𝒑𝒍𝒆 𝒑𝒓𝒐𝒑𝒐𝒓𝒕𝒊𝒐𝒏)
𝒛 =
𝒑
̂ − 𝒑
√𝒑(𝟏 − 𝒑)
𝒏
=
𝟎. 𝟕𝟎 − 𝟎. 𝟕𝟓
√𝟎. 𝟕𝟓(𝟏 − 𝟎. 𝟕𝟓)
𝟏𝟓𝟎
= −𝟏. 𝟒𝟏𝟒
STEP 4 Determine the critical value
The alternative hypothesis is directional. Hence, the one-tailed test shall be used.
𝟎. 𝟓𝟎 − 𝟎. 𝟎𝟓 = 𝟎. 𝟒𝟓 = − 𝟏. 𝟔𝟒𝟓
STEP 5 Make a decision
Since the computed test statistic 𝒛 = −𝟏. 𝟒𝟏𝟒 does not fall in the rejection region (less than the
−𝟏. 𝟔𝟒𝟓), do not reject the null hypothesis. Conclude that at 0.05 level of significance, there is no
evidence to conclude that the people of Manila are losing interest in boxing.

Module08 hypotheses testing proportions

  • 1.
    The Central LimitTheorem states that if the sample size is sufficiently large, then the mean of the random sample from population has a sampling distribution that is approximately normal, even when the original population is not normally distributed. The mean of the sampling distribution of means is equal to the mean of the population (𝜇𝑥̅ = 𝜇). The standard deviation of the sampling distribution of means is equal to the standard deviation of the population. 𝒛 = 𝒑 ̂ − 𝒑 √ 𝒑𝒒 𝒏 𝒐𝒓 𝒛 = 𝒑 ̂ − 𝒑 √𝒑(𝟏 − 𝒑) 𝒏 𝒑 ̂ = 𝒔𝒂𝒎𝒑𝒍𝒆 𝒑𝒓𝒐𝒑𝒐𝒓𝒕𝒊𝒐𝒏 𝒑 = 𝒑𝒐𝒑𝒖𝒍𝒂𝒕𝒊𝒐𝒏 𝒑𝒓𝒐𝒑𝒐𝒓𝒕𝒊𝒐𝒏 𝒏 = 𝒔𝒂𝒎𝒑𝒍𝒆 𝒔𝒊𝒛𝒆 𝒒 = 𝟏 − 𝒑 TESTING HYPOTHESES CONCERNING A PROPORTION STEP 1 State the null hypotheses and the alternative hypotheses • The null hypotheses is usually written in the form: 𝑯𝒐:𝒑 = 𝒑𝒐 Where 𝑝𝑜is the specific numerical value for the population proportion 𝑝. • The alternative hypotheses can be any of the following below: 𝑯𝒂:𝒑 ≠ 𝒑𝒐 (𝒕𝒘𝒐 − 𝒕𝒂𝒊𝒍𝒆𝒅 𝒕𝒆𝒔𝒕) 𝑯𝒂: 𝒑 > 𝒑𝒐 (𝒐𝒏𝒆 − 𝒕𝒂𝒊𝒍𝒆𝒅 𝒕𝒆𝒔𝒕) 𝑯𝒂: 𝒑 < 𝒑𝒐 (𝒐𝒏𝒆 − 𝒕𝒂𝒊𝒍𝒆𝒅 𝒕𝒆𝒔𝒕) STEP 2 Choose the level of significance 𝛼 STEP 3 Compute the test statistic • 𝑝̂ = 𝑥 𝑛 (solving the sample proportion) • 𝒛 = 𝒑 ̂−𝒑 √ 𝒑𝒒 𝒏 𝒐𝒓 𝒛 = 𝒑 ̂−𝒑 √𝒑(𝟏−𝒑) 𝒏 (solving the test statistic) STEP 4 Determine the critical value STEP 5 Make a decision
  • 2.
    EXAMPLE 1: Itis believed that in the coming election, 65% of the voters in the province of Cebu will vote for the administration candidate for governor. Suppose 713 out of the 1,150 randomly selected voters indicate that they would vote for the administration candidate. At 0.10 level of significance, find out whether the percentage of voters for the administration candidate is different from 65%. SOLUTION: STEP 1 State the null hypotheses and the alternative hypotheses 𝑯𝒐: 𝒑 = 𝟔𝟓% 𝒐𝒓 𝟎. 𝟔𝟓 𝑯𝒂:𝒑 ≠ 𝟔𝟓% 𝒐𝒓 𝟎. 𝟔𝟓 STEP 2 Choose the level of significance: 𝜶 = 𝟎. 𝟏𝟎 STEP 3 Compute the test statistic 𝒑 ̂ = 𝒙 𝒏 = 𝟕𝟏𝟑 𝟏, 𝟏𝟓𝟎 = 𝟎. 𝟔𝟐 (𝒈𝒆𝒕𝒕𝒊𝒏𝒈 𝒕𝒉𝒆 𝒔𝒂𝒎𝒑𝒍𝒆 𝒑𝒓𝒐𝒑𝒐𝒓𝒕𝒊𝒐𝒏) 𝒛 = 𝒑 ̂ − 𝒑 √𝒑(𝟏 − 𝒑) 𝒏 = 𝟎. 𝟔𝟐 − 𝟎. 𝟔𝟓 √ 𝟎. 𝟔𝟓(𝟏 − 𝟎. 𝟔𝟓) 𝟏, 𝟏𝟓𝟎 = −𝟐. 𝟏𝟑𝟑 STEP 4 Determine the critical value The alternative hypothesis is non-directional. Hence, the two-tailed test shall be used. Divide the α by 2, and then subtract the quotient from 0.50. 𝜶 𝟐 = 𝟎. 𝟏𝟎 𝟐 = 𝟎. 𝟎𝟓 𝟎. 𝟓𝟎 − 𝟎. 𝟎𝟓 = 𝟎. 𝟒𝟓 = ± 𝟏. 𝟔𝟒𝟓 STEP 5 Make a decision Since the computed test statistic 𝒛 = −𝟐. 𝟏𝟑𝟑 falls in the rejection region (beyond the ± 𝟏. 𝟔𝟒𝟓), reject the null hypothesis. Conclude that at 0.10 level of significance, there is enough evidence that the percentage of voters for the administration candidate is different from 65%. EXAMPLE 2: Before the Mayweather vs Pacquiao’s Fight of the Century, 75% of the people in Manila said that they preferred boxing over basketball. After the fight, out of the 150 randomly chosen people in Manila, 105 said they preferred boxing over basketball. Does this indicate that people in Manila are losing interest in boxing? Use 0.05 level of significance.
  • 3.
    SOLUTION: STEP 1 Statethe null hypotheses and the alternative hypotheses 𝑯𝒐: 𝒑 = 𝟕𝟓% 𝒐𝒓 𝟎. 𝟕𝟓 𝑯𝒂:𝒑 < 𝟕𝟓% 𝒐𝒓 𝟎. 𝟕𝟓 STEP 2 Choose the level of significance: 𝜶 = 𝟎. 𝟎𝟓 STEP 3 Compute the test statistic 𝒑 ̂ = 𝒙 𝒏 = 𝟏𝟎𝟓 𝟏𝟓𝟎 = 𝟎. 𝟕𝟎 (𝒈𝒆𝒕𝒕𝒊𝒏𝒈 𝒕𝒉𝒆 𝒔𝒂𝒎𝒑𝒍𝒆 𝒑𝒓𝒐𝒑𝒐𝒓𝒕𝒊𝒐𝒏) 𝒛 = 𝒑 ̂ − 𝒑 √𝒑(𝟏 − 𝒑) 𝒏 = 𝟎. 𝟕𝟎 − 𝟎. 𝟕𝟓 √𝟎. 𝟕𝟓(𝟏 − 𝟎. 𝟕𝟓) 𝟏𝟓𝟎 = −𝟏. 𝟒𝟏𝟒 STEP 4 Determine the critical value The alternative hypothesis is directional. Hence, the one-tailed test shall be used. 𝟎. 𝟓𝟎 − 𝟎. 𝟎𝟓 = 𝟎. 𝟒𝟓 = − 𝟏. 𝟔𝟒𝟓 STEP 5 Make a decision Since the computed test statistic 𝒛 = −𝟏. 𝟒𝟏𝟒 does not fall in the rejection region (less than the −𝟏. 𝟔𝟒𝟓), do not reject the null hypothesis. Conclude that at 0.05 level of significance, there is no evidence to conclude that the people of Manila are losing interest in boxing.